Brought to you by Scott P. Rogers, Funkhouser Real Estate Group, 540-578-0102, scott@HarrisonburgHousingToday.com
Brought to you by Scott P. Rogers, Funkhouser Real Estate Group, 540-578-0102, scott@HarrisonburgHousingToday.com
Sunday, April 12, 2009
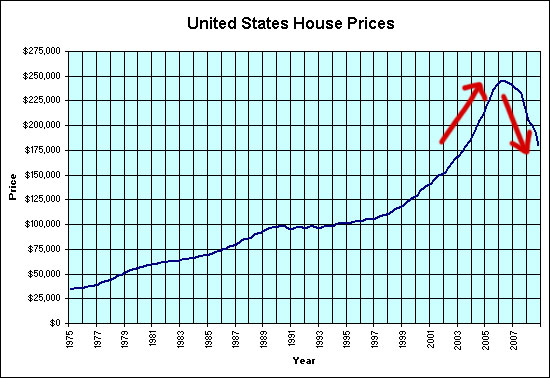
As can be seen below, home values across the U.S. have declined sharply over the past three years, after a sharp increase over the preceding years. (Source: OFHEO)
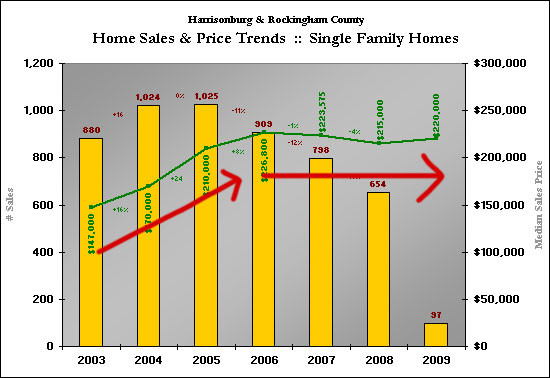
In Harrisonburg and Rockingham County, however, we saw an increase in home values between 2003 and 2006, but we have not seen a comparable decrease between 2006 and 2009. (Source: HRAR MLS)
One of my blog readers (who has a Ph.D. in Assessment and Measurement) wonders whether we will see a decline in home values in Harrisonburg and Rockingham County because of a principle called "Regression to the Mean". This principle suggests that over time things (scores, prices, etc) revert back to the mean.
Let's use this concept to examine what might happen to home values in our area. Using OFHEO data, we see that home values across the entire United States have increased (on average) four percent per year since 1991.
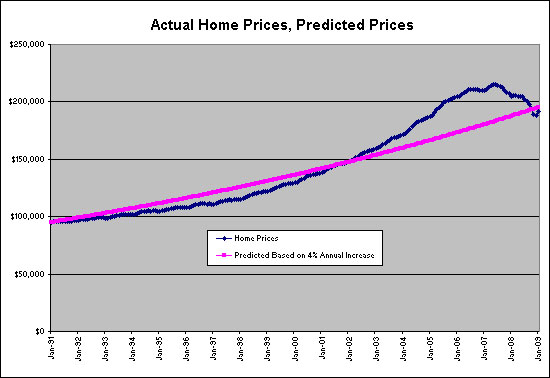
A few notes on the graph above, where the blue line shows actual home prices and the purple line shows a 4% per year increase in prices.
The graph below shows local median home price changes (since 2000) in green, with a the 4% per year increase shown with a purple line.
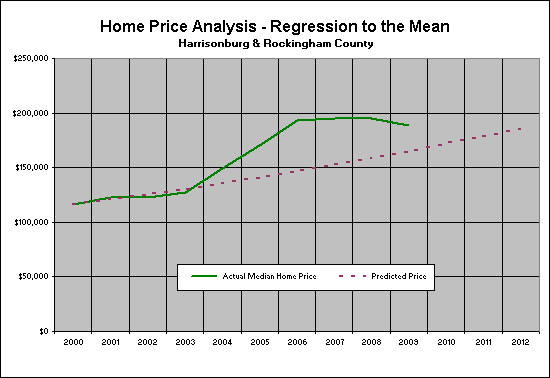
From the graph above we can see that since we haven't seen a sharp decline in prices in Harrisonburg and Rockingham County, that the actual median home price is still significantly above what it "should" be based on a 4% per year increase beginning in 2000.
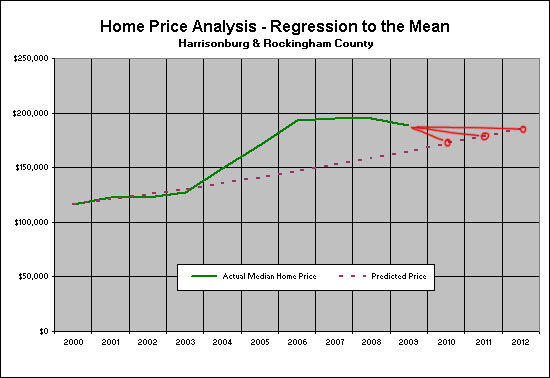
If we go along with the theory that home prices locally will regress to the mean, there are several ways that it might happen. The graph above shows what it might look like to return to the mean (of a 4% per year increase) --- if it happens by 2010 (sharp decline) vs. 2011 (moderate decline) vs. 2012 (no decline, or gain).
Again, please note that the idea that we must return to this mean is not carved in stone. It is a mathematical principal that some people believe has applies to the housing market. Below is one final graph to leave you feeling a bit more hopeful...
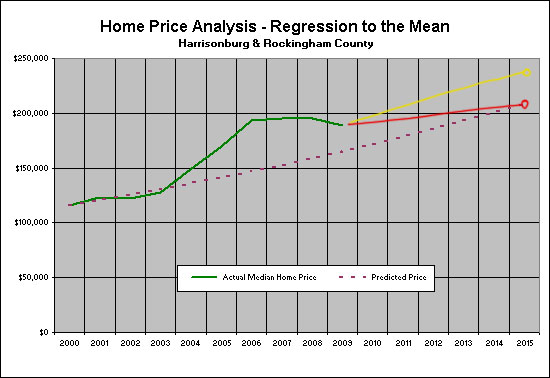
The red line above shows how we could see a steady (slow!) increase in home values every year from 2009 forward and still adhere to the principle of regressing to the mean.
The yellow line above flies in the face of regressing to the mean, and shows a return to the 4% per year increase starting from today's home prices independent from any (real or imaginary) need to regress to the historical mean.
Some of my references as I researched and wrote this post were:

In Harrisonburg and Rockingham County, however, we saw an increase in home values between 2003 and 2006, but we have not seen a comparable decrease between 2006 and 2009. (Source: HRAR MLS)

One of my blog readers (who has a Ph.D. in Assessment and Measurement) wonders whether we will see a decline in home values in Harrisonburg and Rockingham County because of a principle called "Regression to the Mean". This principle suggests that over time things (scores, prices, etc) revert back to the mean.
Let's use this concept to examine what might happen to home values in our area. Using OFHEO data, we see that home values across the entire United States have increased (on average) four percent per year since 1991.

A few notes on the graph above, where the blue line shows actual home prices and the purple line shows a 4% per year increase in prices.
- The increase between 1991 and 2001 is almost exactly 4% per year.
- The increase in between 2001 and 2007 were significantly higher than 4%.
- Declines since 2007 have brought the net 2001 to 2009 increase to 4% per year (the lines cross again in November 2008).
The graph below shows local median home price changes (since 2000) in green, with a the 4% per year increase shown with a purple line.

From the graph above we can see that since we haven't seen a sharp decline in prices in Harrisonburg and Rockingham County, that the actual median home price is still significantly above what it "should" be based on a 4% per year increase beginning in 2000.

If we go along with the theory that home prices locally will regress to the mean, there are several ways that it might happen. The graph above shows what it might look like to return to the mean (of a 4% per year increase) --- if it happens by 2010 (sharp decline) vs. 2011 (moderate decline) vs. 2012 (no decline, or gain).
Again, please note that the idea that we must return to this mean is not carved in stone. It is a mathematical principal that some people believe has applies to the housing market. Below is one final graph to leave you feeling a bit more hopeful...

The red line above shows how we could see a steady (slow!) increase in home values every year from 2009 forward and still adhere to the principle of regressing to the mean.
The yellow line above flies in the face of regressing to the mean, and shows a return to the 4% per year increase starting from today's home prices independent from any (real or imaginary) need to regress to the historical mean.
Some of my references as I researched and wrote this post were:
