Brought to you by Scott P. Rogers, Funkhouser Real Estate Group, 540-578-0102, scott@HarrisonburgHousingToday.com
Brought to you by Scott P. Rogers, Funkhouser Real Estate Group, 540-578-0102, scott@HarrisonburgHousingToday.com
Monday, October 18, 2010
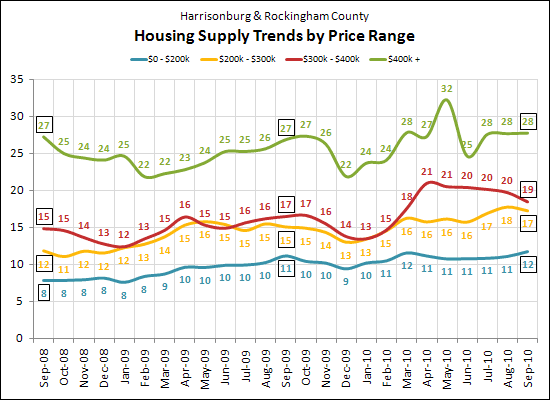
It really depends on how you measure housing supply. Here's the graph I include in my monthly market report....

This graph (above) shows the number of months of supply in four price ranges. This value is calculated by comparing the number of homes for sale in a particular price range with average number of home sales in that price range over the past 12 months. Thus, if over the past year there were 120 home sales in one of these price ranges, that would be 10 sales per month; if 130 homes are for sale, that would be 13 months of supply. This means it would take 13 months to sell all of the active listings if buyers kept buying at the same pace as had occurred over the past 12 months.
But let's examine the market overall using this same calculation....

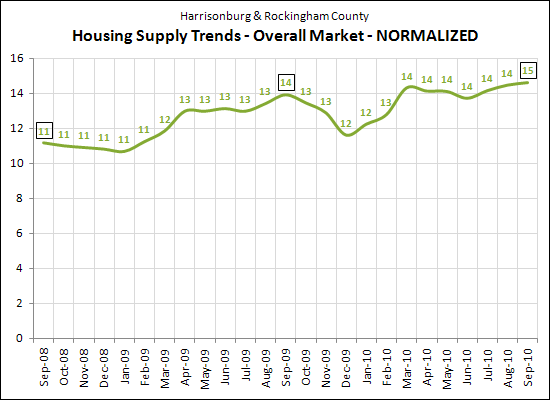
Removing the price ranges from the equation, you can see that the number of months it would take for all listings to sell has shifted upwards from 11 months to 15 months. It is interesting to see (in the graph above) how supply trended down approaching November 30, 2009 (anticipated deadline for home buyer tax break) and then again approaching June 30, 2010 (actual deadline for home buyer tax break). This would suggest that the tax credits helped our market, even if for a short while.
You'll note (especially compared the graph below) that the graph above shows a relatively smooth trend line -- without significant increases or decreases. This is a result of comparing each month's inventory of homes for sale to the average number of homes sold per month over a 12 month period. If we compared active listings each month to the number of homes sold in that one particular month, we'd get different results....

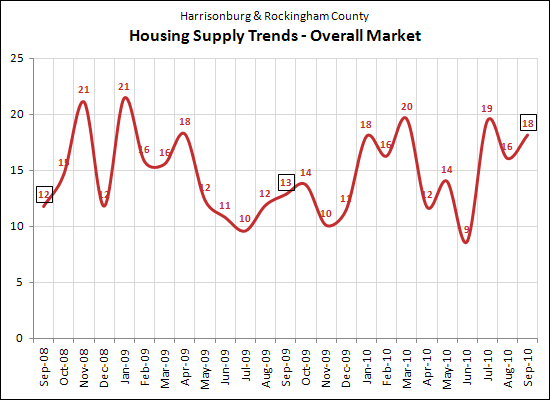
This graph (above) compares active inventory to one month of home sales. Thus, the number of months of supply can change dramatically from month to month and season to season. Spikes in home sales will result in low months-of-supply figures --- this phenomenon can be seen in November 2009 and June 2010.
So, help me determine which graph I'll use going forward. Leave a comment below, or e-mail me at scott@HarrisonburgHousingToday.com and let me know which graph(s) above are the most helpful for you.

This graph (above) shows the number of months of supply in four price ranges. This value is calculated by comparing the number of homes for sale in a particular price range with average number of home sales in that price range over the past 12 months. Thus, if over the past year there were 120 home sales in one of these price ranges, that would be 10 sales per month; if 130 homes are for sale, that would be 13 months of supply. This means it would take 13 months to sell all of the active listings if buyers kept buying at the same pace as had occurred over the past 12 months.
But let's examine the market overall using this same calculation....

Removing the price ranges from the equation, you can see that the number of months it would take for all listings to sell has shifted upwards from 11 months to 15 months. It is interesting to see (in the graph above) how supply trended down approaching November 30, 2009 (anticipated deadline for home buyer tax break) and then again approaching June 30, 2010 (actual deadline for home buyer tax break). This would suggest that the tax credits helped our market, even if for a short while.
You'll note (especially compared the graph below) that the graph above shows a relatively smooth trend line -- without significant increases or decreases. This is a result of comparing each month's inventory of homes for sale to the average number of homes sold per month over a 12 month period. If we compared active listings each month to the number of homes sold in that one particular month, we'd get different results....

This graph (above) compares active inventory to one month of home sales. Thus, the number of months of supply can change dramatically from month to month and season to season. Spikes in home sales will result in low months-of-supply figures --- this phenomenon can be seen in November 2009 and June 2010.
So, help me determine which graph I'll use going forward. Leave a comment below, or e-mail me at scott@HarrisonburgHousingToday.com and let me know which graph(s) above are the most helpful for you.
