Brought to you by Scott P. Rogers, Funkhouser Real Estate Group, 540-578-0102, scott@HarrisonburgHousingToday.com
Brought to you by Scott P. Rogers, Funkhouser Real Estate Group, 540-578-0102, scott@HarrisonburgHousingToday.com
Wednesday, September 9, 2015

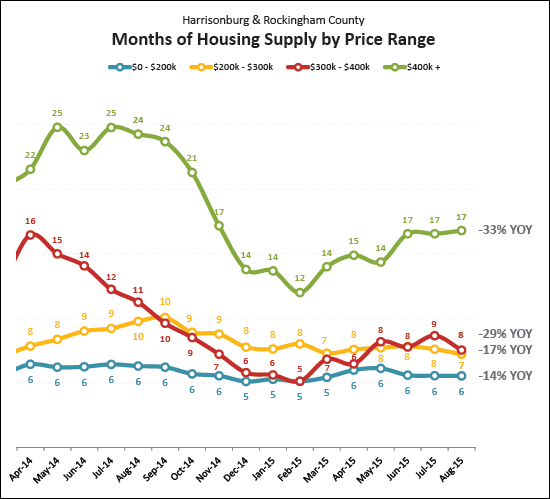
"Months of Housing Supply" is determined by dividing the number of buyers buying (on average over the past 12 months) into the number of sellers selling (number of current listings). This graph (above) does so for each of four different price ranges in our local market.
Here's what we find....
Under $200K
- The healthiest segment of the local market.
- Only six months of supply available, which is seen to be a sign of a balanced market (between buyers and sellers).
- 14% lower supply than a year ago.
- Pretty darn healthy, with 7 months of supply available.
- Getting healthier slightly faster than the under $200K market with a 17% year-over-year improvement in supply.
- Also very healthy, with 8 months of supply available.
- Interestingly, this past winter, this segment of the market went down to only 5 months of supply available -- maybe this segment of the market contains sellers most likely to remove their homes from the market for the winter?
- This segment of the market has seen a 29% decline in the months of supply available over the past year.
- The least healthy, technically, with 17 months of supply.
- It takes longer for these homes to sell (given low buyer demand for them) and thus these homes linger on the market longer, and thus we almost always see more supply of these homes than in any other price range.
