Brought to you by Scott P. Rogers, Funkhouser Real Estate Group, 540-578-0102, scott@HarrisonburgHousingToday.com
Brought to you by Scott P. Rogers, Funkhouser Real Estate Group, 540-578-0102, scott@HarrisonburgHousingToday.com
Monday, August 21, 2017


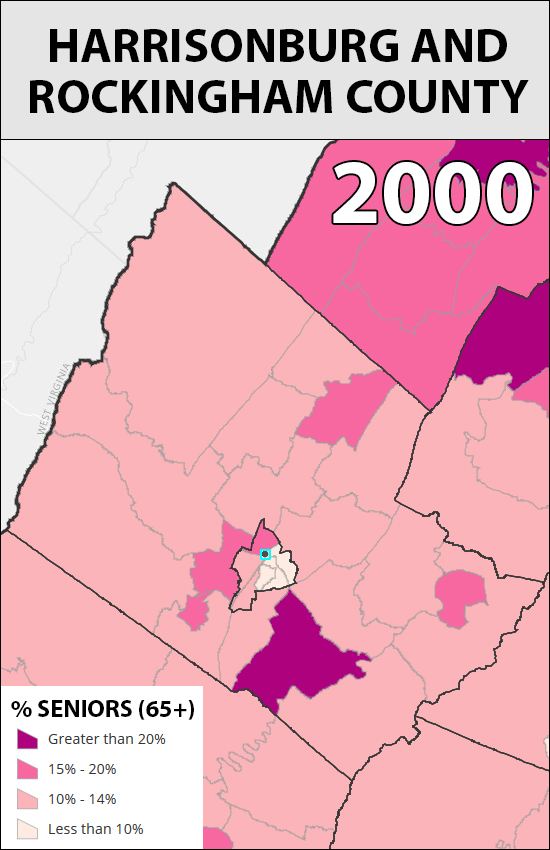
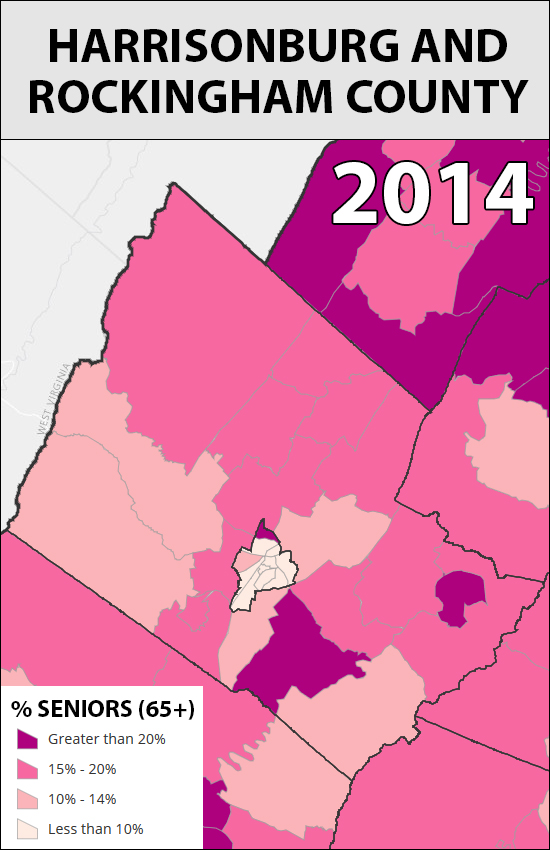
The two maps above were generated here based on changes between 2000 and 2014 in the senior population -- those age 65 or greater.
A few observations and thoughts....
- Many areas of Rockingham County have higher percentages of seniors now (2014) than they did in 2000.
- Some areas of the City of Harrisonburg have lower percentages of seniors now (2014) as they did in 2000.
- The increase of seniors in the County could certainly at least partially be attributed to the fact that all County residents would be 14 years older in 2014 than they were in 2000. :-)
- The proportional decline in seniors in the City might have more to do with an increase in the number of non-seniors, both in the form of kids, families, college students, etc.
- The areas in the County with the highest proportion (as compared to the total population) of seniors are both east of the City.
- As you look at these maps, remember that the darker colors do not necessarily mean that there are higher NUMBERS of seniors -- but rather a higher PERCENTAGE of seniors as compared to the overall population.
- Perhaps it is worth noting that two of the darker areas (north end of Harrisonburg and just southeast of Harrisonburg) are home to VMRC and Sunnyside. :-)
