New Detached Homes in the City of Harrisonburg |
|
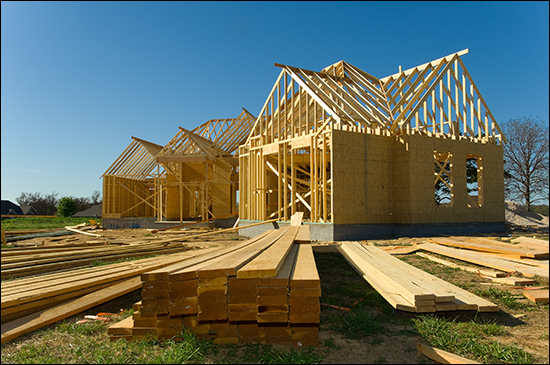 If a builder were to start building new homes in the City Harrisonburg -- what should that look like? Large lots? Small lots? Large homes? Small homes? Sound off: scott@HarrisonburgHousingToday.com There haven't been many new houses built in the past few years in the City of Harrisonburg! If we look at the past (12) months -- there have only been nine sales of homes built in the past five years....
| |
Chickens and Eggs when Selling and Buying |
|
 That age old question -- which came first, the chicken or the egg -- applies to our local real estate market more than ever this year. There will always be folks, perhaps such as yourself, who will want to buy a new home, but need to sell in order to buy. The ease of this transition depends largely on what type of market we're in....
And this, as outlined above, can make it quite difficult to buy and sell at the same time....
Generally speaking, my recommendation is always the second option above -- make an offer after your current house is under contract. And don't worry -- there are multiple ways to address the "I am only willing to sell if I can also buy" scenario with contract contingencies. But what does one do if there really (really!) isn't anything to buy after you have secured a buyer for your home?
These are not easy, or fun, decisions to make. I am working with multiple families right now stuck in the middle of this situation -- having an interested buyer for their home, but not knowing where they will go. Our best bet is to talk through the options for how to best handle this transition -- and determine how flexible you are willing to be, as it relates to what you buy, how soon you buy something, whether you move twice, etc. | |
With low inventory levels, it is crucial that you know about new listings FAST! |
|
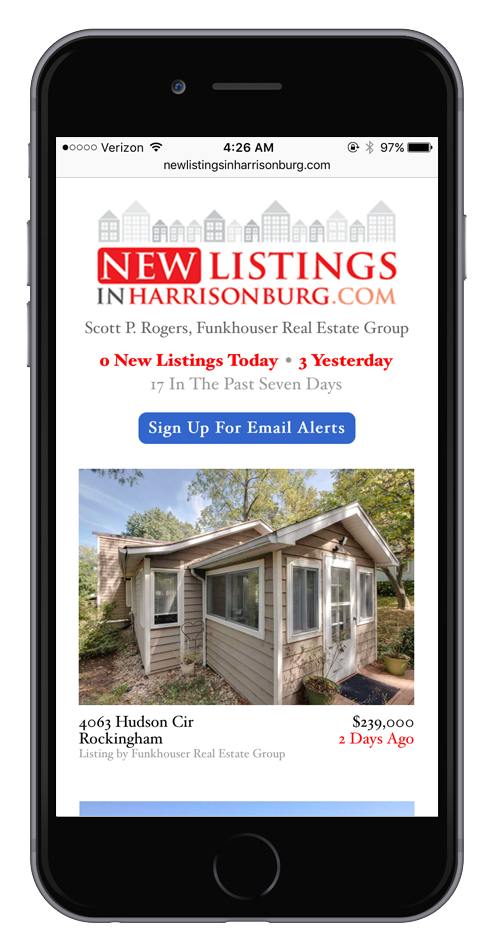 Most of my clients use NewListingsInHarrisonburg.com to keep track of new properties coming on the market in Harrisonburg and Rockingham County. You can quickly and easily scroll through the most recent residential listings in Harrisonburg and Rockingham County, view the pertinent details, all of the photographs of the home, an area map, and then quickly and easily share that new listing with a friend, your spouse, your Realtor, etc. You can also sign up to receive an email alert every time there is a new listing....  And, finally, you can add the website to the home screen if you'd like, for quick and easy access....  Check it out, at NewListingsInHarrisonburg.com. | |
Has the Market Slowed Down in September? |
|
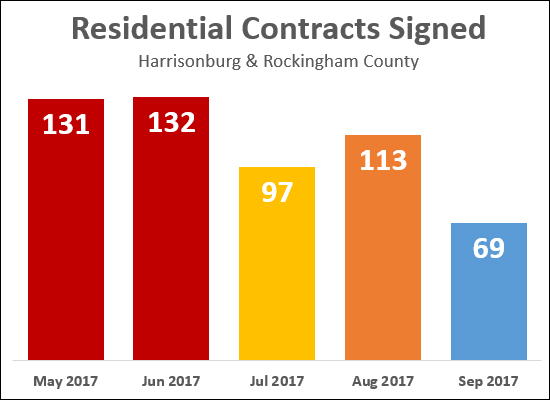 It seems it may have.... As shown above, only 69 properties have gone under contract thus far in September 2017 -- as compared to 113 last month. Of note....
Regardless, home buying activity (at the point of contract signing) seems to be slowing down as we head into the Fall. On a completely unrelated note, do we really call these 80 degree days "Fall"? | |
The Value of Your Home Based On When You Bought It |
|
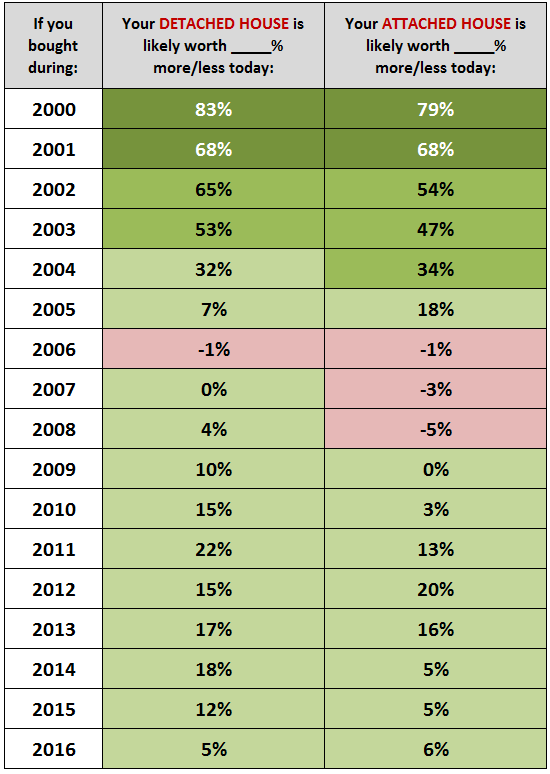 Can historical median sales prices give you some sense of your home's current market value? Perhaps so! The chart above is calculated based on comparing the 2017 median sales price to the median sales price in each of the past 16 years. Do remember, of course, that while this might provide a general guide to what has happened with home values over the 17 years, every home and neighborhood is unique. Let's chat about your specific house if you want to know what it is worth in today's market. Also, if you bought your home in one of the (now few) red years (2006, 2007, 2008), while your home might still be worth less today than when you bought it, you may have paid down your mortgage to the point that you could sell your without bringing money to closing. | |
If you think housing inventory levels are low now.... |
|
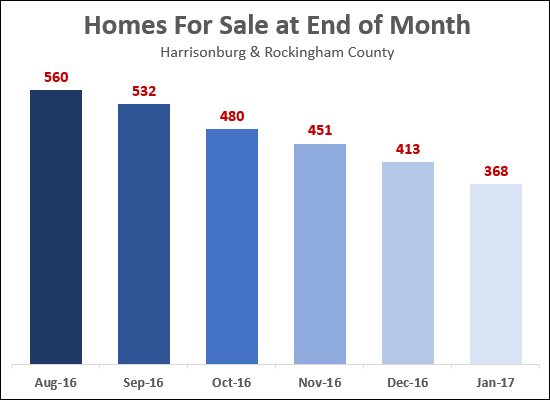 If last year is any indication, get ready to see inventory levels falling over the next few months almost as fast as the leaves are falling off the trees. In all seriousness, though, many buyers these days are having a difficult time finding a home they are excited to purchase -- which is not surprising, as inventory levels have declined 27% over the past year. But it is likely to get (temporarily) worse for buyers. As shown above, inventory levels fell 34% last year between the end of August and the end of January. As such -- look at the meager supply of homes currently on the market -- and then eliminate 1 out of every 3 of those homes. That's likely where we're headed over the next few months. But here's the good news (sorta, kinda, with limitations) -- if you are thinking of selling your home in the next few months, you may have quite a few buyers angling to purchase it if it aligns well with what they are looking for in a home. The sorta/kinda part is that you'll only be good shape if you don't have to buy as well. After all, if we quickly sell your home (because of low inventory levels), but can't find something for you to buy (because of low inventory levels), then we still have problems. Who is the indisputable winner in today's local housing market? The home seller who does not have to buy a home as well. :-) | |
How much of the City of Harrisonburg single family housing stock sells in any given year? |
|
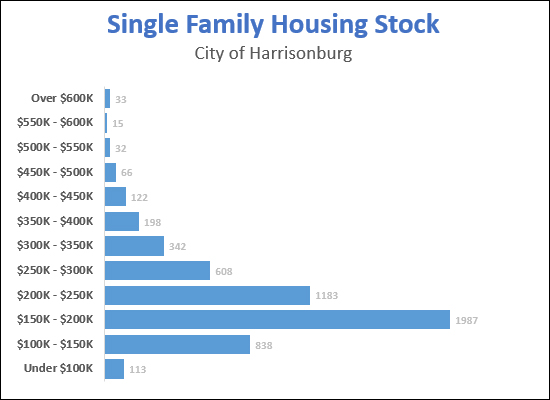 OK -- I'll point out, from the start, that I'm making things a bit more complicated here. I'll partially blame Derik, as he asked the question. OK - the graph above, is the same one I posted yesterday -- a look at how many single family homes exist in the City of Harrisonburg in a variety of price ranges, based on their assessed values. But -- if that's how many actually exist -- it is probably reasonable to wonder how many homes actually sell in each of those price ranges in each year. So, here are the City single family home sales in the same price ranges for all of 2016.... 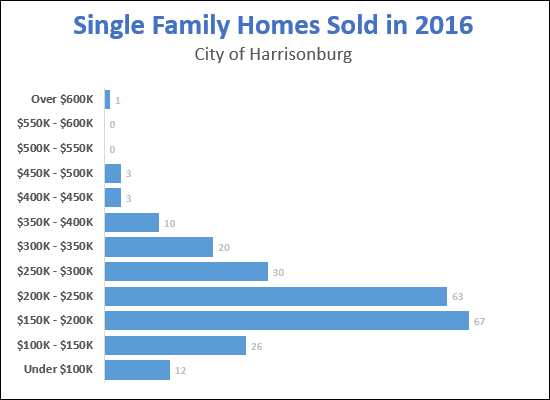 You'll notice that the two graphs above don't look altogether that different. Then, to combine these two, rather than just put really little numbers (how many sell) next to really big numbers (how many physically exist) I thought I"d look at what percentage of each price segment of the City housing stock sells in a given year.... 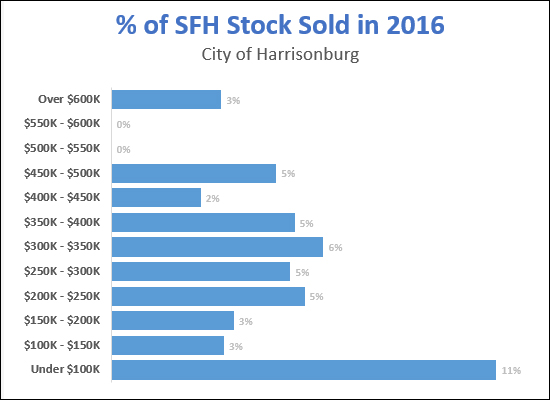 I think this makes it more helpful, though slightly less specifically meaningful absent scrolling back up and also remembering how many houses we're talking about in each given price range. For example, the chart directly above shows that:
OK -- next, a few flaws and disclaimers:
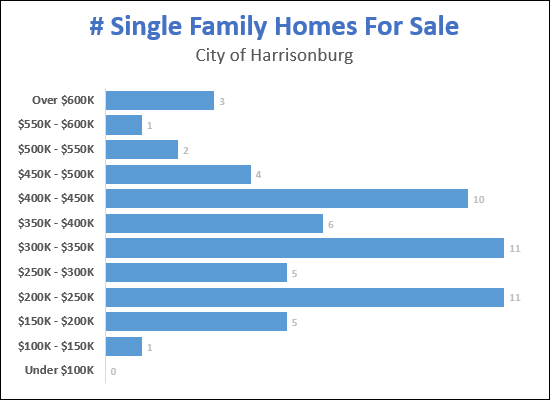
OK -- it continues -- I think it is probably necessary to try to contextualize this with "active listing" data -- to see how some of these numbers compare to what is available today for a buyer to purchase. Here is a breakdown of single family homes currently for sale....
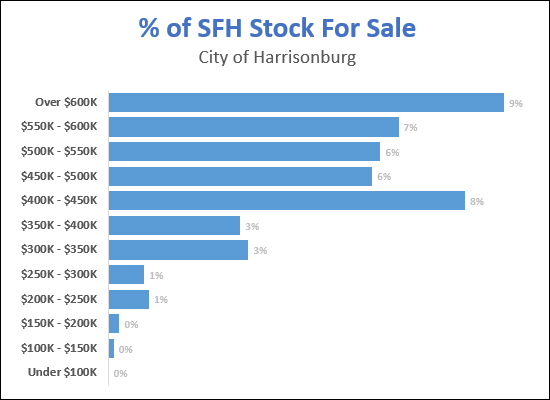
As you can see, above, there are NOT a lot of homes for sale in the City of Harrisonburg right now. And let's see if we can flesh anything out if we break it down by how many homes are available to be purchased as compared to the overall number of homes that actually exist....
This graph might have been the one I was looking for -- at least to support my understanding of the world.... Right now -- almost 9% of the homes over $600K are listed for sale -- and 6% to 8% of homes over $400K are listed for sale in the City of Harrisonburg. On the other hand, only 3% of homes between $300K and $400K are listed for sale, only 1% of homes between $200K and $300K and less than 1% of homes under $200K are listed for sale. This would seem to be about as clear of an indicator as one could find that homes under $300K (or even better, under $200K) are in short supply and in high demand in the City of Harrisonburg. Finally, lastly, ultimately, some "overall market" stats....
Questions? Thoughts? Observations? Insights? Suggestions? Email me: scott@HarrisonburgHousingToday.com | |
Price Distribution of Single Family Housing Stock in the City of Harrisonburg |
|
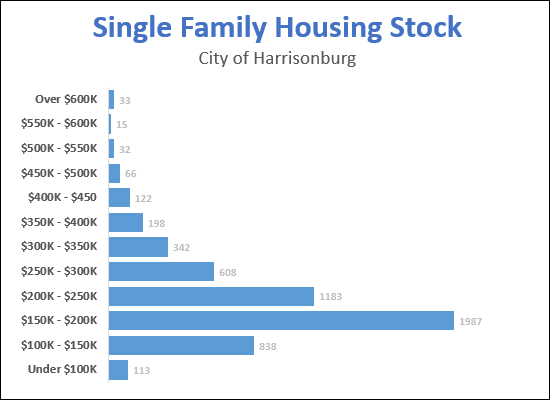 OK -- Take 2 -- Based on some feedback, in smaller price increments this time.... Forget about what actually SELLS in any given timeframe, or even what is available FOR SALE at any given point in time. Let's get down to what housing actually EXISTS in the City of Harrisonburg. The graph above shows the number of single family detached homes (Use Code 006 in the City's property database) that exist in the City of Harrisonburg in (120 different price ranges. The homes are sorted into these price categories based on their 2017 assessed values. So -- what surprises you? If more single family homes are to be built in the City, what price range should they fit into? | |
Single Family Housing Stock in the City of Harrisonburg |
|
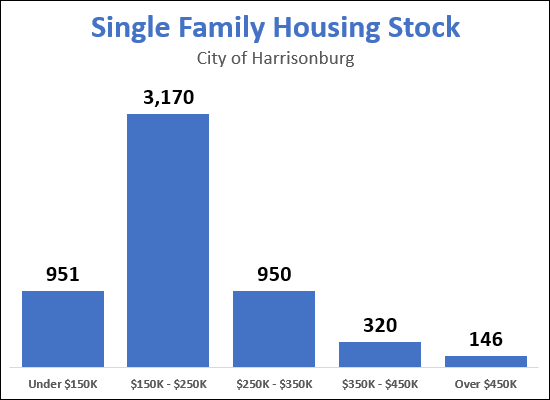 Forget about what actually SELLS in any given timeframe, or even what is available FOR SALE at any given point in time. Let's get down to what housing actually EXISTS in the City of Harrisonburg. The graph above shows the number of single family detached homes (Use Code 006 in the City's property database) that exist in the City of Harrisonburg in five different price ranges. The homes are sorted into these price categories based on their 2017 assessed values. So -- what surprises you? If more single family homes are to be built in the City, what price range should they fit into? | |
Are $150K - $250K Detached Homes Available in the City of Harrisonburg? |
|
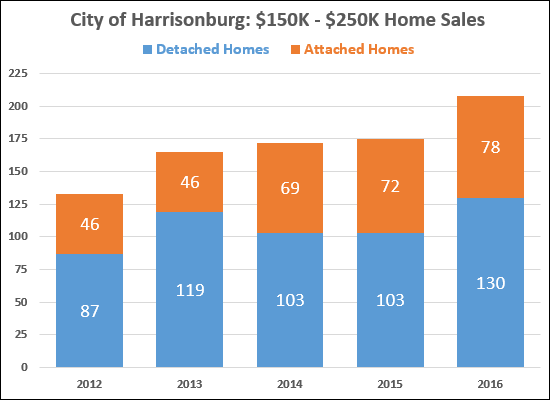 HINT -- this is a bit of a trick question. Again.... Are $150K - $250K Detached Homes Available in the City of Harrisonburg? Ignore the graph above for a moment -- and let's see what we find.... There are only 15 detached homes currently on the market in the City of Harrisonburg priced between $150K and $250K. Wow! At first blush, this is (or seems to be) very significant. One might conclude that we are seeing a significant under supply of these "mid-priced" homes in the City of Harrisonburg, and assume that this under supply is causing very few of these homes to actually sell. But wait -- looking further (now you may refer to the graph above, thank you for your patience) it seems that plenty of these homes are actually selling. In fact, 130 detached homes between $150K and $250K sold in the City of Harrisonburg last year. The tricky part is this -- if 130 buyers are buying per year, that's an average of 10.83 buyers per month. And thus, if there are only 15 such homes on the market, that is a 1.4 month (42 day) supply of homes for sale. Which is -- rather absurdly low. Most folks consider a six month supply to provide a balanced market between buyers and sellers. So -- yes, homes are SELLING between $150K and $250K -- but they aren't widely AVAILABLE at any given point. When they come on the market, they sell quickly! A few other observations....
| |
5.5% Increase in Year Over Year Median Sales Price |
|
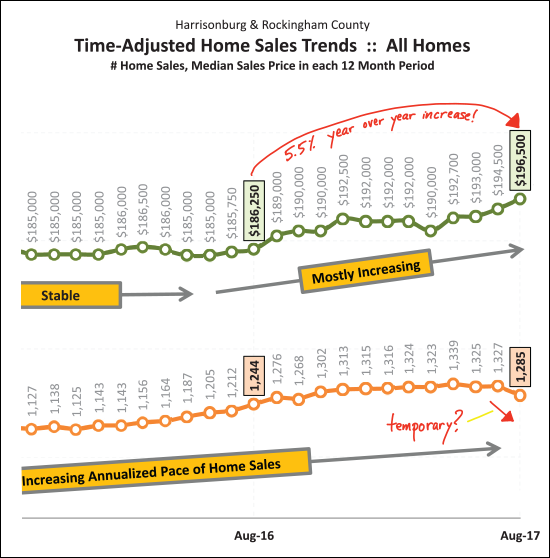 OK -- a slightly complicated headline -- let's break that down.... Looking at home sales over the past 12 months (Sep 2016 - Aug 2017) in Harrisonburg and Rockingham County -- the median sales price was $196,500. Looking at home sales in the 12 months before that (Sep 2015 - Aug 2016) in Harrisonburg and Rockingham County -- the median sales price was $186,250. As such, we have seen a 5.5% year-over-year increase in the median sales price in our local area. That is accompanied by a 3.3% year-over-year increase in the pace of home sales -- from 1244 sales/year to 1285 sales/year. Read a lot more about our local housing market in my post from earlier this week: Housing Market Slows (but prices rise) in August 2017. 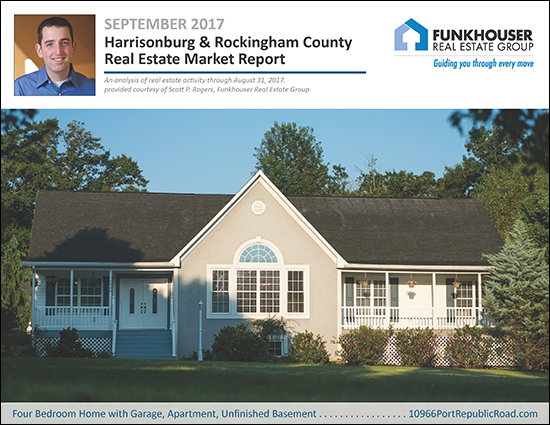 | |
Housing Market Slows (but prices rise) in August 2017 |
|
 Find out more about the home shown above, with detached garage and apartment, here. As Geoffrey Chaucer put it - "all good things must come to an end" -- and August 2017 is when the "more and more home sales, every month, for ever and ever" came to an end in the Harrisonburg and Rockingham County housing market. OF NOTE -- this could be a temporary end, and it might be more about a lack of seller supply than a lack of buyer demand -- but I'm getting ahead of myself. I just published my most recent monthly market report, and as usual, you can read on for an overview, download the full report as a PDF, read the entire report with commentary online, or tune in to my monthly video overview of our local housing market...  OK, now, if you're still reading after that super easy opportunity to just listen to me explain the entire market to you, here is some further context and explanation for you.... 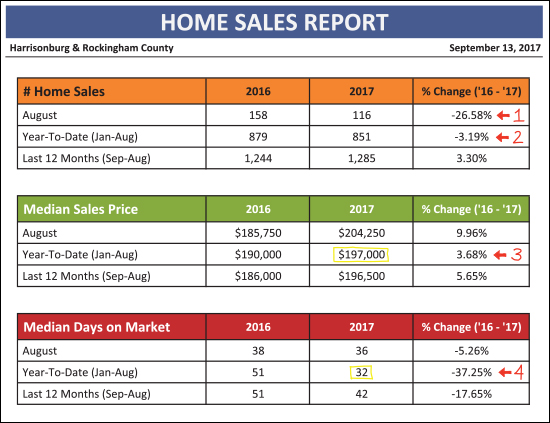 As shown above (#1), there was a significant (26.58%) decline in August home sales this year as compared to last year. This lead to (#2) an overall decline in year-to-date sales of 3.19% when comparing 2016 to 2017. Despite this slowdown in the pace of sales, the median sales price (#3) is still increasing year-over-year at a pace of 3.68% to the current level of $197,000. Furthermore, the pace at which homes are selling (#4) continues to accelerate -- with a 37.25% decline in median days on market over the past year. So --- slightly fewer homes are selling... faster... at higher prices. 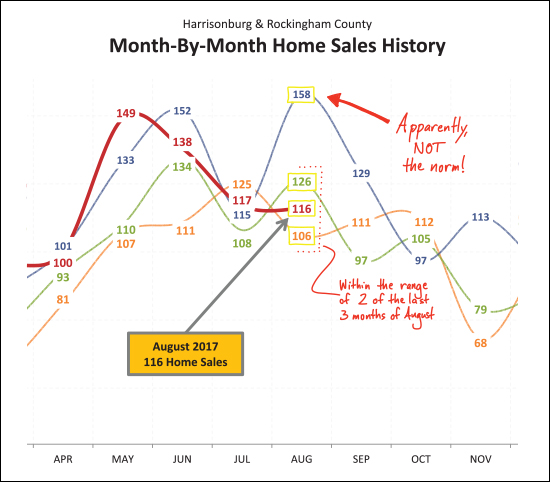 So -- here is the pretty (not pretty) picture of the difference between last year's SOARING month of 158 home sales in August 2016 -- and in comparison, the LOWLY month of 116 home sales in August 2017. Apparently, 158 home sales in the month of August is NOT the norm -- perhaps it was the result of a slow July 2016? AND -- if it is any consolation, the 116 home sales seen in August 2017 is within the range of two of the last three months of August. Hmmm....still hard to get excited about only 116 home sales in August! 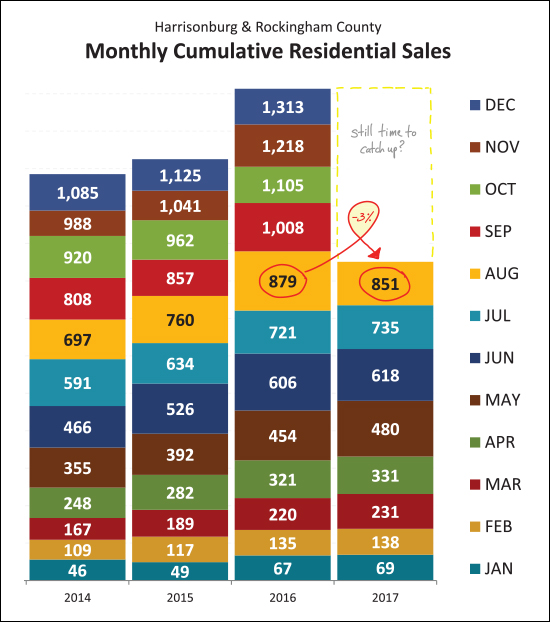 Here's another visual example of how things have changed -- every month thus far this year we have been "ahead" of 2016 home sales -- until August. We've now fallen behind (by 3%) and we only have four months to catch back up to match the overall pace of home sales in 2016. I suppose it is worth noting that there was a massive 16.7% increase in home sales between 2015 and 2016 -- so if we fall slightly short this year, it will still mark significant net growth in the pace of home sales as compared to 2014 and 2015. 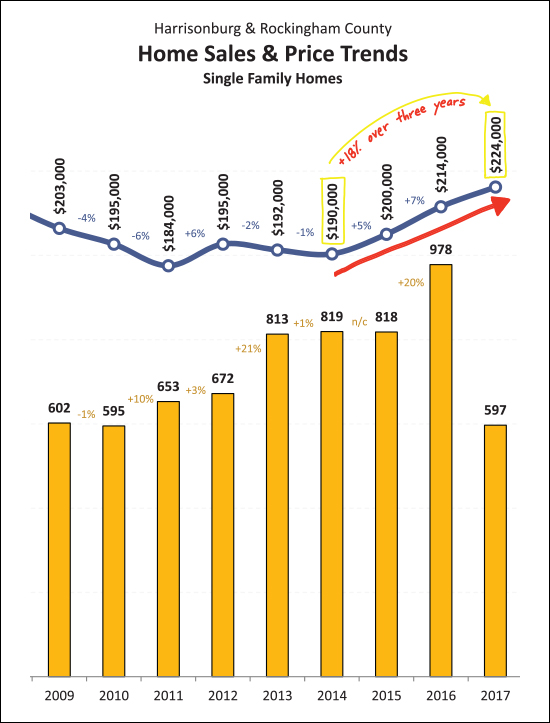 OK -- maybe I was looking for a bright spot amidst a so-so month of real estate news -- but here you go! As shown above, the median sales price of single family homes has risen 18% over the past three years! Of note -- we're close (but not quite there) to getting back up to the all-time high for our area's annual median sales price for single family homes -- which was $226,800 back in 2006. 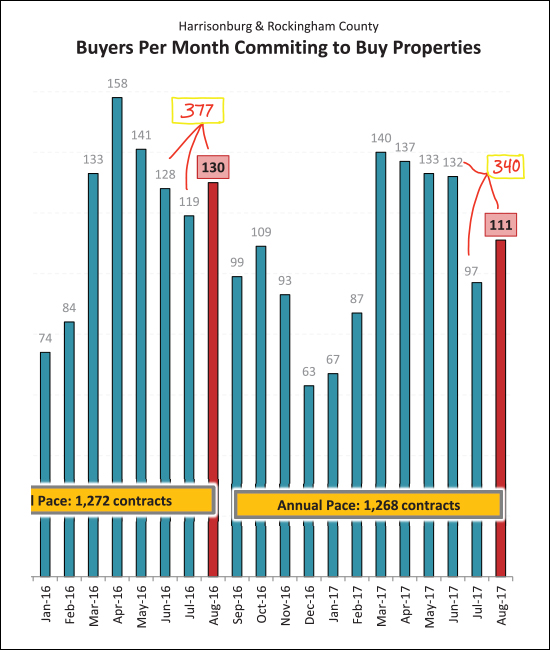 OK -- back to the not-quite-as-peppy news -- contracts were down in August as compared to last August. In fact, looking at summer (June, July, August) contracts -- there were only 340 of them signed this year, as compared to 377 last year. Possible explanations for this decline in contract activity include:
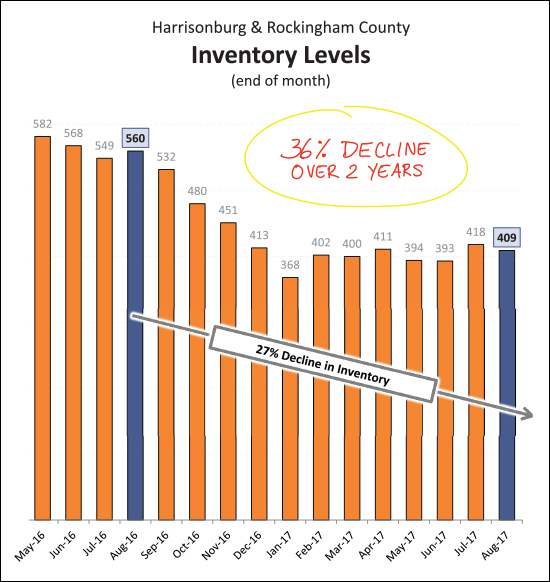 Indeed, as shown above, buyers today have 27% fewer options of homes to purchase in Harrisonburg and Rockingham County as compared to one year ago -- and 36% fewer homes to choose from as compared to inventory levels two years ago. This decline in inventory is likely playing a role in the slight (3%) year-over-year decline we are seeing in home sales in this area. OK -- I'll stop there for now. I will continue to explore the latest trend in our local housing market in the coming days on my blog. Until then -- feel free to download and read my full market report as a PDF, or read the entire report online. And, my reminders for buyers and sellers last month still apply.... SELLERS -- even though it is a seller's market in many price ranges right now, you must still focus on price, condition and marketing. For further reading on buying or selling in this area, check out.... | |
New Developments Coming Soon? |
|
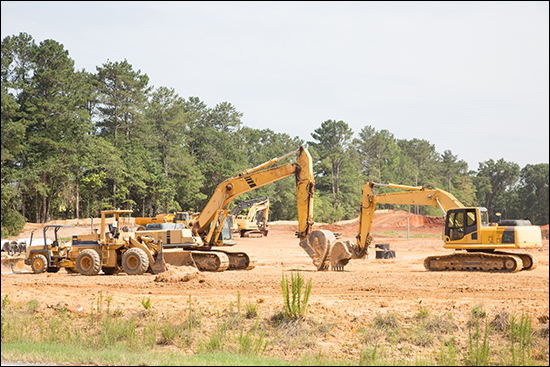 Three parcels of development land (see below) are now under contract. Perhaps we'll be seeing some new developments taking shape in and around Harrisonburg soon? 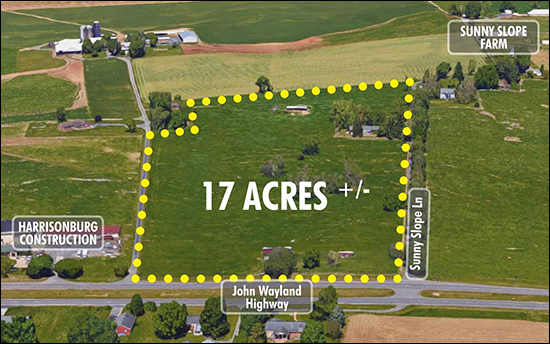 2112 SUNNY SLOPE LN, ROCKINGHAM, VA - 16.91 ACRES - $1,039,000 This nearly 18 acre tract of land is just outside the City of Harrisonburg and offers an opportunity to develop for residential and/or commercial use, subject to rezoning. The property is located on Route 42 with about 450 feet of road frontage near WalMart and beside Harrisonburg Construction. There are three parcels, two currently zoned A2 and one zoned R2. Water & Sewer is available. The property includes a 3,000 sf ranch style residence with a basement and was built in 1960. UNDER CONTRACT SINCE 3/2/2017. 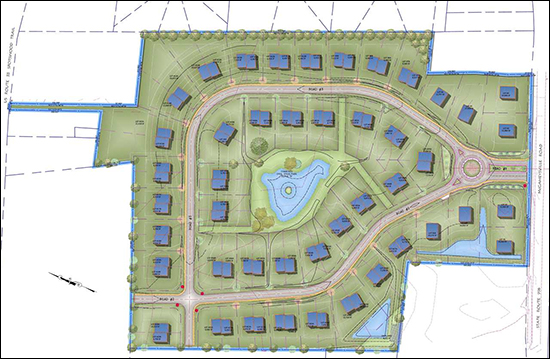 9447 MCGAHEYSVILLE RD, MCGAHEYSVILLE, VA - 21.76 ACRES - $1,250,000 Temporary Price Cut for an Early April Closing! Extraordinary Opportunity! A fully approved Residential Subdivision in McGaheysville and ready to be developed. The site is approved for 84 units (6 single family & 39 duplex lots). It can be constructed in Phases. Full views of Massanutten and the Blue Ridge Mountains. The subdivision includes a roundabout, internal loop road for walking, and riding, a shared access pond/park area. County water & sewer. UNDER CONTRACT SINCE 7/5/2017. 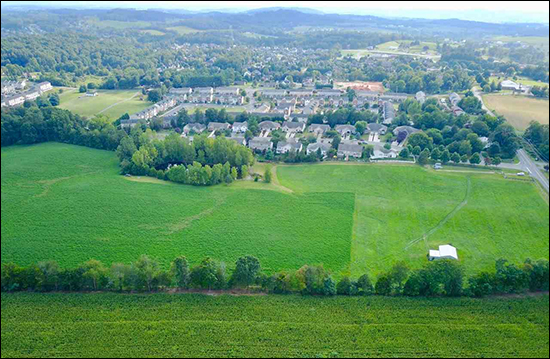 TBD BOYERS ROAD, ROCKINGHAM, VA - 26.27 ACRES - $2,365,000 Prime Development Land. 26 + Acres Zoned R3 on the east side of Harrisonburg on Boyers Road across from Sentara RMH Hospital. Property borders the Massanetta Springs Camp & Conference center property on the east and also has a pond that has water in it most of the year. Could be a great duplex or townhouse development. There is a small barn on the property. UNDER CONTRACT SINCE 9/11/2017. | |
JMU purchases another property in Forest Hills |
|
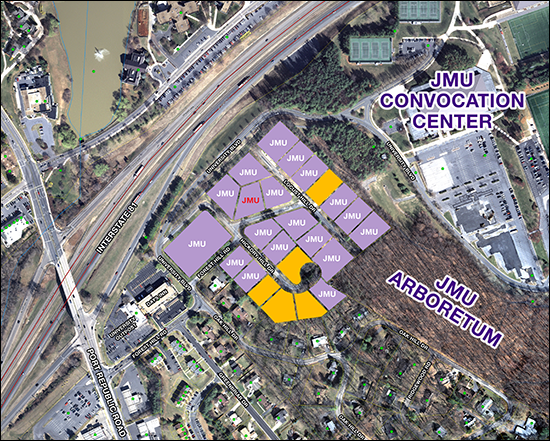 JMU has purchased another property in the Forest Hills neighborhood -- as shown above, in purple, with red "JMU" letters. Click here for a larger, updated, version of this map. As per HarrisonburgPropertyTransfers.com.... August 3, 2017 - Richard L. Sheppard to The Visitors of James Madison University, lot at the intersection of Forest Hill Road and Hickory Hill Drive, $308,000.As per my previous article, per The Breeze....
| |
Out of Date Foreclosure Data on Zillow |
|
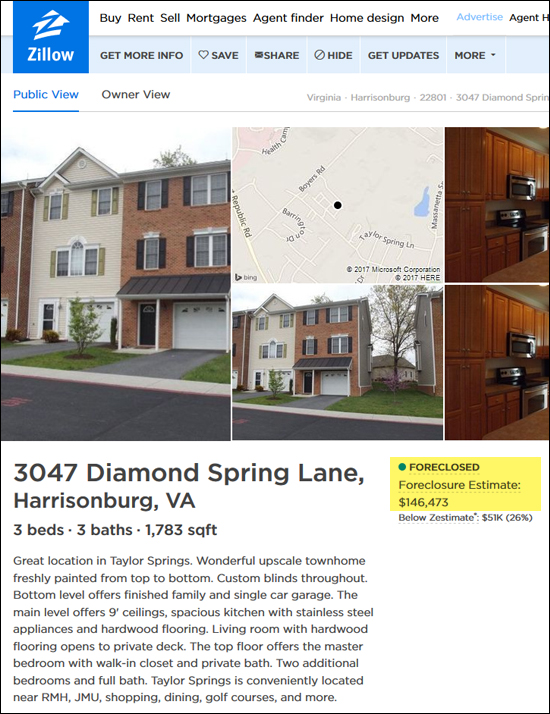 The property above looks like a great opportunity, doesn't it? A townhouse at Taylor Spring (median price = $189,250) that is a foreclosure and can be purchased for $146,473? I have had numerous calls about this property over the past few weeks -- and there is only one problem.... The property was foreclosed on back in 2013 (four years ago), then purchased by the current property owner for $172,000, and is NOT for sale -- for $146K or any other price. So -- don't be fooled -- if a property is listed as a foreclosure on Zillow, it very likely was a foreclosed property at some point in the past, perhaps years ago, but chances are it is NOT for sale, and NOT purchasable for the price listed on the property page on Zillow. If you have a question about information on Zillow that does not seem to be accurate, feel free to touch base with me to see if we can confirm or deny that information. | |
Scott Rogers
Funkhouser Real
Estate Group
540-578-0102
scott@funkhousergroup.com
Licensed in the
Commonwealth of Virginia
Home Search
Housing Market Report
Harrisonburg Townhouses
Walk Through This Home
Investment Properties
Harrisonburg Foreclosures
Property Transfers
New Listings

