Sold Price Per Square Foot On The Rise In 2020 |
|
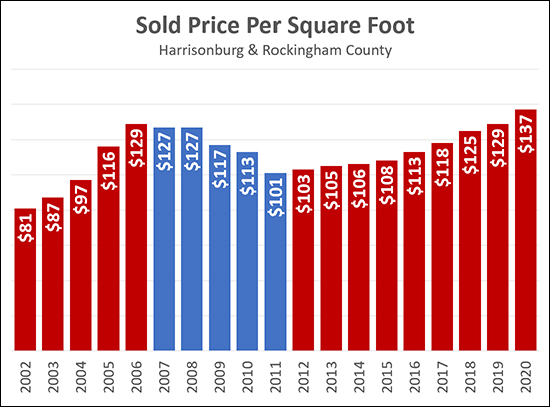
 In addition to watching how the median sales price changes over time, it can be quite insightful to see how the median price per square foot of sold homes changes over time. The graph above tracks the median price per square foot of single family homes (not townhouses, duplexes or condos) in Harrisonburg and Rockingham County over the past 19 years. Price per square foot fell 22% between 2006 and 2011 as the market cooled back off. Since that time, however, we have seen a slow and steady increase in this metric -- from $101/SF in 2011 to $129/SF last year -- which marks a 28% increase over the past eight years. I wouldn't necessarily expect that we would see drastic increases in this metric in the next few years, but an increasing number of buyers (more demand) and significantly fewer sellers (less supply) does make you wonder if we will start to see more rapid increases in sales prices, and thus in price per square foot. Thus far in 2020, we are seeing a 6% increase in the sold price per square foot in Harrisonburg and Rockingham County! ALSO OF NOTE -- this metric is most helpful in understanding value trends over time -- not in calculating the value of one particular property. This median price per square foot is the mid point of many very different homes -- new homes, old homes, homes with garages, homes without garages, homes with basements, homes without basements, homes with acreage, homes on small lots, etc. A median price per square foot can be more helpful in understanding the potential value (or value range) of a single property if we pull that median value based on a smaller data set of more properties more similar to the single property. | |
Scott Rogers
Funkhouser Real
Estate Group
540-578-0102
scott@funkhousergroup.com
Licensed in the
Commonwealth of Virginia
Home Search
Housing Market Report
Harrisonburg Townhouses
Walk Through This Home
Investment Properties
Harrisonburg Foreclosures
Property Transfers
New Listings

