Brought to you by Scott P. Rogers, Funkhouser Real Estate Group, 540-578-0102, scott@HarrisonburgHousingToday.com
Brought to you by Scott P. Rogers, Funkhouser Real Estate Group, 540-578-0102, scott@HarrisonburgHousingToday.com
Wednesday, August 18, 2021
Happy Wet Wednesday morning to you!
It looks like this will be the fourth (?) day in a row of rain in the valley, which is a welcome trend for many given the previous few weeks of very, very dry weather in the Harrisonburg area.
I hope at least some portions (or most!?) of your summer have been enjoyable and relaxing amidst all that is going on in the world right now. I escaped dry Harrisonburg to visit even drier Utah with my family in early August -- and was impressed by both the lack of humidity :-) and the beautiful landscapes of Arches National Park.
I'm back now, though, and Luke (11th grade) and Emily (8th grade) are transitioning into a new school year. If you have little (or big) ones starting school now or soon, I hope that transition goes well for you and them.
Now, then, let's chat for a bit about our local housing market. Or, rather, I'll chat -- while you read -- and if you want to chat back, shoot me an email me with what's on your mind or let me know if you'd like to grab a coffee and we can chat in person.
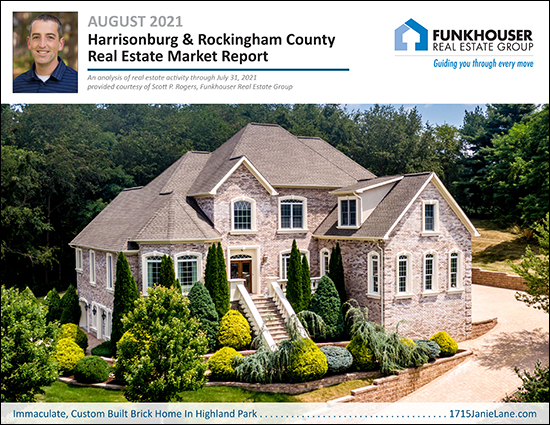
But one last note -- you'll find a PDF of all of the charts and graphs in my market report here and you can learn more about the amazing Highland Park home pictured above here.
Now, to the data...
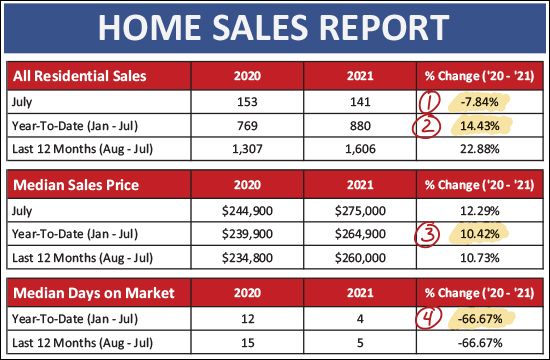
This first data table (above) gives you a quick overview of the basic market dynamics we're seeing right now in the Harrisonburg and Rockingham County area -- and most of it is probably what you would have guessed that you would see...
[1] This first one might be a bit of a surprise. There were 8% fewer home sales this July compared to last July. But... you need to keep last July (and last June) in context remembering that they were extraordinary busy months for home sales after the usually strong spring real estate market was delayed by a few months by Covid, resulting in slower spring 2020 home sales and much stronger summer 2020 home sales. Thus, while there were fewer home sales this July compared to last -- that's mostly a story about how crazy things were last July.
[2] Here you'll note that the year-to-date pace of home sales (880 sales) is 14% higher than it was last year (768 sales) when evaluating only the first seven months of the year. So, yes, despite extraordinary low inventory levels -- at any given time -- 14% more homes are selling this year than last!
[3] Those home prices keep on rising. You might have noted the headline of this update was related to the increase in sales prices. After receiving one of my market reports that lauded a strong pace of home sales, one of my past clients once commented that he could care less how many homes sold -- he just wanted to know what prices were doing -- going up or down. So, in that spirit, I lead this month's update with the fact that the median sales price has increased 10% between last year ($239,900) and this year ($264,900) when looking only at the first seven months of the year.
[4] Finally, sales are still happening very (very) quickly in our local market. The median "days on market" for homes that sold in the first seven months of this year was... four days. That is to say that half of the homes that sold went under contract in four days or less! Wow!
Now, then, a slightly (just slightly) deeper dive into the basic sales data...
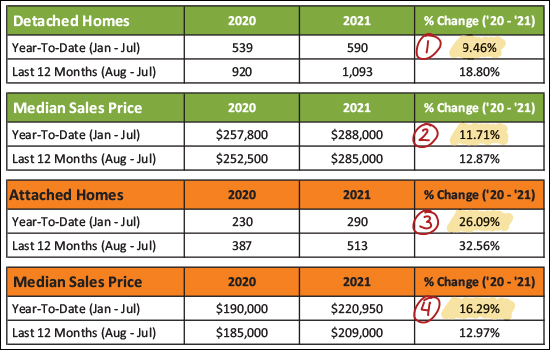
The data table above provides a slightly more nuanced analysis of detached homes in green as compared to attached homes in orange. An attached home is a duplex, townhouse or condo.
Splitting out the data in this way calls attention to the fact that while we've seen 9% more detached home sales thus far in 2021, we have seen a much larger, 26%, increase in the number of attached homes that have sold in 2021. Lots of duplexes, townhouses and condos are selling -- though mostly townhouses, and many of them are new townhouses.
Looking at sales prices between these two data sets we find that the median sales price of detached homes has increased 12% to $288,000 -- while the median sales price of attached homes has increased 16% to $220,950.
So -- at least some portion of the overall increase in home sales in this area is a big increase in the number of attached homes that are selling.
Now, to the monthly sales trends...
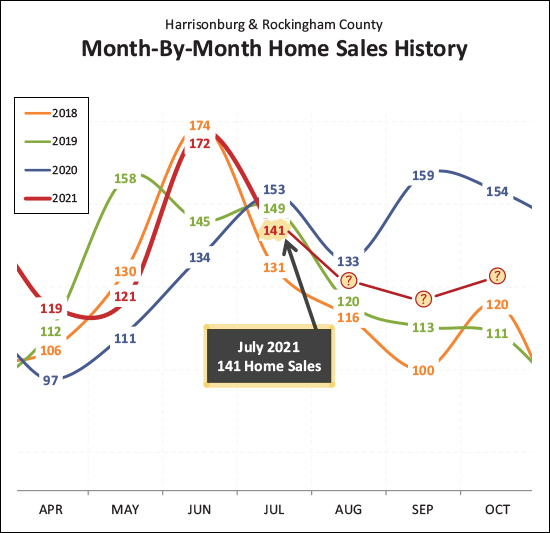
There is a lot going on in this graph, above, but focus on the bright red line for the current year and the dark blue line for last year. By doing so, you'll note that April, May and June home sales were extremely strong in 2021 compared to 2020 -- though that was mostly because home sales were sloooooowwww during those months last year as a result of Covid pushing last year's home sales later in the year.
When we then look at June and July home sales in 2021 they look slow compared to 2020 -- but again, this is largely a result of Covid pushing last year's home sales later in the year.
So, what then should we expect for August and thereafter in 2021? As illustrated above, I think we are likely to see more home sales than in the same month of 2018 and 2019, but likely fewer home sales than seen in the same month in 2020. The second half of last year was absolutely bonkers as far as the number of homes that sold per month and as strong of a year as 2021 has been, I just don't think it can keep pace with last year.
But... in the end, I do think we'll see more home sales this year than last...
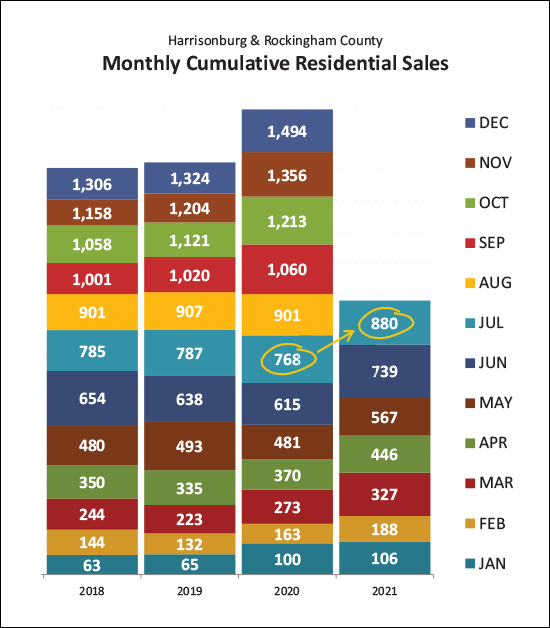
This graph (above) piles each month of home sales on top of the previous months that year, and you'll see that 2021 has established a serious lead over 2020. We are now 112 home sales ahead of the pace of last year's local housing market. So -- even if home sales are a bit slower in the last five months of 2021 than they were in 2020, I still think we'll see more home sales in all of 2021 than we did in all of 2020.
Looking back, then, at home sales prices -- some folks have asked if home prices are going up too much or too quickly...
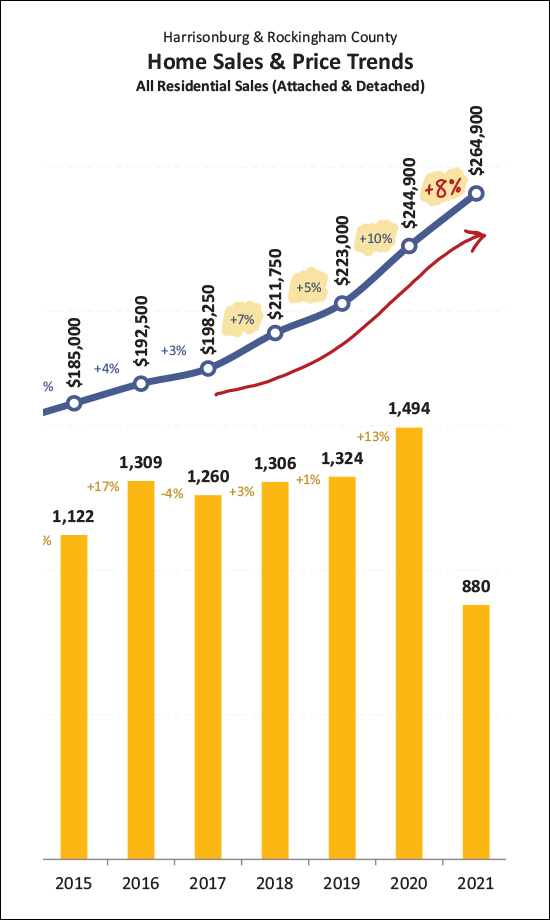
As shown above, there was a 10% increase in the median sales price in 2020, and depending on how you crunch the numbers an 8% of 10% increase in 2021. So, will home prices keep going up? Will they come down?
As I mentioned on my blog earlier this week, I don't think home prices are going to decline in the next year, because...
[1] I believe housing (for purchase) has been under built for many years in this area. I believe there are more homeowners or would-be homeowners in the market than there are homes to be owned.
[2] Even if lots and lots of homes are being built or being planned, it takes a long time (relatively speaking) for those homes to be planned and built.
[3] There are a flurry of showings and often multiple offers on most new listings.
[2] Even if lots and lots of homes are being built or being planned, it takes a long time (relatively speaking) for those homes to be planned and built.
[3] There are a flurry of showings and often multiple offers on most new listings.
So, home prices are rising (10-ish percent in the past year) and I don't see that changing significantly in the near future.
Now, technically closed home sales are old news -- it's the contract activity that gives us the freshest data, so let's take a look...
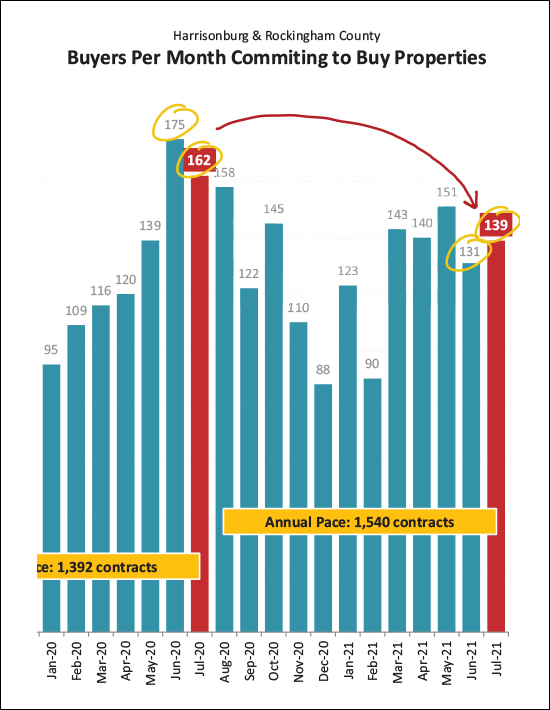
As shown above, contract activity in June and July has been dreadfully slow compared to last June and July. ;-) While technically true, this doesn't tell the whole story, in my opinion.
During early 2020, Covid caused a major slow down in the number of homes coming on the market and thus the number of buyers contracting to purchase homes. The spring months are usually some of the busiest months for contract activity and that didn't happen in 2020. As a result, contract activity spiked to record or near record highs in June, July and August.
Last year's incredibly and unusually strong months of contract activity during those summer months does make this summer's contract activity look a bit pitiful, but again, it's only because of the crazy highs last summer.
Now, how about those inventory levels? Are we getting any relief?
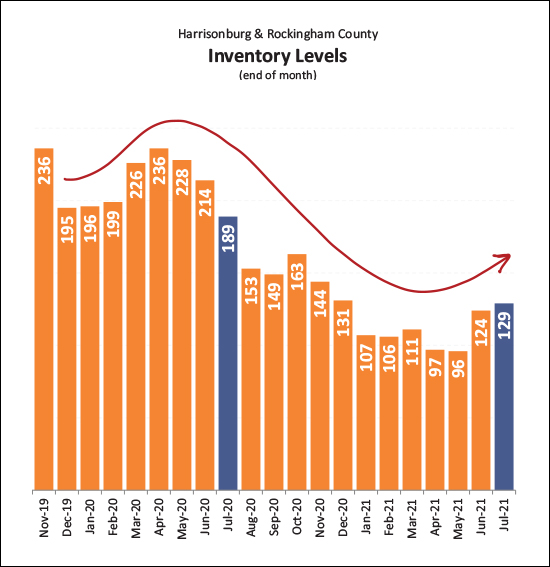
Maybe? Possibly? A little? Inventory levels crept up a bit in June and July of 2021 from terribly, dreadfully low all the way up to... yeah, still terribly and dreadfully low. Inventory levels in early August over the past few years have been 345 homes for sale in August 2018, 270 homes for sale in August 2019 and 189 homes for sale in August 2020. So, before you get too excited about inventory levels increasing from 96 homes *all the way* up to 129 homes, keep in mind that this is still far fewer homes on the market at any given time than we have seen... ever.
And finally, a happy recap of recent trends in mortgage interest rates...
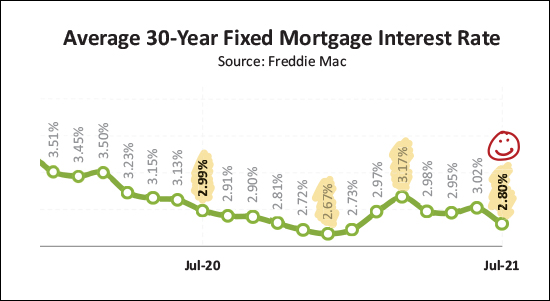
Interest rates were around 3.5% a year and a half ago, fell to 3%, then all the way down to 2.67% back in December before rising again until they were above 3% again. But, no longer. The average mortgage interest rate (on a 30 year fixed rate mortgage) has declined for a few months now and is right around 2.8% -- a welcome sign for home buyers.
OK -- I'll wrap it up there for now.
All in all...
[1] Lots of homes are selling in 2021 -- well more than in 2020.
[2] Home prices are much higher this year than last.
[3] Buyers need to be prepared to see new listings as soon as they hit the market and to make a quick decision about making an offer.
[4] Sellers are likely to continue to see favorable market conditions for at least the next six to twelve months. You'll still need to price your home appropriately, prepare it to show well and market it thoroughly -- but you'll likely enjoy the price for which you sell your home.
If you made it this far, thanks for reading. Drop me a line to let me know if you have any questions about our local housing market -- or even more interestingly, to tell me about about your favorite adventure of summer 2021!
I'd love to hear from you!

