Brought to you by , Funkhouser Real Estate Group, , scott@HarrisonburgHousingToday.com
Tuesday, October 12, 2021
Happy Tuesday Morning, Friends!
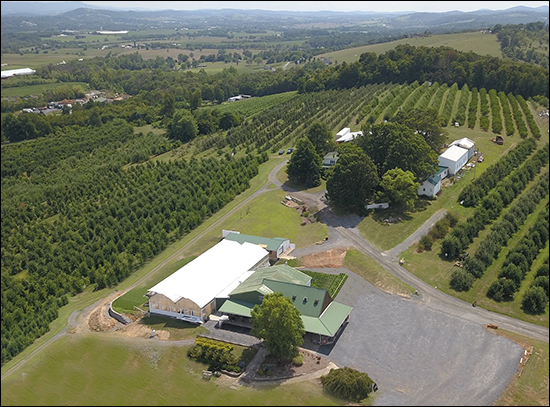
I hope October is treating you well and that you are enjoying the cooler temperatures as much as I am. Earlier this month I had a great time picking apples at Showalter's Orchard in Timberville for the very first time. I brought home plenty of apples and some of their delicious apple cider. I had high hopes of baking some of those apples into a crisp... probably to be enjoyed with some vanilla ice cream and caramel sauce... Delicious! Alas, thus far those delicious, crisp, apples have only been enjoyed with a side of peanut butter -- but maybe I'll break out the apple crisp recipe yet this week. I hope you are enjoying some delicious flavors of fall yourself, and perhaps you'll consider a visit to Showalter's Orchard...
But moving past delicious, freshly grown, hand picked apples... and the desserts they might produce... let's explore the latest numbers from our local housing market for a bit.
As always, you download a PDF of all of the charts and graphs here or, if you are intrigued by the beautiful house in Fairway Hills that graces the cover of my market report this month, check it out here.
Now, let's break down the stats...
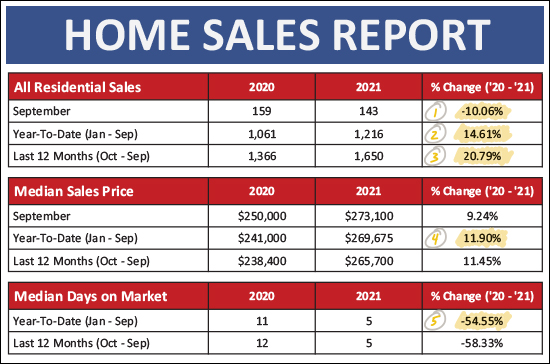
From a big picture perspective, here's what jumps out to me above...
[1] Home sales were a bit slower this September (143) than last September (159).
[2] Despite a slightly slower September, we've seen 15% more home sales thus far in 2021 than during the same time period in 2020!
[3] When looking at a full year (12 months) of data there has been a 21% increase in the number of homes selling, annually, in Harrisonburg and Rockingham County. That is a significant surge!
[4] The median sales price thus far in 2021 is $269,675 which is 12% higher than it was a year ago when it was only $241,000. This is a large increase in median sales prices in just a year.
[5] Homes were selling fast a year ago. They are selling faster now. Median days on market has dropped 55% from 11 days to five days over the past year.
When we break things down between detached homes and attached homes we can learn a bit more about what is happening in our local market. An attached home is a duplex, townhouse or condo...
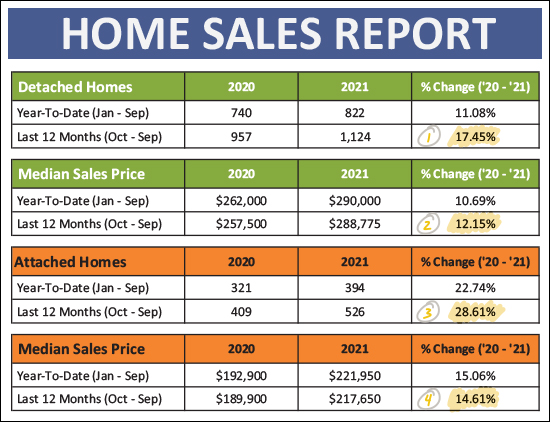
The green sections above are tracking the sales of detached homes where we find...
[1] There have been 17% more detached home sales (1,124) in the past 12 months as compared to the prior 12 months (957).
[2] The median sales price of detached homes has increased 12% over the past year, from $257,500 to $288,775. That is an increase of more than $30,000 in a single year.
The orange sections above are tracking the sales of attached homes where we find...
[3] There was a much larger, 29%, increase in the sales of detached homes over the past year. The annual pace of these detached home sales increased from 409/year up to 526/year.
[4] The median sales price of these detached homes has increased 15%, from $189,900 up to $217,650.
I mentioned earlier that home sales slowed down in September -- but maybe partially because August was bonkers?
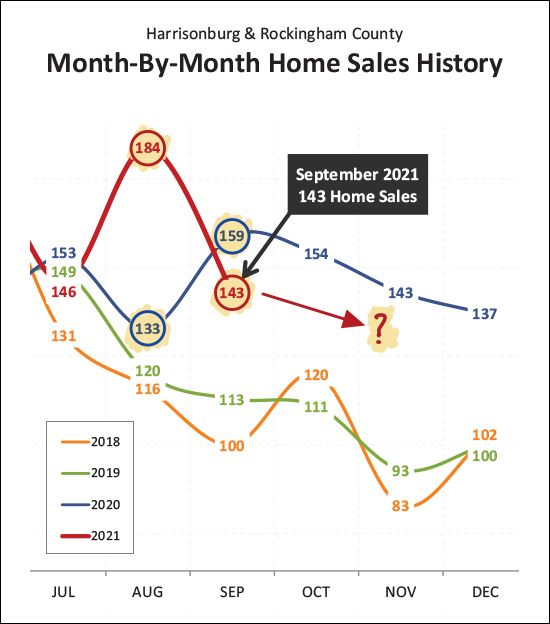
As shown above, September 2021 fell short (143 sales) of September 2020... but...
[1] Don't forget about August! There were an astonishingly high number of home sales (184) in August 2021, and if we combine August and September we find that there were 292 home sales during those two months last year, compared to 327 this year.
[2] The last four months of 2020 were abnormally active because many home sales that would have likely taken place in the first half of 2020 were pushed into the second half of 2020 because of Covid. As such, looking towards the remainder of the year, I would not be surprised if 2021 continues to under perform as compared to 2020.
Now, let's stack all of those months up to see how 2021 compares to past years...
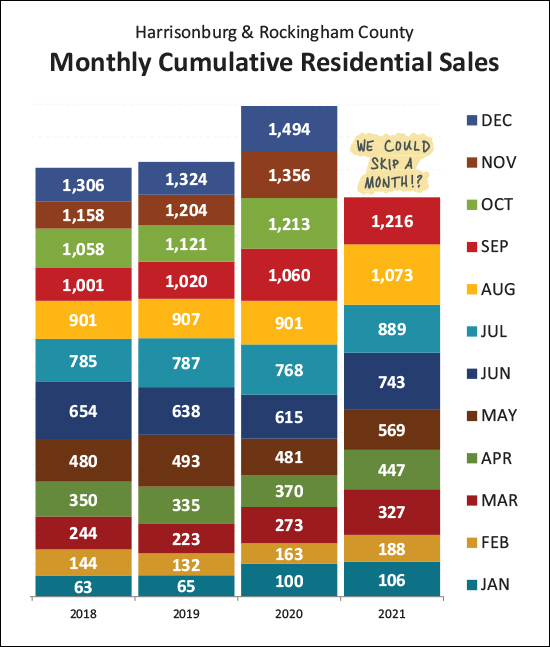
Remarkably, the home sales in the first nine months of 2021 was more than in the first ten months of 2020 and more than the first eleven months of 2018 and 2019!
So, we can take a month off, right? We could have no home sales in October and we'd still be outperforming last year! Alas, it doesn't seem like home sales will be taking a break in October.
But as for predicting future sales activity, the best bet is to look at recent contract activity...
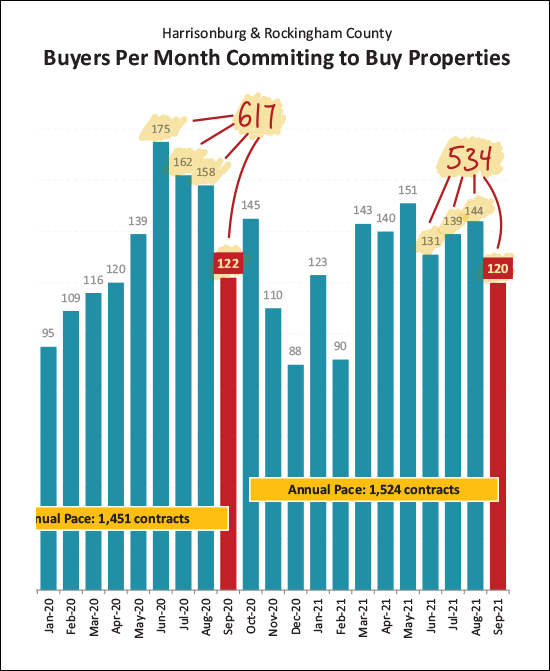
The most recent four months of contract activity (Jun-Sep) have definitely been slower than the contract activity we saw a year ago. There have been a total of 534 contracts signed between June 1 and September 30 this year -- as compared to 617 contracts signed during the same timeframe last year. This likely means we'll see somewhat fewer home sales over the next few months.
This next graph won't surprise you as you've likely heard about the extremely low inventory of available homes in this area...
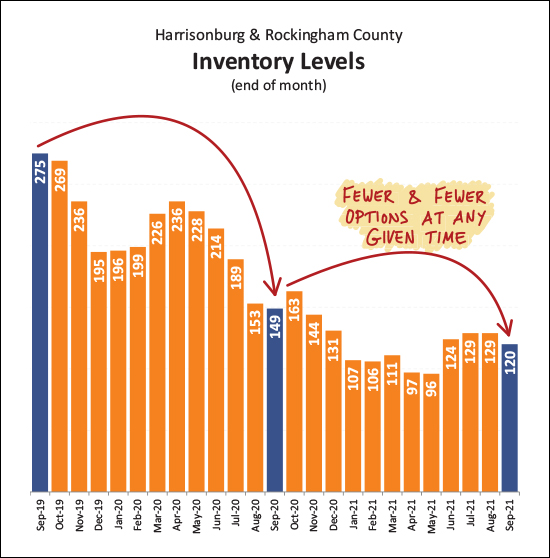
As I have mentioned before, this graph can be a bit misleading. Some might understand it to mean that there are fewer and fewer homes for sale and thus fewer and fewer homes are selling. But, in fact, we have seen 21% more home sales in the past 12 months as compared to the prior 12 months -- so what's the story? The second half of my comment above "at any given time" is the key to unlocking this mystery. Homes are selling (going under contract) quickly, and thus the number of homes on the market at any given time is continuing to stay low. That doesn't mean that there aren't homes on the market to buy -- there are, or were -- but most will go under contract and not be available for any more than a few days.
So, as a buyer, be prepared to act quickly, likely compete with other buyers, and possibly have to wait a bit to find the right opportunity.
Interestingly, the changes in inventory levels haven't affected all property types in the same way...
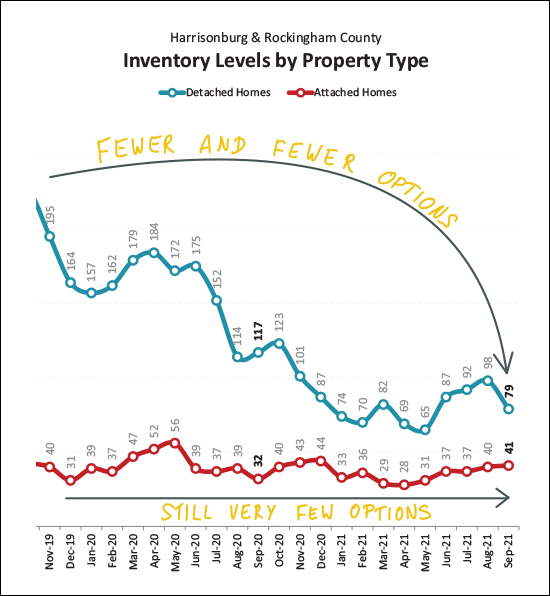
The blue line above is showing changes in the number of detached homes on the market at any given time. You'll note that these inventory levels have dropped quite a bit over the past two years. The red line, showing attached homes) has been very low and remained very low for quite some time now. Neither property type is likely to meaningfully increase until and unless we see a significant amount of new construction to help offset high buyer demand.
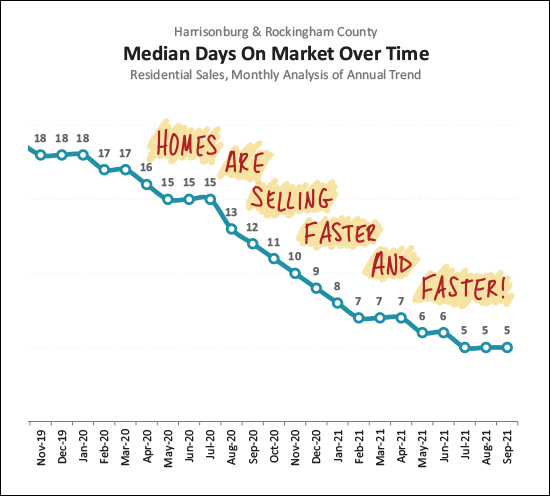
This graph is a new one, but I think an important one for keeping an eye on the mood of the market.
Days on market, as shown above, measures how quickly homes are going under contract. Independent of how many homes are selling and the prices at which they are selling -- if they are going under contract quickly then the market is strong and power is tipped towards sellers -- and if homes are taking a longer time to go under contract the market is not quite as strong and power is starting to balance out between sellers and buyers. Over the past three years we have seen a steady decline in how long it takes homes to go under contract, with a current median of five days on the market.
I'll continue to monitor this "days on the market" metric over time to see if things are cooling off at all in our local market. That doesn't seem to be happening yet. :-)
You might have heard that mortgage interest rates are increasing, but...
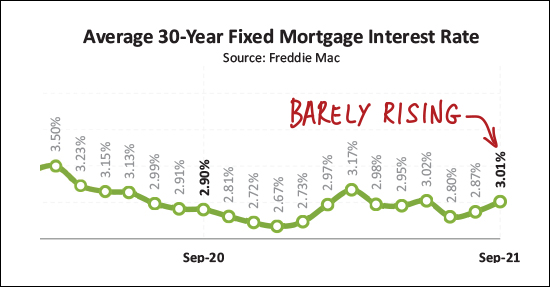
I have read quite a few headlines lately about how rising interest rates are certain to dampen home buyer enthusiasm. If I had a dollar for every time someone told me (or I told you) that interest rates were going to rise over the past seven (+) years...
Mortgage interest rates were around 3.5% a year and a half ago, and around 3% a year ago, and are around 3% now. So, are interest rates rising? Sure, a bit, depending on when you pick as the "then" to compare to the "now" but they are still very (very!) low.
Alrighty then! That brings my monthly deep dive into our housing market statistics to a close, for now. As usual...
If you are thinking of selling your house this fall or winter, let's talk sooner rather than later about timing, pricing, preparations and more.
If you're thinking of buying this fall or winter, start looking now, because there aren't many houses on the market, so we'll likely need to patiently wait for the right opportunity to come along and then jump on it, quickly!
Have a great remainder of the week, and if you visit Showalter's Orchard and subsequently make apple crisp, text me a photo to make me jealous... or invite me over to sample it... I'll bring the ice cream and caramel sauce! ;-)

