Brought to you by Scott P. Rogers, Funkhouser Real Estate Group, 540-578-0102, scott@HarrisonburgHousingToday.com
Brought to you by Scott P. Rogers, Funkhouser Real Estate Group, 540-578-0102, scott@HarrisonburgHousingToday.com
Tuesday, December 13, 2022
Happy Tuesday morning, friends!
Winter is upon us. The holidays are upon us. I hope you have been enjoying the variety of Christmas light displays in and around Harrisonburg. Shaena and I, with several other family members, greatly enjoyed visiting the "Winter Wander" light display at the Boar's Head Resort in Charlottesville a few nights ago. Next time maybe we'll have to dine there or stay over as it was quite lovely! Check out the lights at Winter Wander yourself between now and January 7th...

Before we move onto the real estate data we're all waiting for, each month I offer a giveaway, of sorts, for readers of this market report, highlighting some of my favorite places (or things) in Harrisonburg. Recent highlights have included Walkabout Outfitter, Bella Gelato and the JMU Forbes Center.
This month, I encourage you to go check out Grilled Cheese Mania on Main Street in Harrisonburg. If you find me at GCM, you'll likely find me enjoying the Triple Lindy with a side of Miss Tess' Tomato Mac. :-) Click here to enter to win a $50 gift certificate to Grilled Cheese Mania!
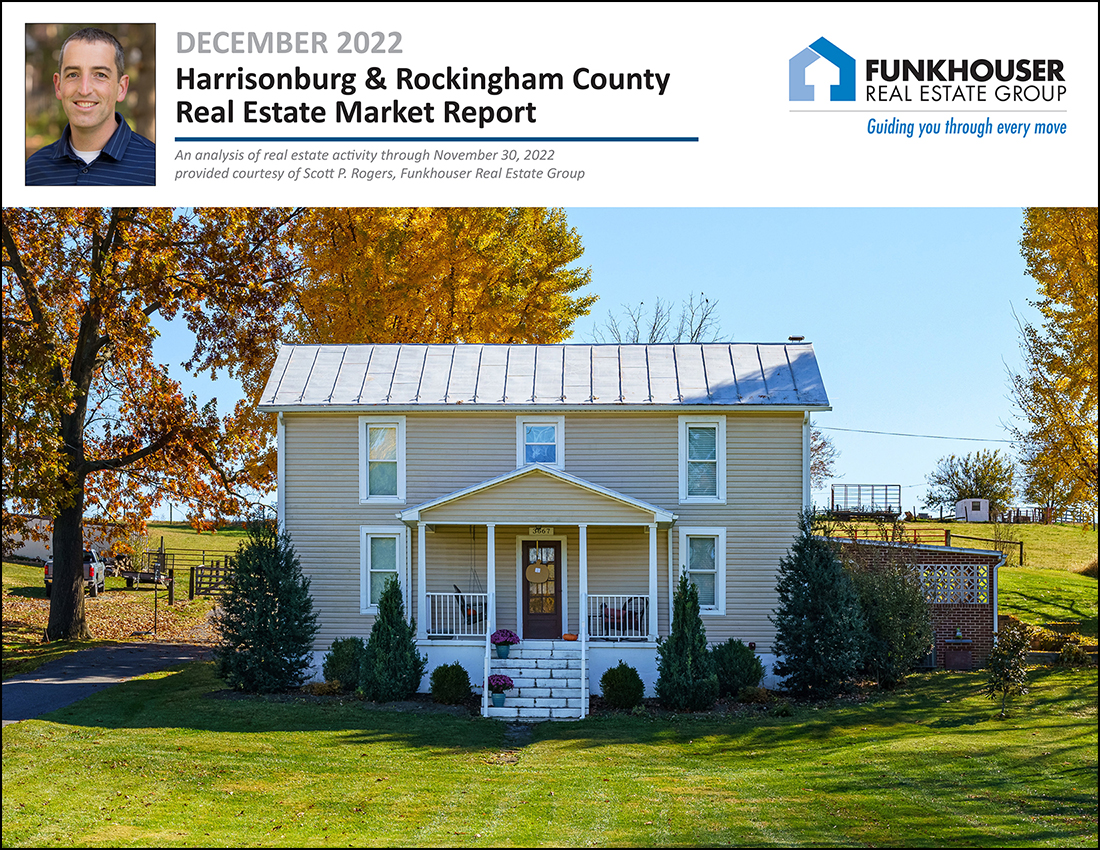
Finally, take a few minutes to check out this month's featured home... a spacious, remodeled farmhouse on an acre in the Turner Ashby district with some excellent outdoor amenities located at 3667 Dry Hollow Road!
Now, let's take a look at the latest data in our local real estate market...
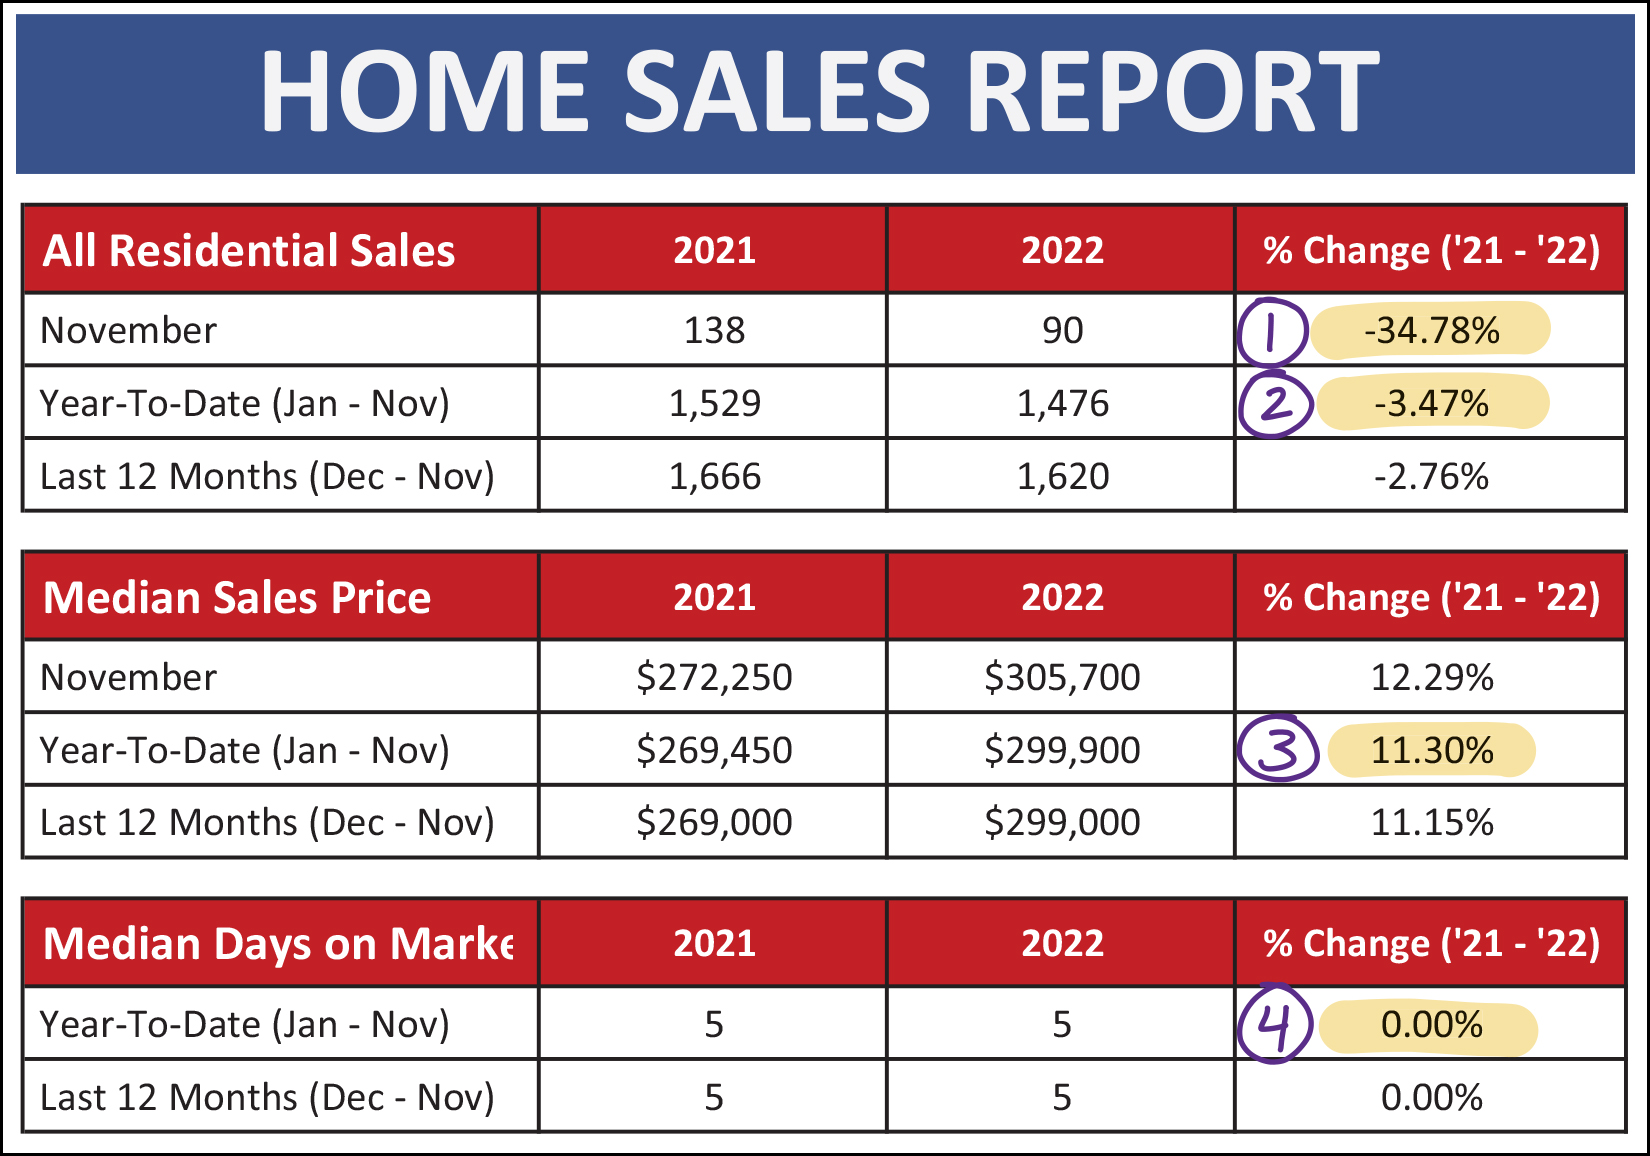
Let's drive right into a few of the main metrics of our local housing market outlined above...
[1] Home sales slowed considerably this November compared to last November... declining 35% from 138 sales to 90 sales. You'll see a clearer (and more startling) visual of that shortly.
[2] This significant decline in the number of home sales in November 2022 resulted in an overall 3.5% decline in 2022 home sales as compared to 2021 home sales when viewing the first 11 months of the year.
[3] But yet... the median sales price in our area keeps on rising, up 11.3% from a year ago to $299,900 when looking at the first 11 months of 2022.
[4] Furthermore, homes are (as a whole) still selling just as quickly... with a consistent median of five days on the market thus far in 2022, which matches the speed of home sales a year ago.
Now, that startling visual of the November 2022 dip in home sales...
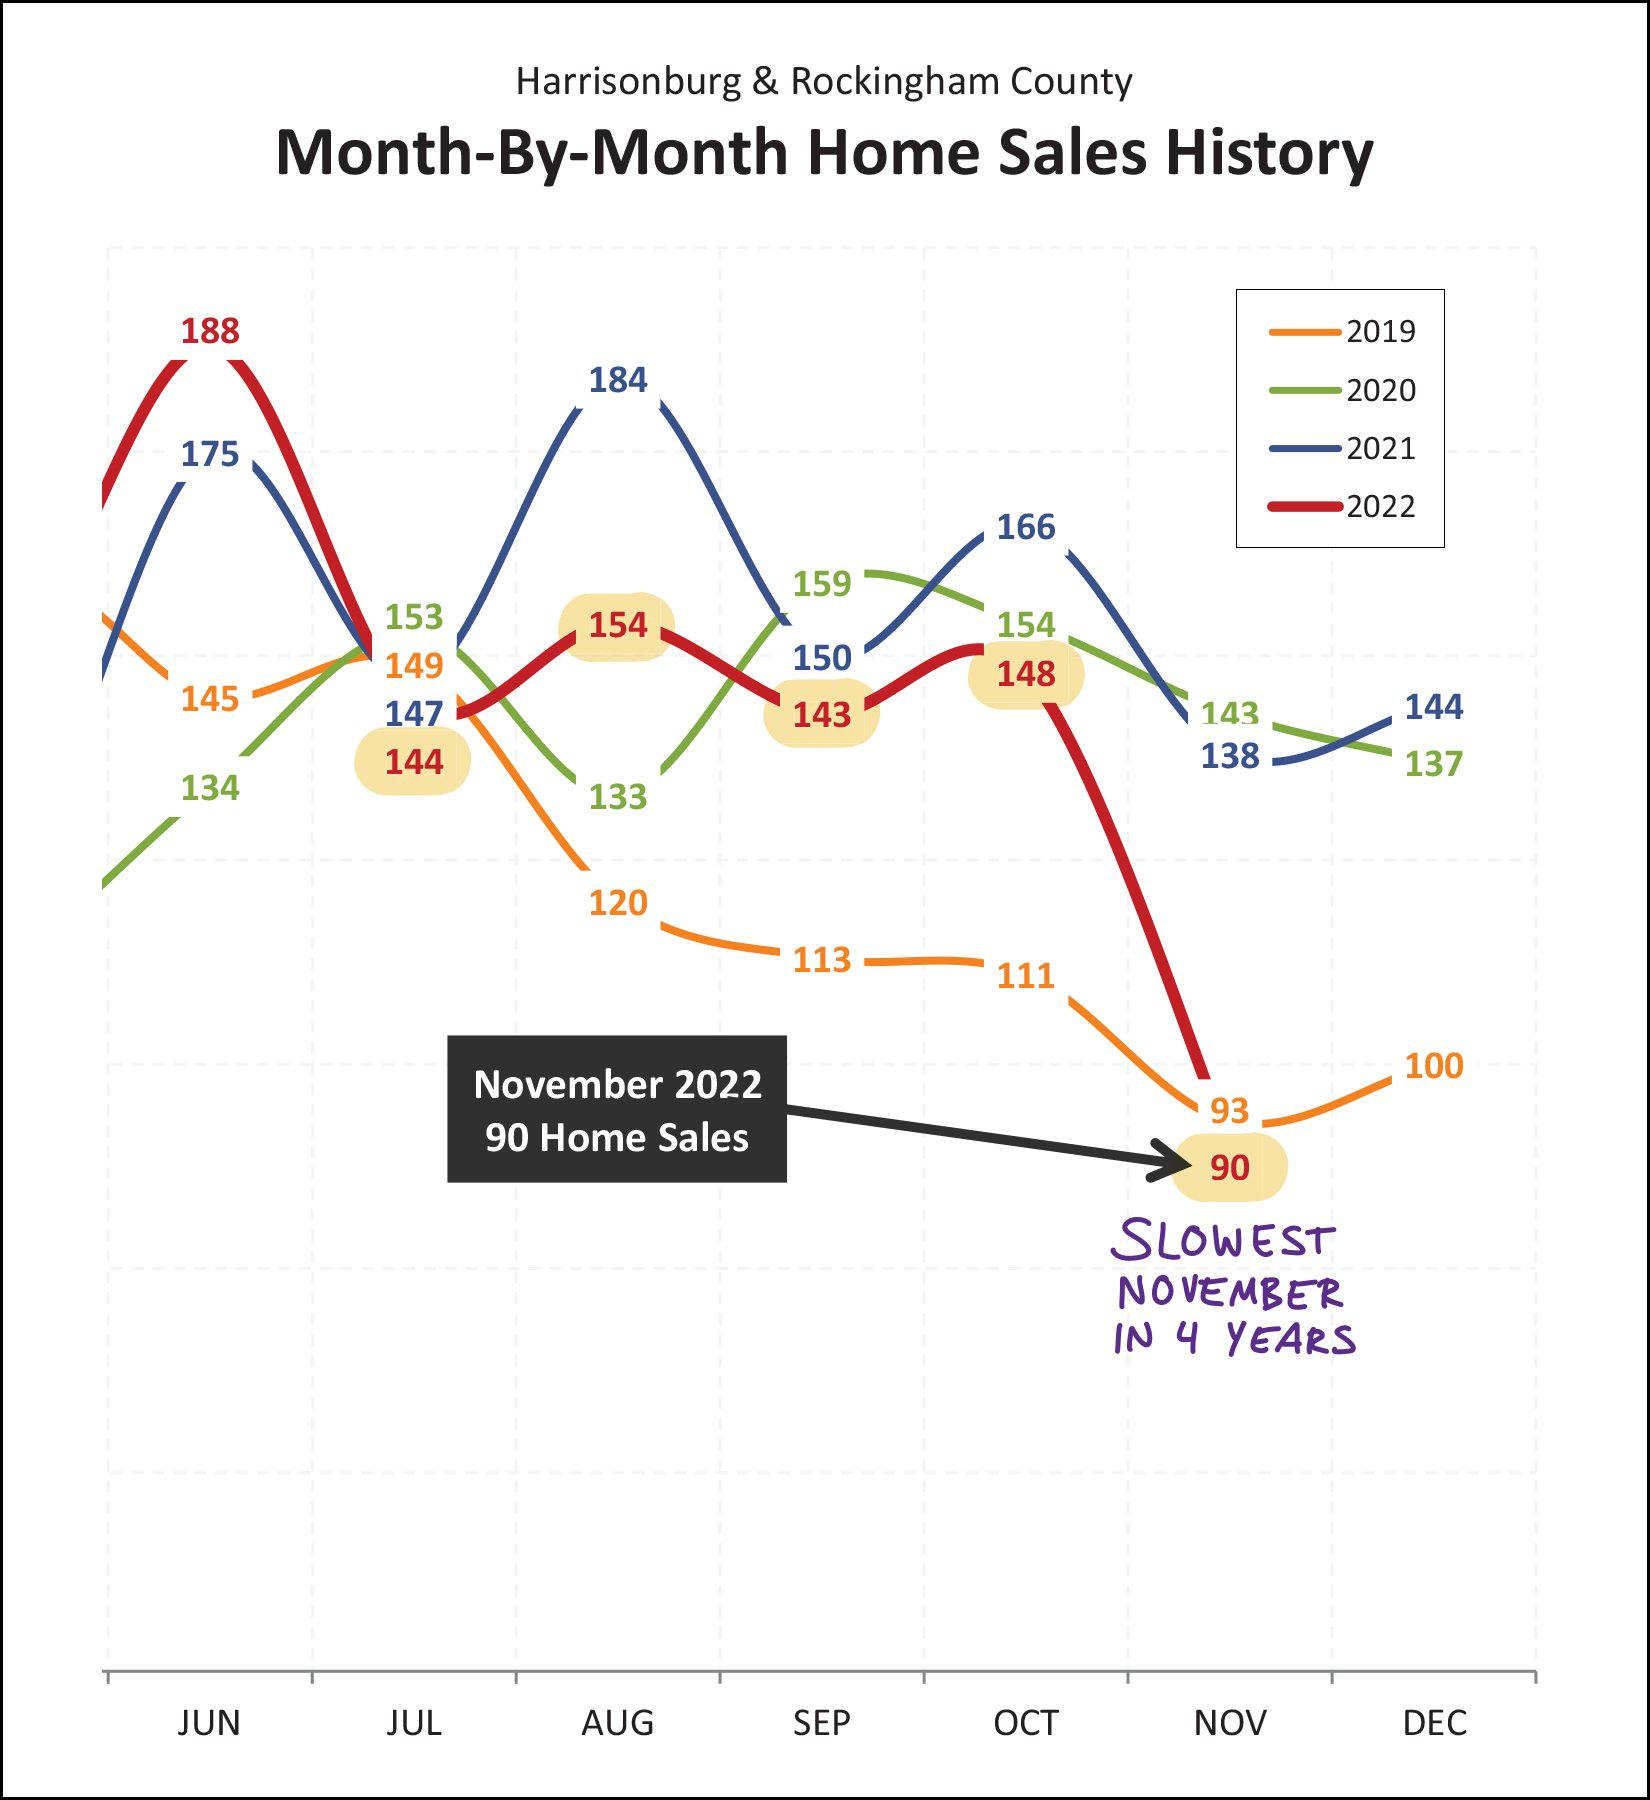
Lots to note regarding the graph above...
[1] We saw slower (fewer) home sales in each of the four months leading up to November. This was not altogether surprising, as mortgage interest rates have been steadily rising throughout 2022.
[2] Home sales really (!!!) slowed down in November 2022... dipping down to 90 home sales as compared to 138 in the same month last year.
[3] The 90 home sales this November is not actually that different than the 93 seen back in November 2019.
[4] The past two years (2020 and 2021) may very well be anomalies given that they were during the Covid induced overheating of the local real estate market. If we look at the five Novembers prior to 2020 (thus, 2015-2019) we'll find an average of 94 home sales in November.
So... home sales dropped significantly in November 2022. That's somewhat surprising, as it finishes off a long, multi-year, run of a super exuberant local housing market. It's also not that surprising, given rising mortgage interest rates, and given what usually happens in November if we're not in Covid times.
As we'll see below, the temporary (crazy) boom in home sales brought on by Covid and super low mortgage interest rates may be coming to an end...
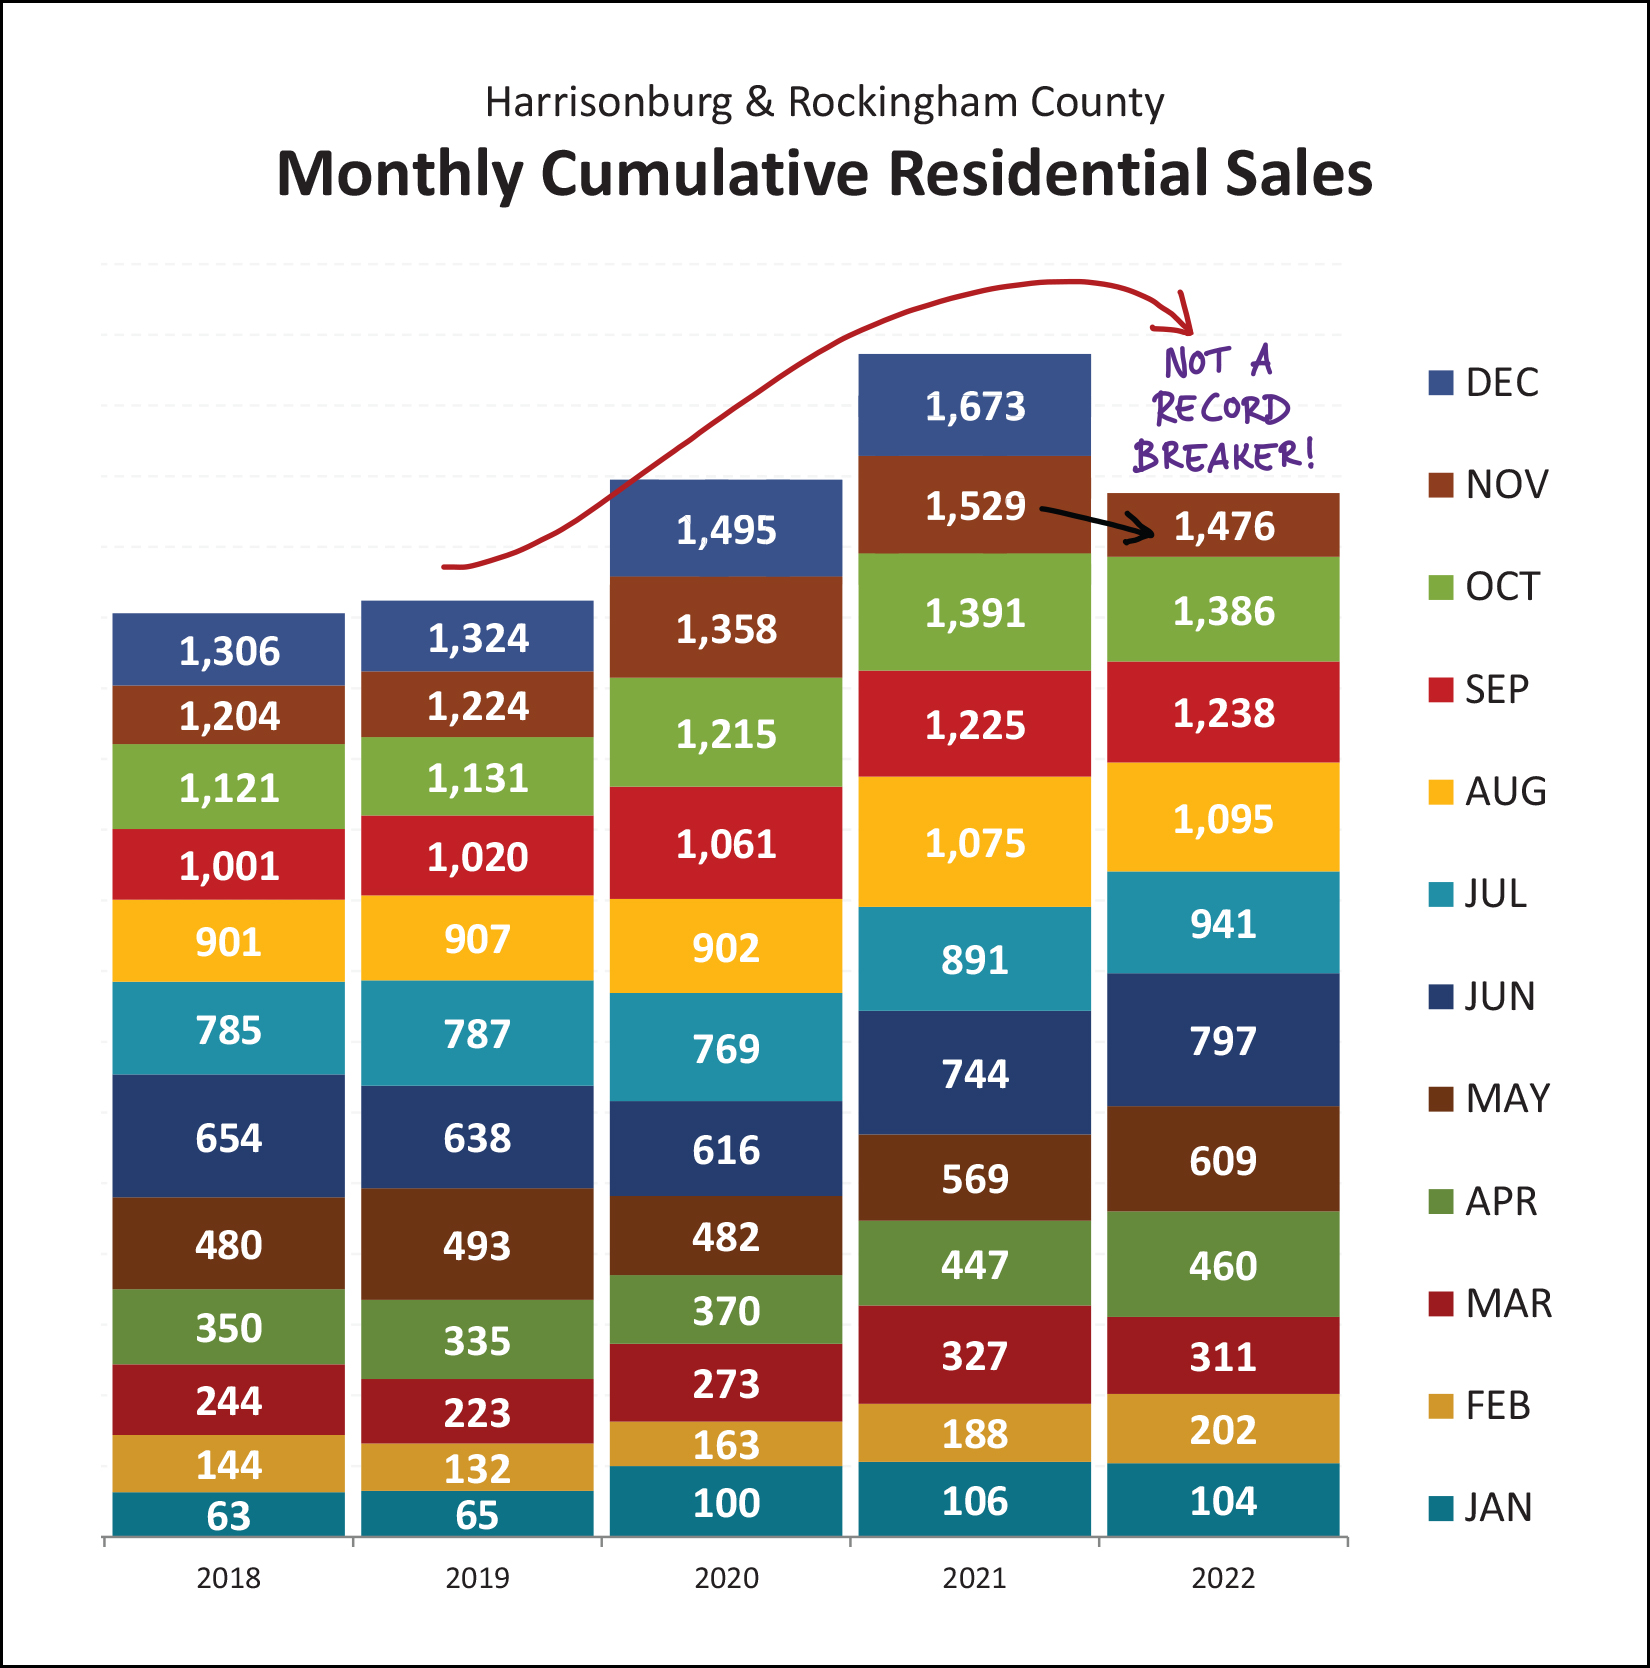
Prior to Covid (2020-2021) we had been seeing a relatively consistent 1300-ish home sales per year. Then, the market went crazy during 2020 and 2021 and home sales approached 1500 sales in a year, and then almost reached 1700 sales in a year. That string of two record breaking years in a row... won't continue in 2022.
All the way up through September 2022, it was seeming that we'd have yet another record breaking year this year. But 2022 fell slightly behind in October, and even further behind in November. Looking ahead, it seems likely that 2022 will end up being the second strongest year of home sales ever in Harrisonburg and Rockingham County... just behind 2021.
Looking at things from a slightly longer term perspective, we can see yet again how the local real estate market is slowing a bit after having peaked in 2021/2022...
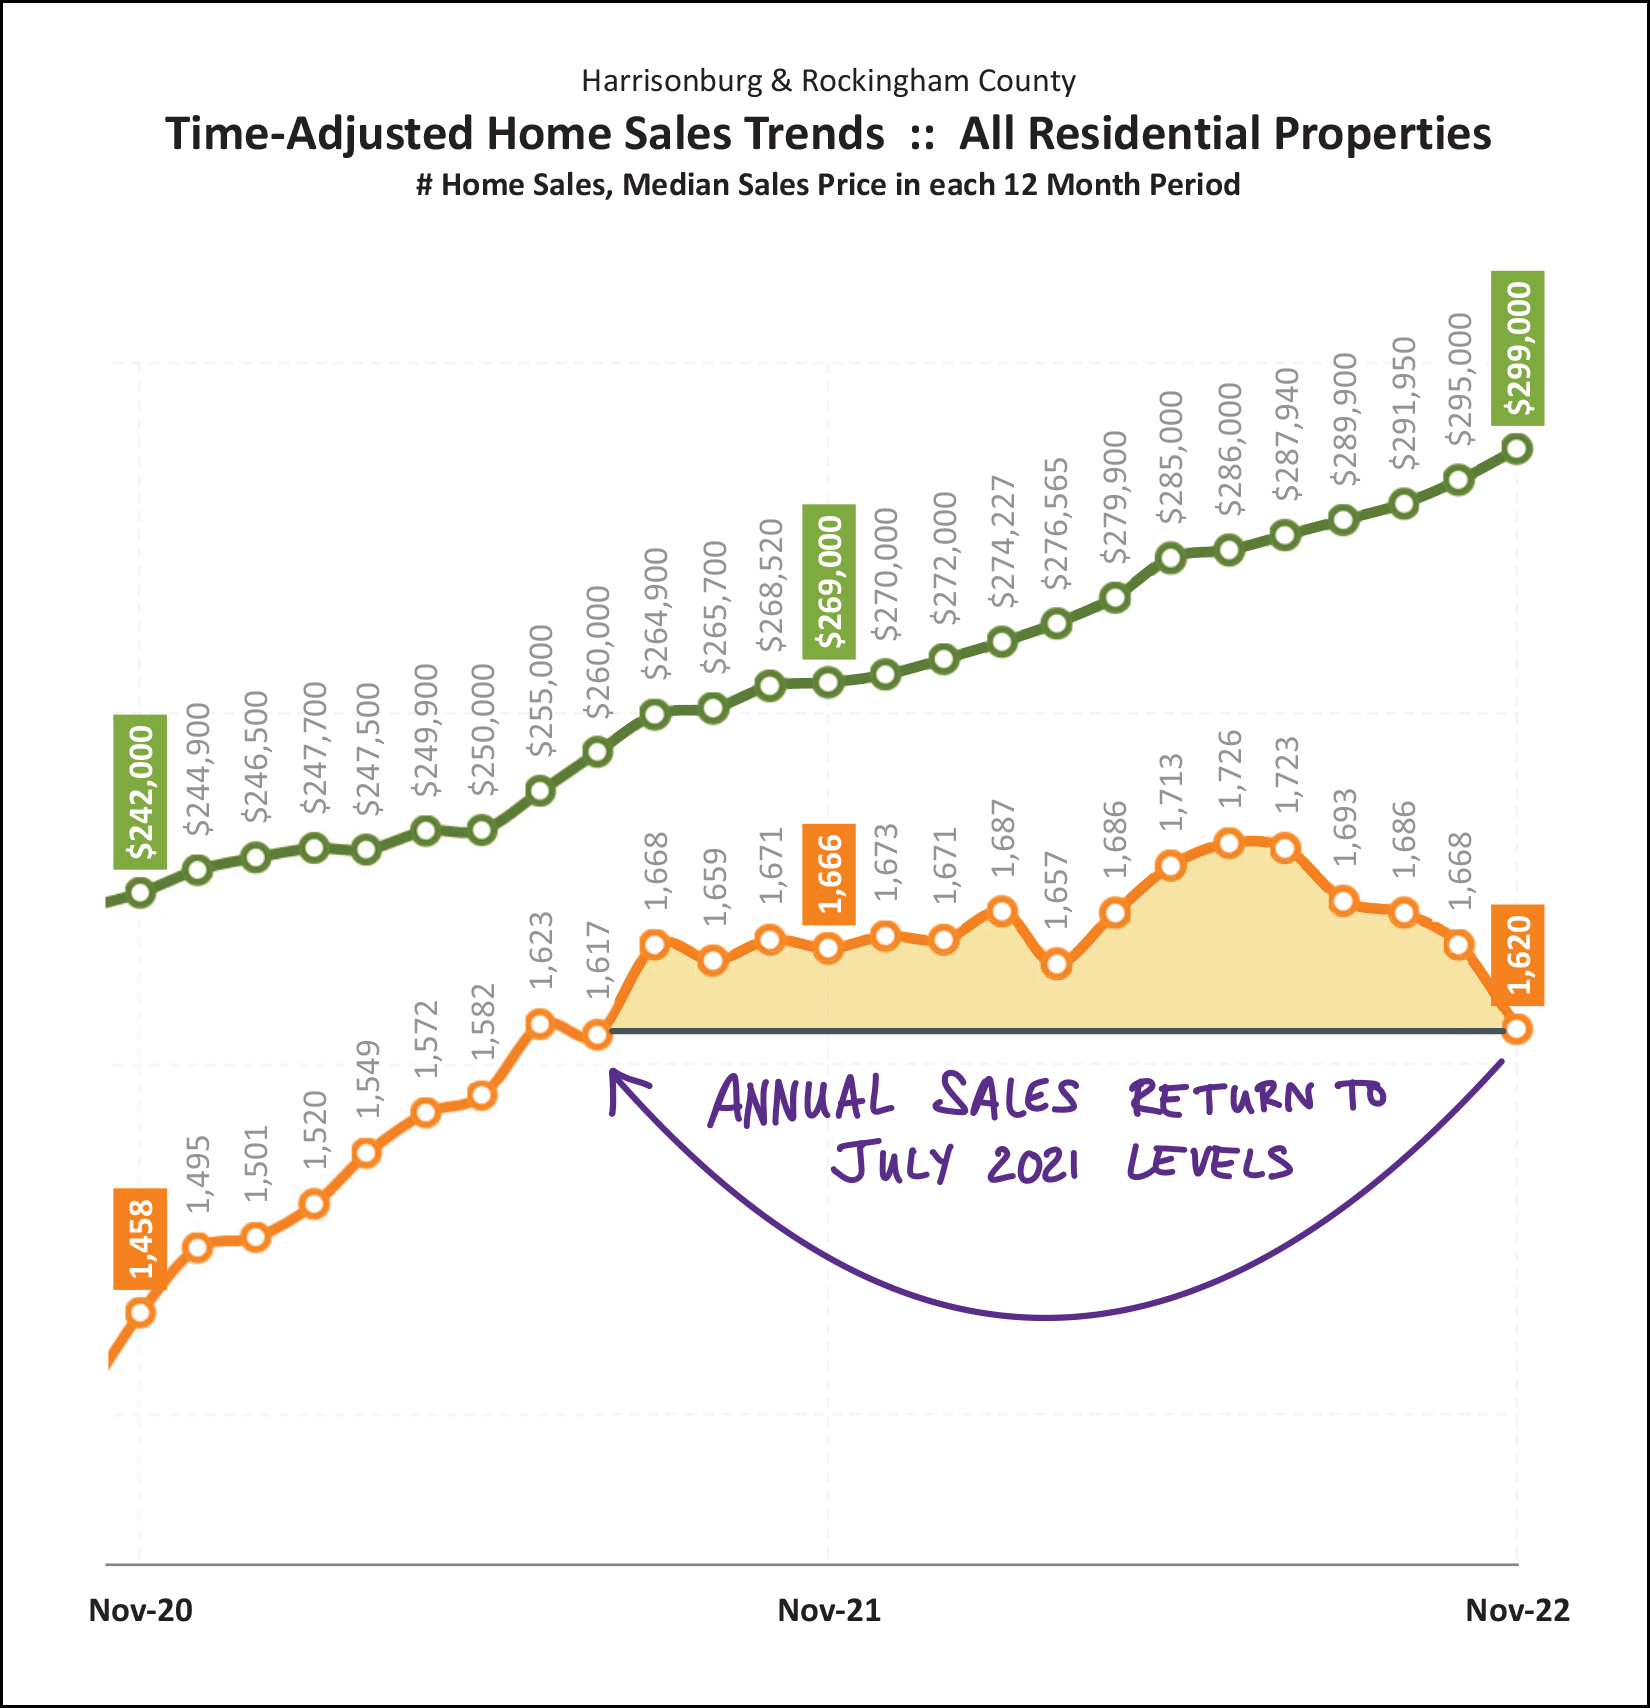
A year and a half ago (ish) we were seeing home sales at an annual pace of 1,617 sales per year... back in July 2021... which included sales from August 2020 through July 2021.
Now, we're seeing home sales at an annual pace of 1,620 sales per year... which includes sales from December 2021 through November 2022.
So, the market has retreated a bit... with fewer sales per year now than we've seen for the past year and a half-ish. This was highly predictable given rather dramatic increases in mortgage interest rates.
It is somewhat surprising, however, that the decline in annual sales has been as small as it has been given how much mortgage interest rates have increased. The pace of annual sales peaked at 1,726 sales... and we have only seen a 6% decline from that peak... to 1,620 sales per year.
Now, then, given that home sales are slowing, we're almost certainly seeing inventory levels rising, right?
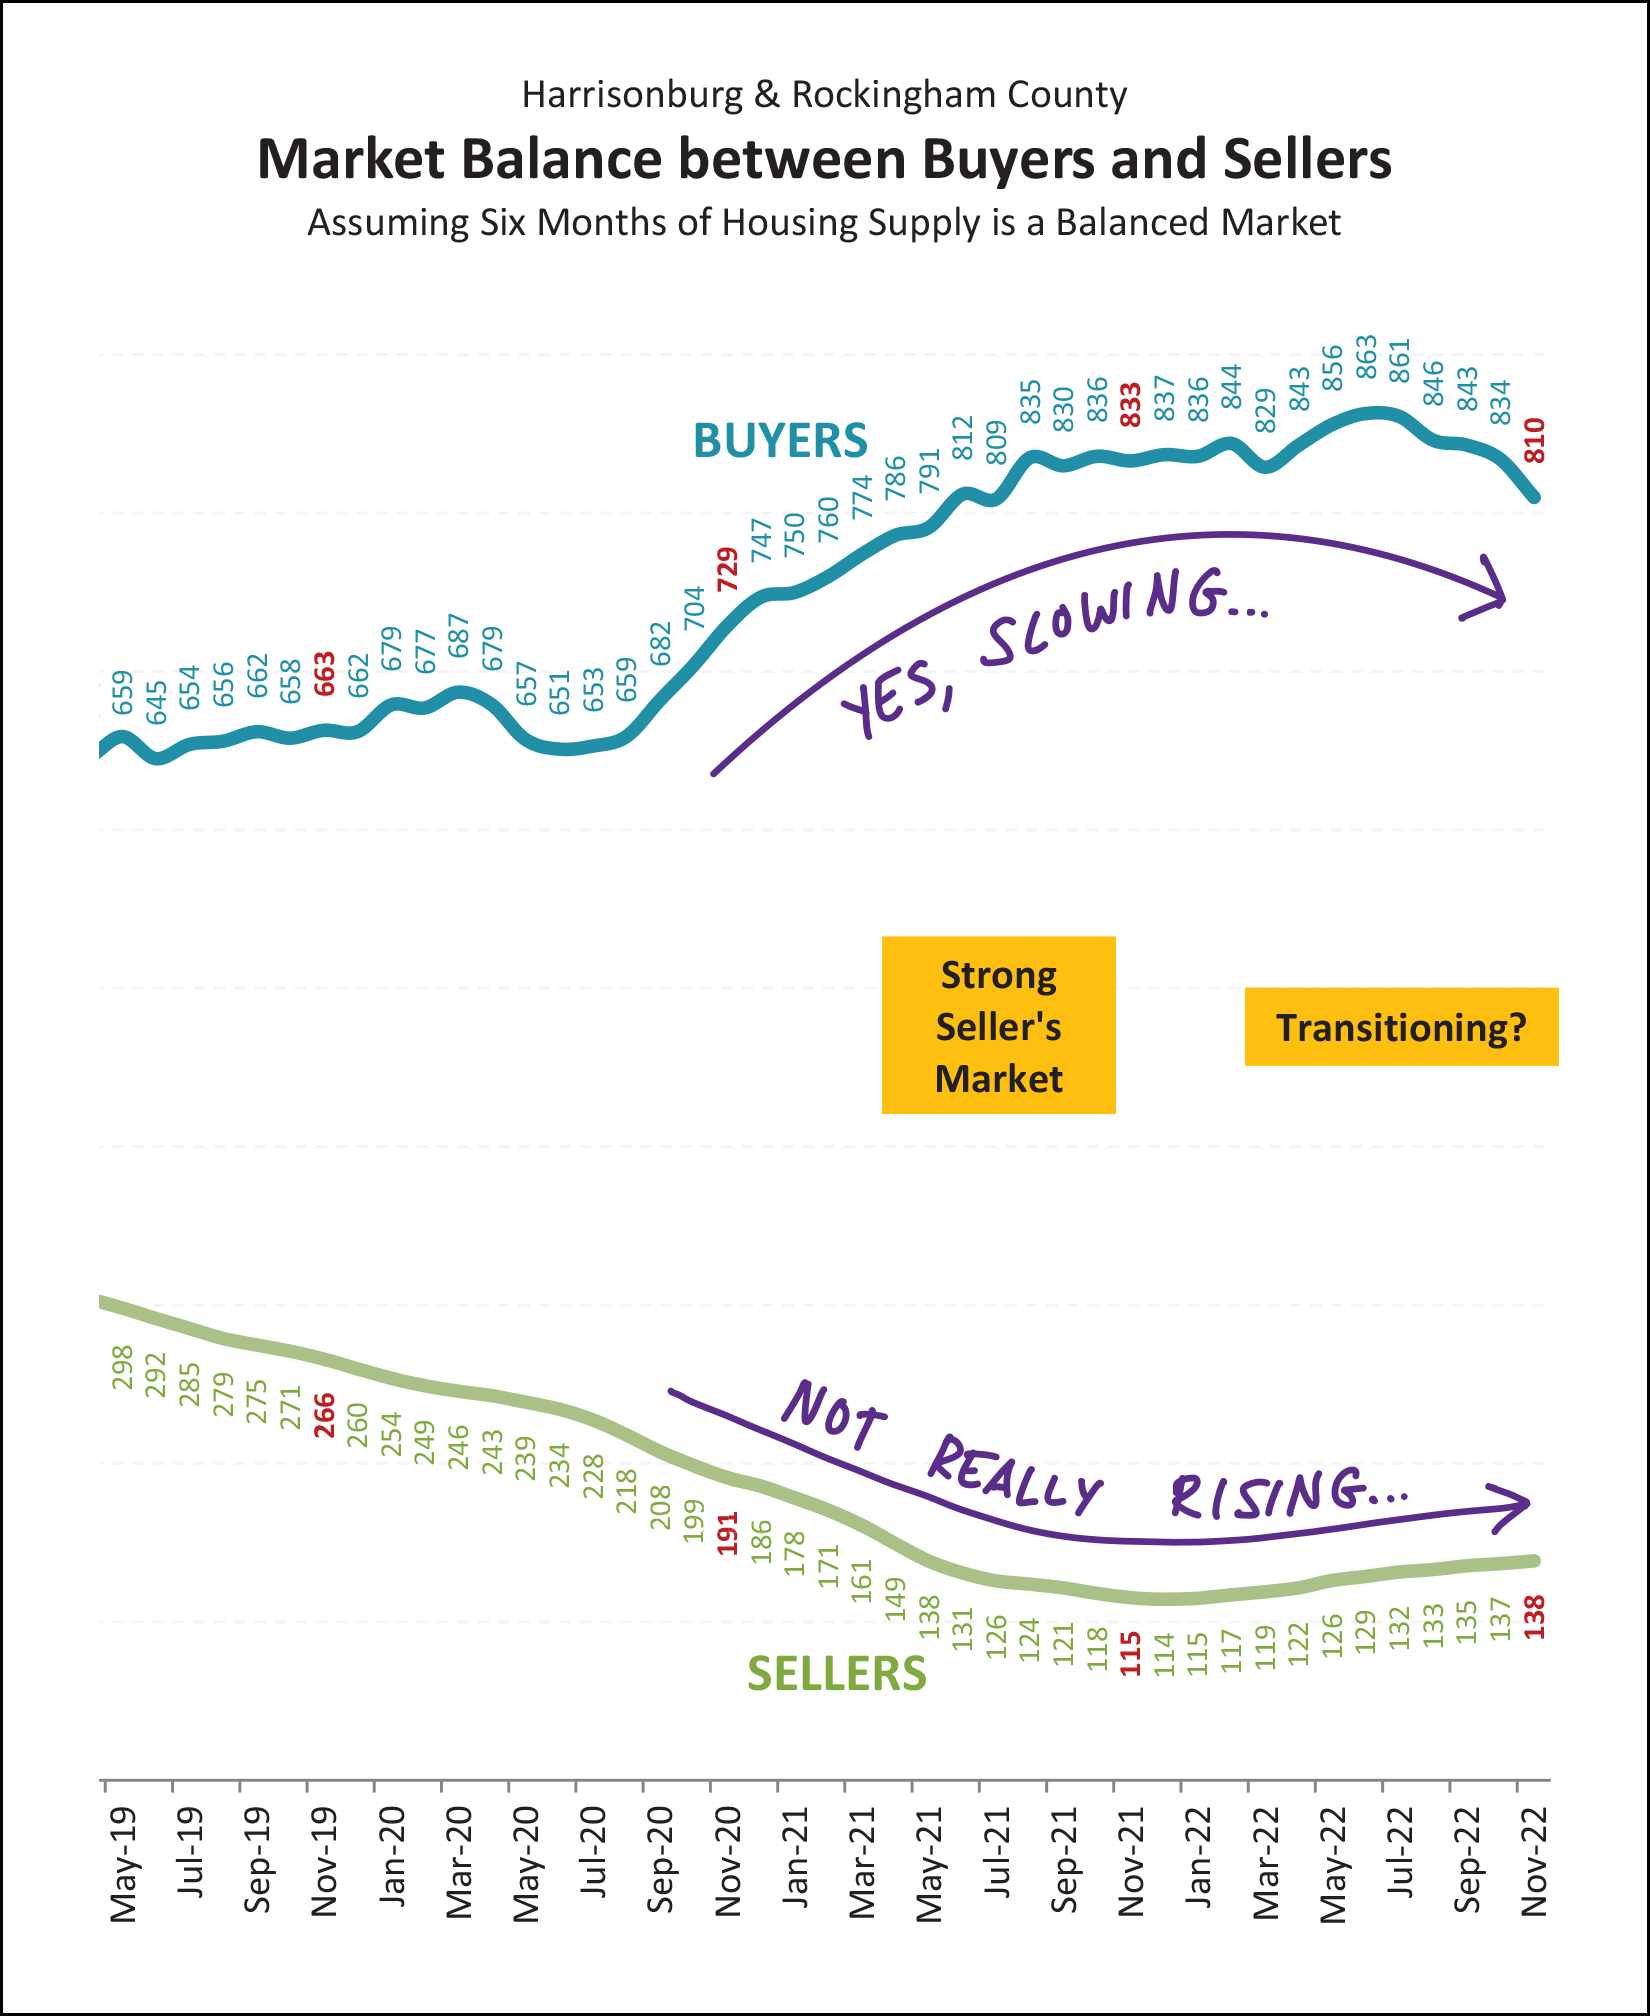
I'll make this point a few more times as we continue through these graphs, but here's your first visual showing that even if the market is starting to transition a bit, it's not doing it very rapidly.
Yes, home sales are slowing. The graph above shows how many buyers are buying in a six month timeframe. We have seen a decline over the past year from 833 buyers buying every six months down to 810 buyers buying. So, yes, the pace of buyers committing to buy is certainly slowing.
But... we're not seeing as much of an increase in sellers selling (inventory levels) as we might otherwise expect. We've seen an increase over the past year from 115 homes for sale up to 138 homes for sale, but that's still a notable net decline in inventory from two years ago and three years ago.
So, is it a slightly less strong seller's market now? Yes. Is it still a strong seller's market now? Yes.
Now, looking at contract activity for a moment, to predict where things might be headed from here...
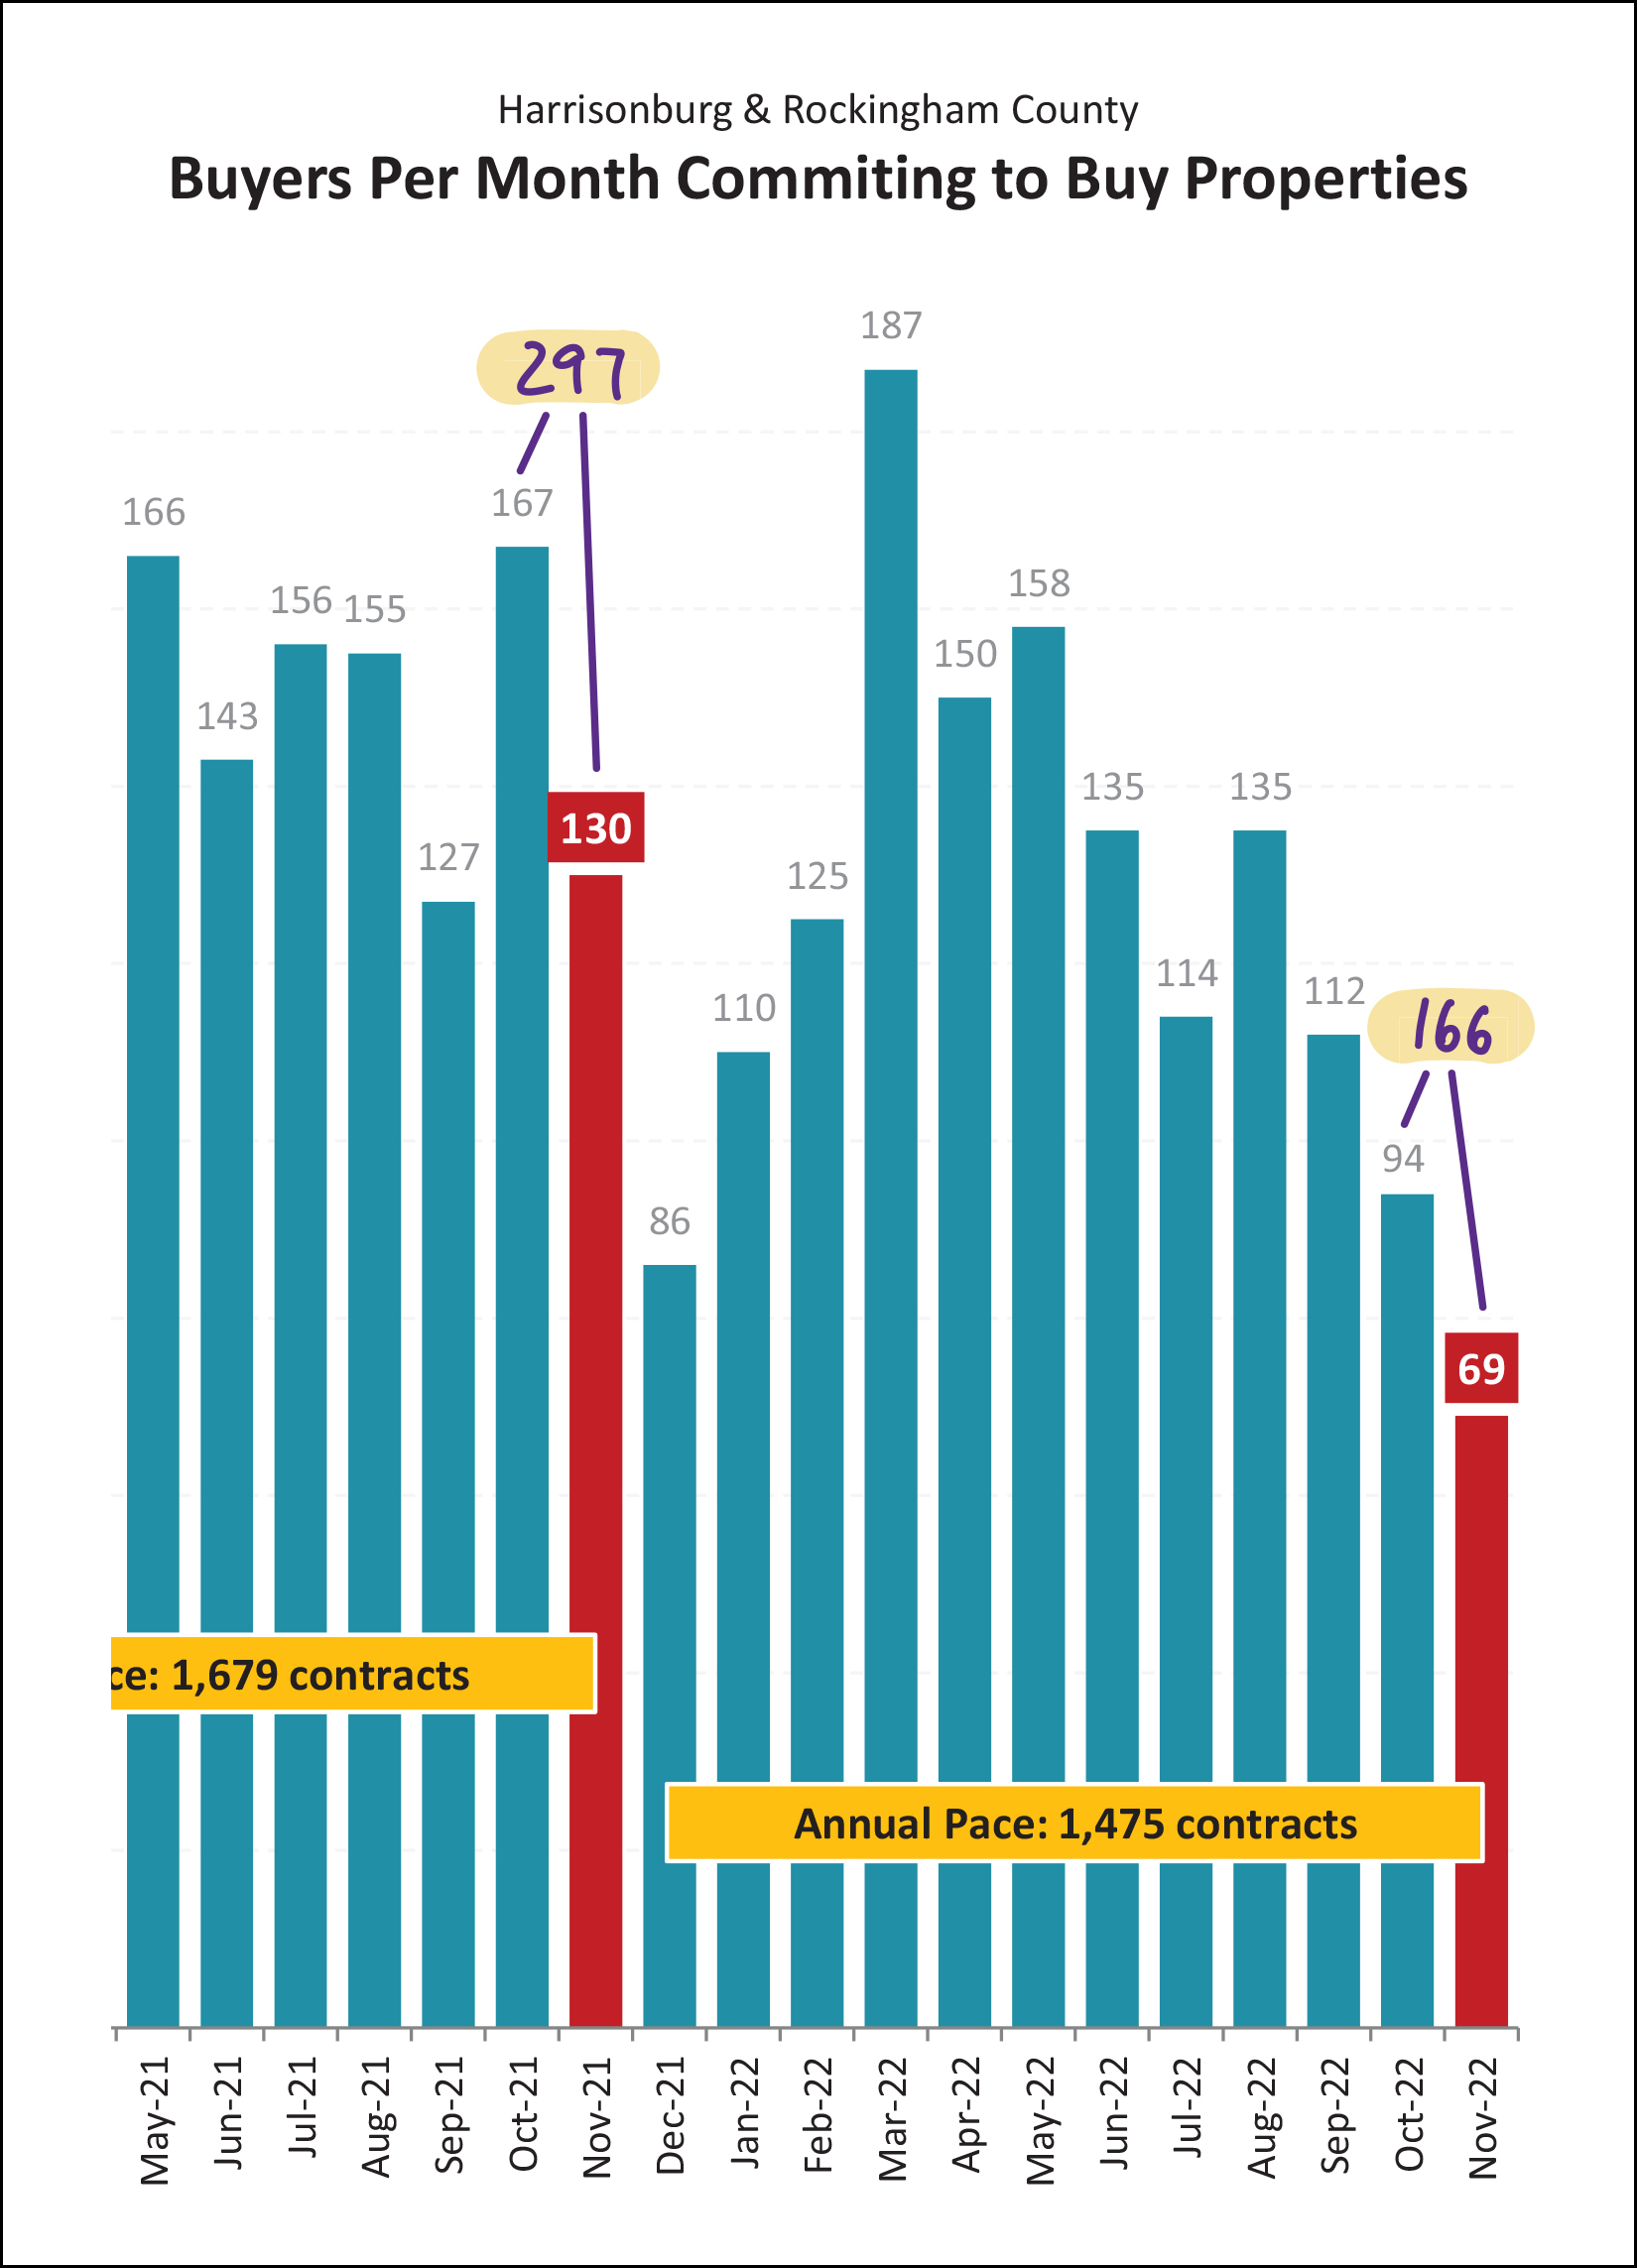
As becomes evident with my handwritten note on the graph above... contract activity this October and November was MUCH slower than last October and November! After a combined total of 297 contracts being signed during that two month period last year... we have seen only 166 contracts signed this October and November, which is a 44% decline!
Again, first, not a total surprise. Buyers are a bit less excited to sign contracts to buy homes with interest rates of 6% to 7% (this Oct/Nov) as compared to when interest rates are 2.5% to 3.5% (last Oct/Nov).
Second, these lower contract numbers have started to result in lower sales numbers and that is likely to roll into December sales and January sales.
Finally, it's important to remember that past two winters (2020, 2021) were a bit abnormal given Covid (lots of buyers wanting to buy a house) and super low interest rates (lots of buyers qualifying to buy a house) and this winter we seem to be returning to what was previously a typical seasonal trend of fewer contracts and sales during winter months.
Now, then, back to inventory... certainly it must be rising, given fewer closed sales and fewer contracts being signed, right?
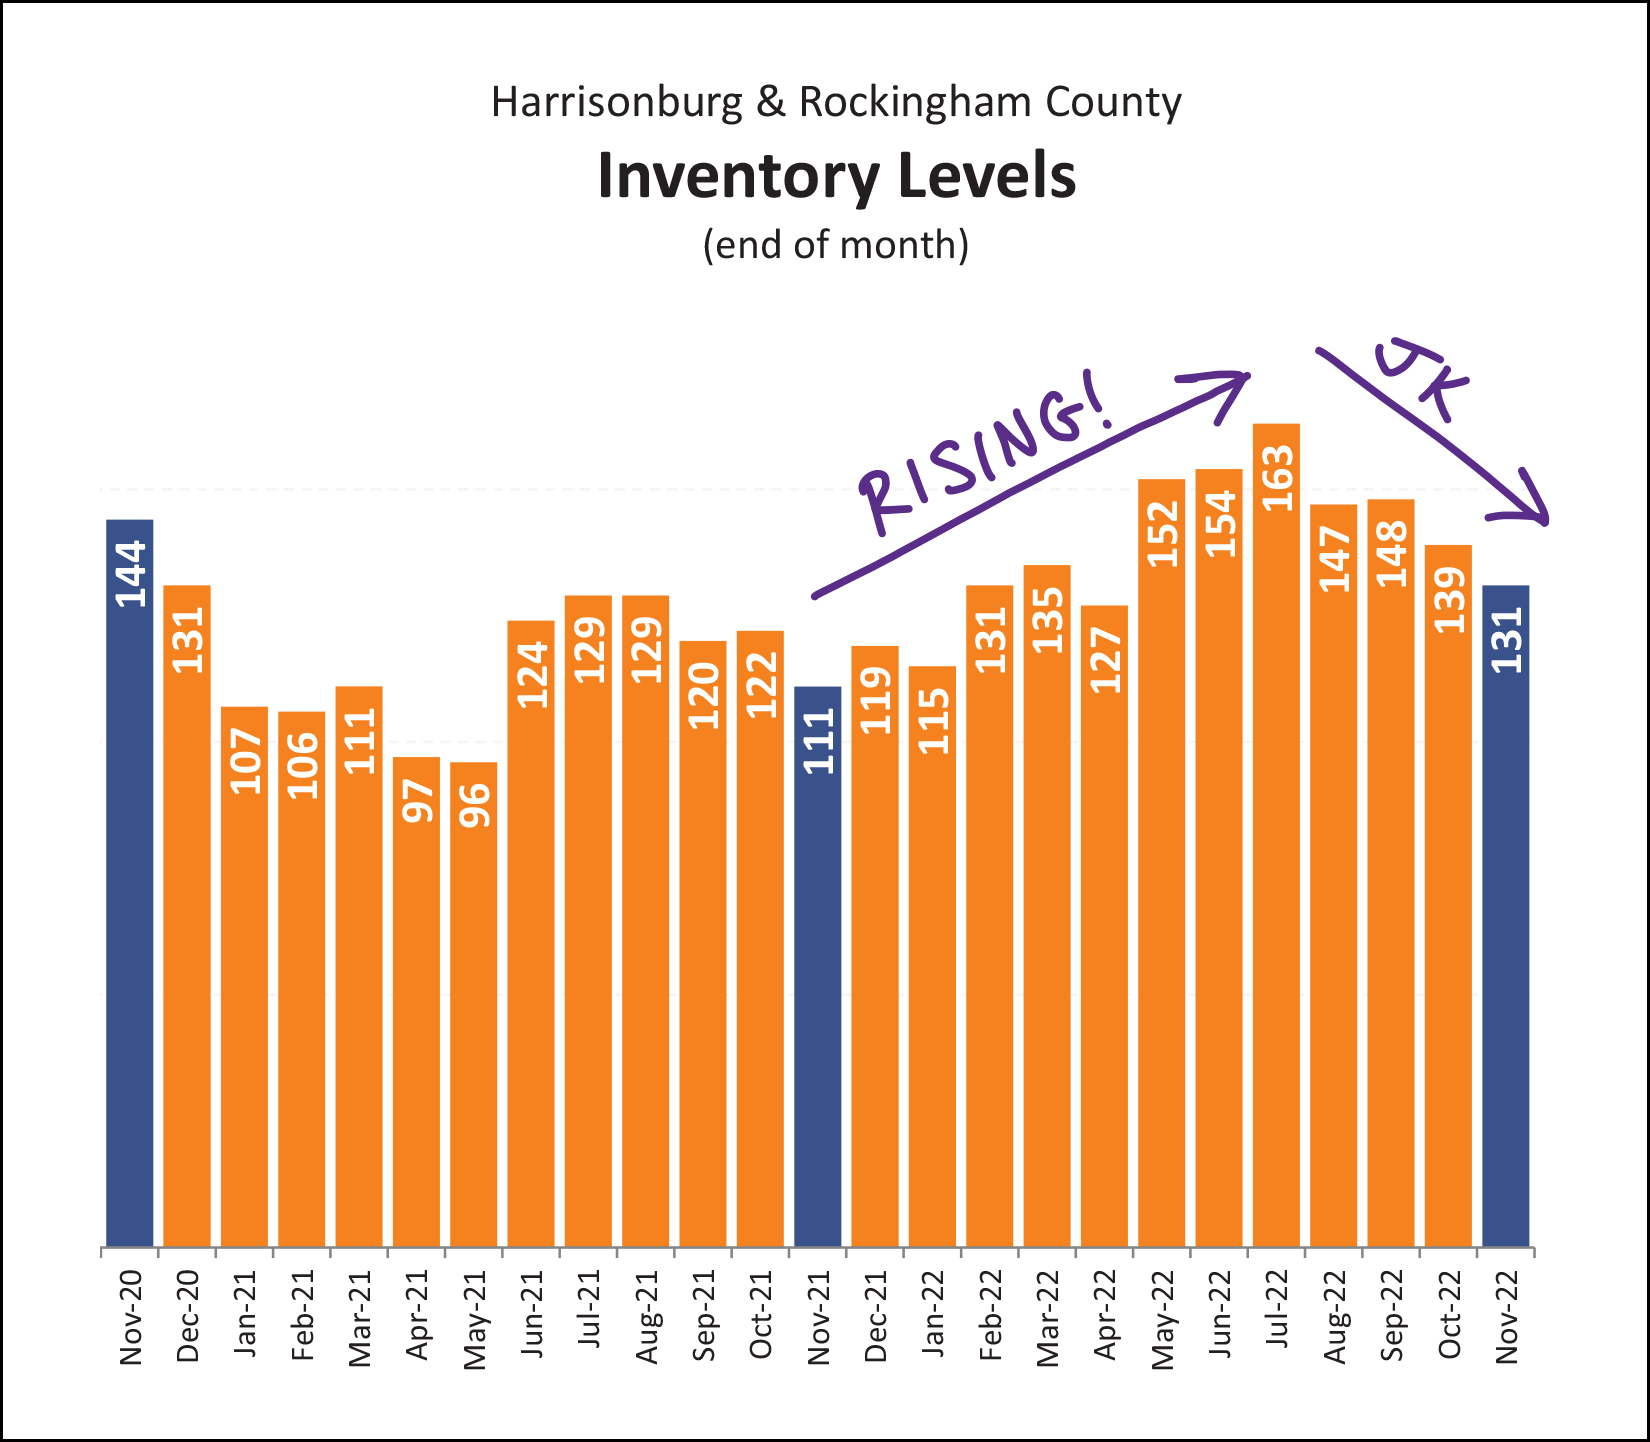
And... nope!
Inventory levels rose through much of 2022... but have now been declining for the past four months... as is relatively normal for the fall into winter timeframe. Furthermore, inventory levels are still lower now than they were two years ago.
This coming spring will be interesting, depending on how mortgage interest rates look at that time. It's typical to see lower inventory levels in the winter, and that makes the lower contract numbers less consequential. Lots of folks choose to sell in the spring and summer, and if we have lower contract numbers at that time, then we could see inventory levels starting to measurably increase.
Driving this point home one more time...
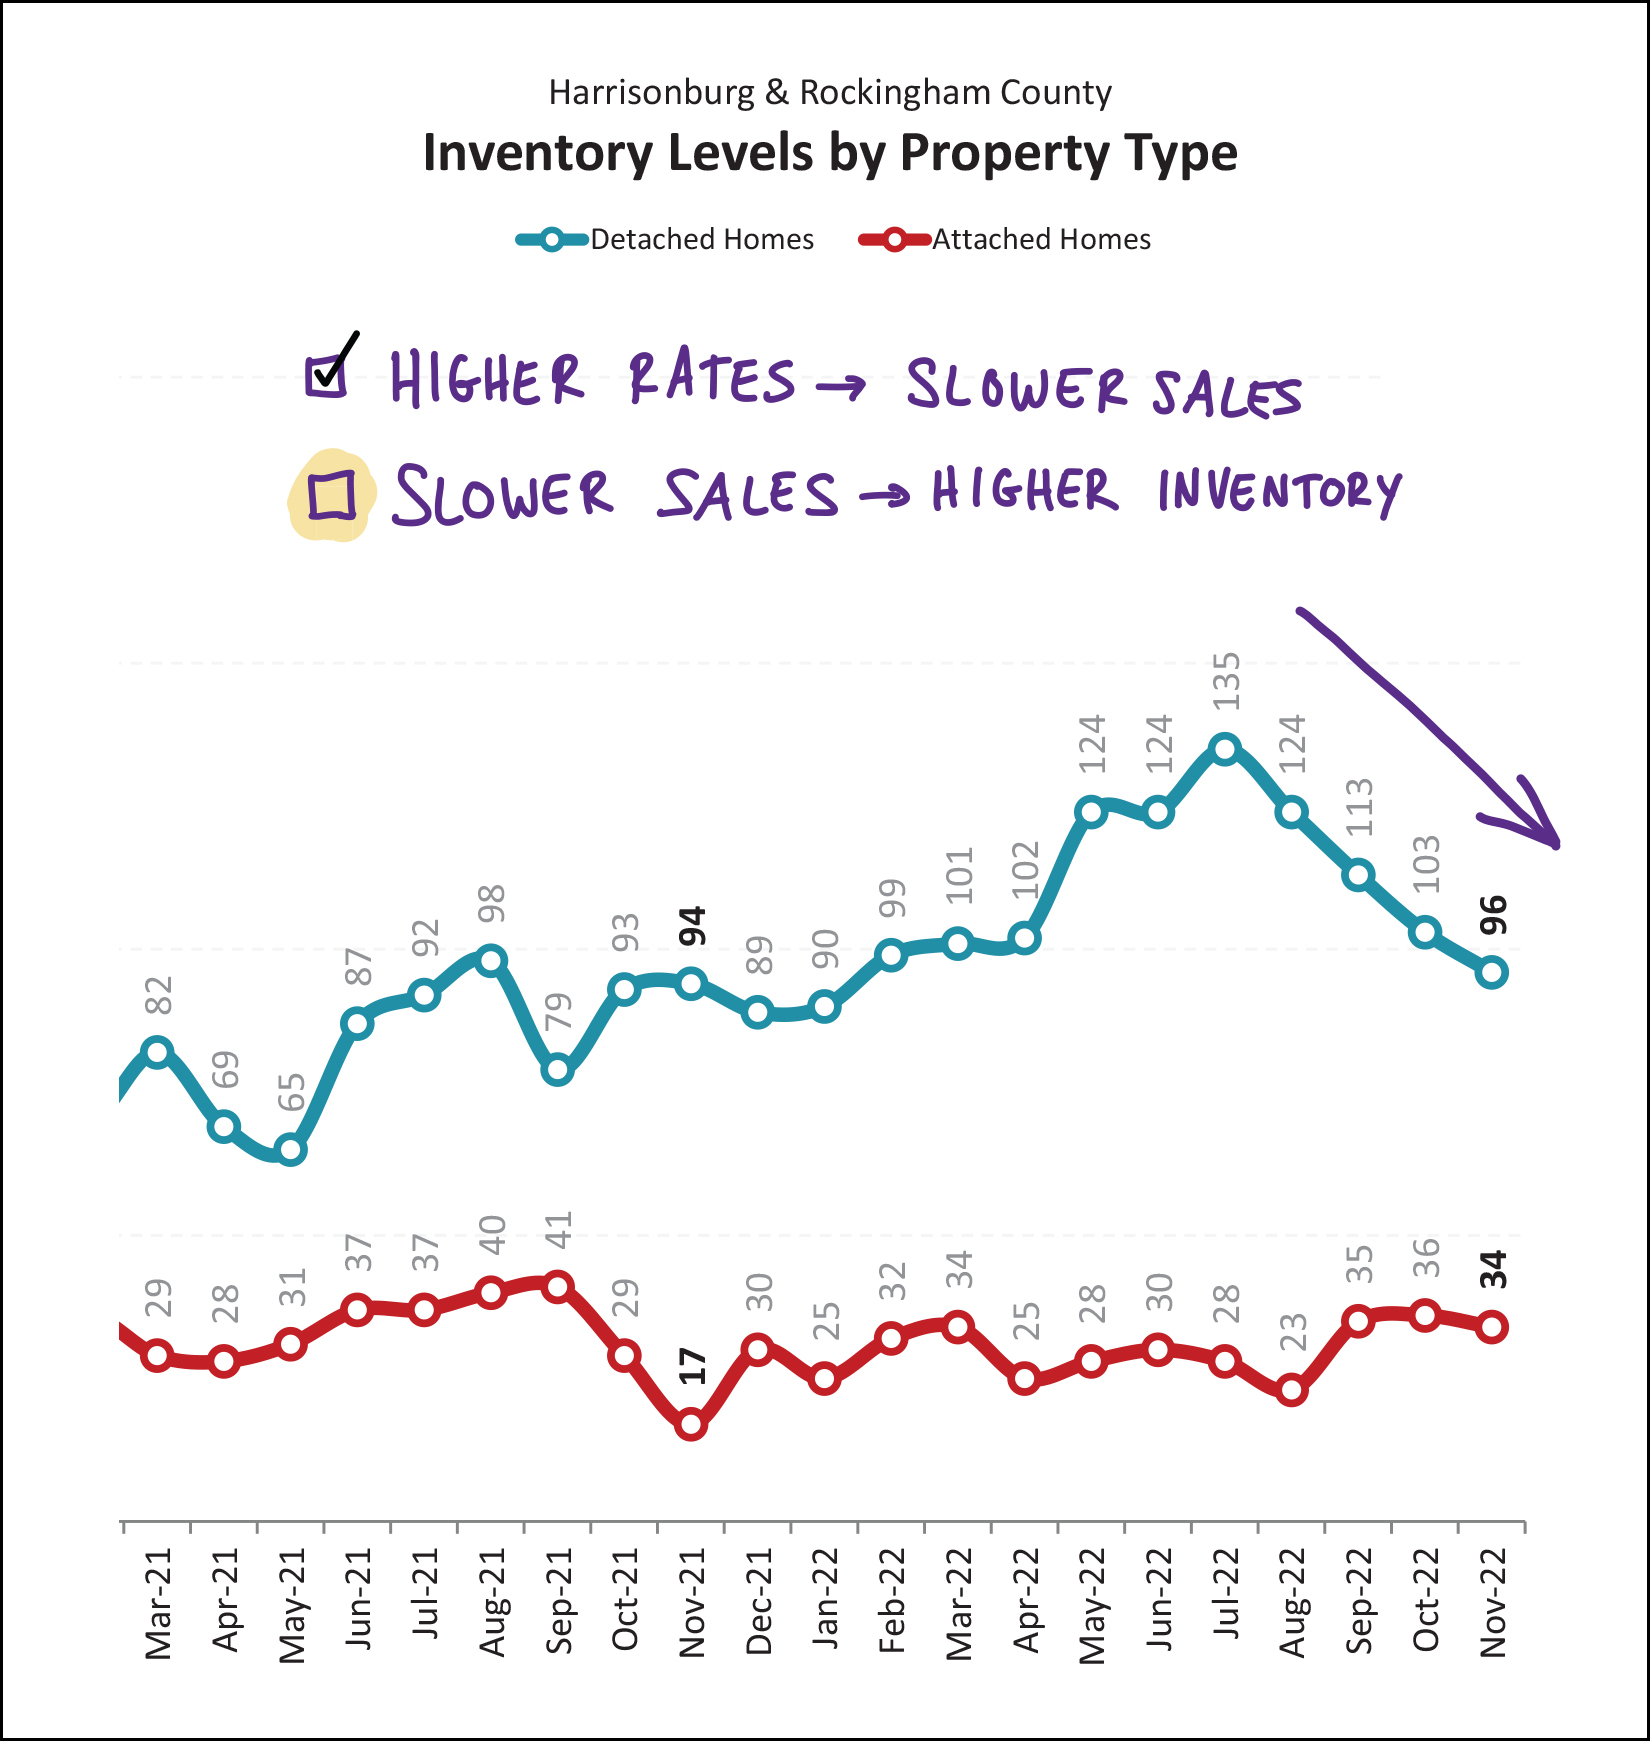
The graph above shows inventory levels by property type. Inventory levels of attached homes (townhomes, duplexes, condos) have stayed relatively consistently between 25 and 40 over the past year and a half. Inventory levels of detached homes were rising between June 2021 and June 2022... but then have declined for the past four months.
So, as my notes point out... higher mortgage interest rates did indeed lead to slower sales... but slower sales are not necessarily leading to higher inventory levels. Come spring, we may have new insights as to a potential new trajectory of the market if more sellers want to sell and this lower number of buyers are willing to buy.
This next graph has become a bit more complex since I last referenced it...
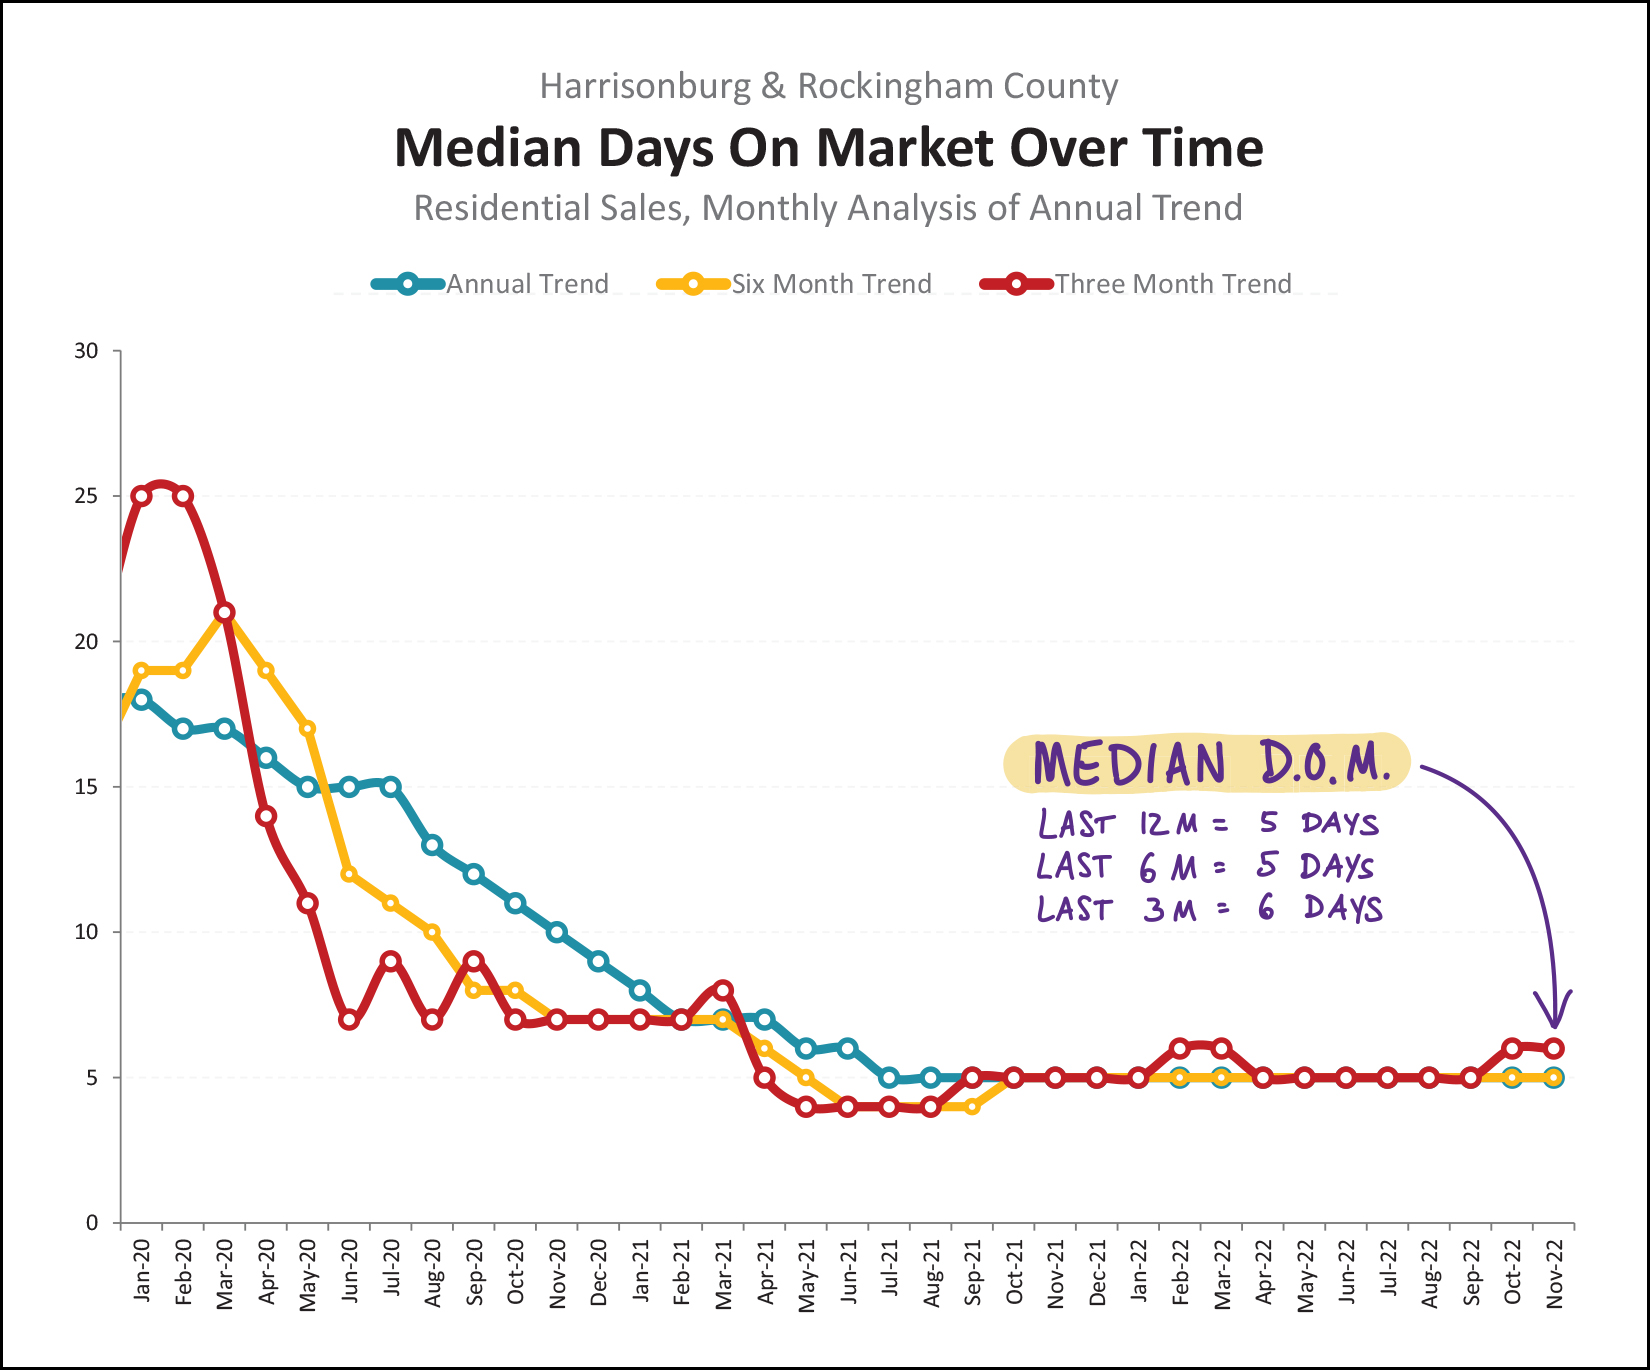
First, conceptually, the timeframe in which homes are going under contract (days on market) is often an excellent indicator of the tone of the local market. As such, for some time I have been tracking the "median days on market" for homes that are selling in Harrisonburg and Rockingham County. The annual median days on market (blue line above) fell to five days (!) back in July 2021 and has remained at that level ever since.
As the market has started to feel like it might be transitioning, or as we have though that maybe the market would have to be transitioning, several of you insightful and intelligent readers have asked if this "median days on market" trend looks different if we weren't looking at an entire year of data at a time. Basically asking the question... well, if the median days on market is five days over the past year... certainly it must be (might be?) higher if we looked only at the last few months, right?
The new lines on this graph above address this inquiry. The gold/yellow line evaluates median days on market in a six month timeframe... and the red line shows this same metric in a three month timeframe.
All that to say... even if we narrow our scope all the way down to the past three months... the median days on market has only risen to... six days instead of five. Half (or more) of the homes that have sold in the past three months were under contract within six days of being listed for sale.
If (when?) the market transitions further, we will likely start to see this metric (median days on market) start to trend higher... but we're not seeing it yet.
One of the main market impacting factors that I mentioned multiple times throughout this report is the change in mortgage interest rates over the past year...
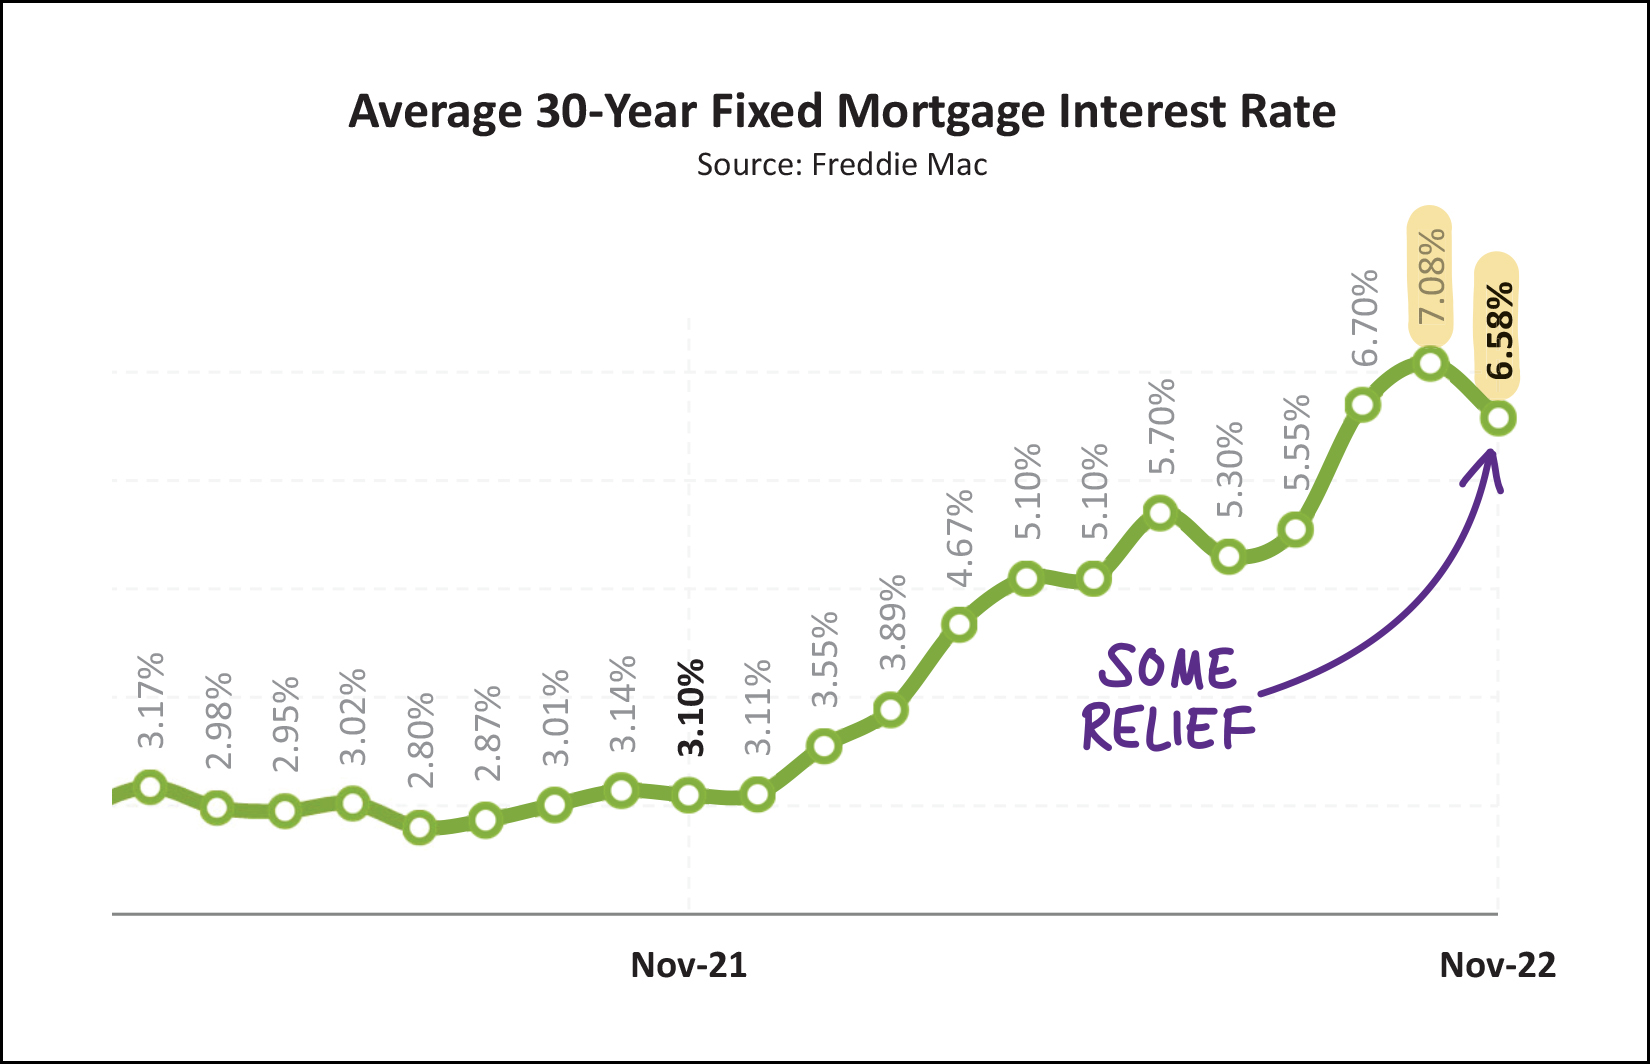
A year ago buyers enjoyed mortgage interest rates right around 3%. Today... rates are twice as high... with an average rate of 6.58% for a 30 year fixed mortgage interest rate as of the end of November. Rates have actually trended down a bit further since that time... with a current average of 6.33% that is not yet shown on the graph above.
Will significantly higher mortgage interest rates cause some buyers to not be able to buy? Yes. Will significantly higher mortgage interest rates cause some buyers to not want to buy? Yes. Will significantly higher mortgage interest rates cause a significant (10% or more?) decline in the number of buyers buying homes in our local housing market? Thus far, it seems not.
And there you have it... the latest trends in our local housing market as we roll into the last two(ish) weeks of 2022.
[1] We're starting to see fewer home sales... though the "fewer" is compared to a "higher" time that we might later conclude was well outside the norm for our local market.
[2] We're still seeing higher and higher sales prices in our local market despite (non-cash) buyers financing their home purchase at some of the highest mortgage interest rates we've seen in over 10 years.
[3] Despite slightly less buyer activity, inventory levels are remaining stable and may be starting to return to historical seasonal trends of fewer homes on the market in the winter and inventory levels rising again in the spring and summer.
As we near the end of 2022, some of you may be considering the sale of your home (or the purchase of a new one) in 2023. If so, we should start chatting sooner rather than later about how all of these market trends potentially impact your plans and the timing of those plans. Feel free to reach out to start that conversation by emailing me or texting or calling me at 540-578-0102.
I'll provide another update after the first of the year. Until then, I hope you enjoy the remainder of what is one of my favorite months of the year. December includes Shaena's and my anniversary, Shaena's birthday, and Christmas! Celebrations all month long. ;-)
I hope you have an enjoyable, peaceful, fulfilling remainder of 2022 -- and that you find opportunities to spend time with the people you love during this holiday season!
