Brought to you by Scott P. Rogers, Funkhouser Real Estate Group, 540-578-0102, scott@HarrisonburgHousingToday.com
Brought to you by Scott P. Rogers, Funkhouser Real Estate Group, 540-578-0102, scott@HarrisonburgHousingToday.com
Friday, July 14, 2023
Happy Friday Morning, Friends!
As per the headline above, far fewer homes are selling this year, but sales prices keep rising. But before we dive into it...
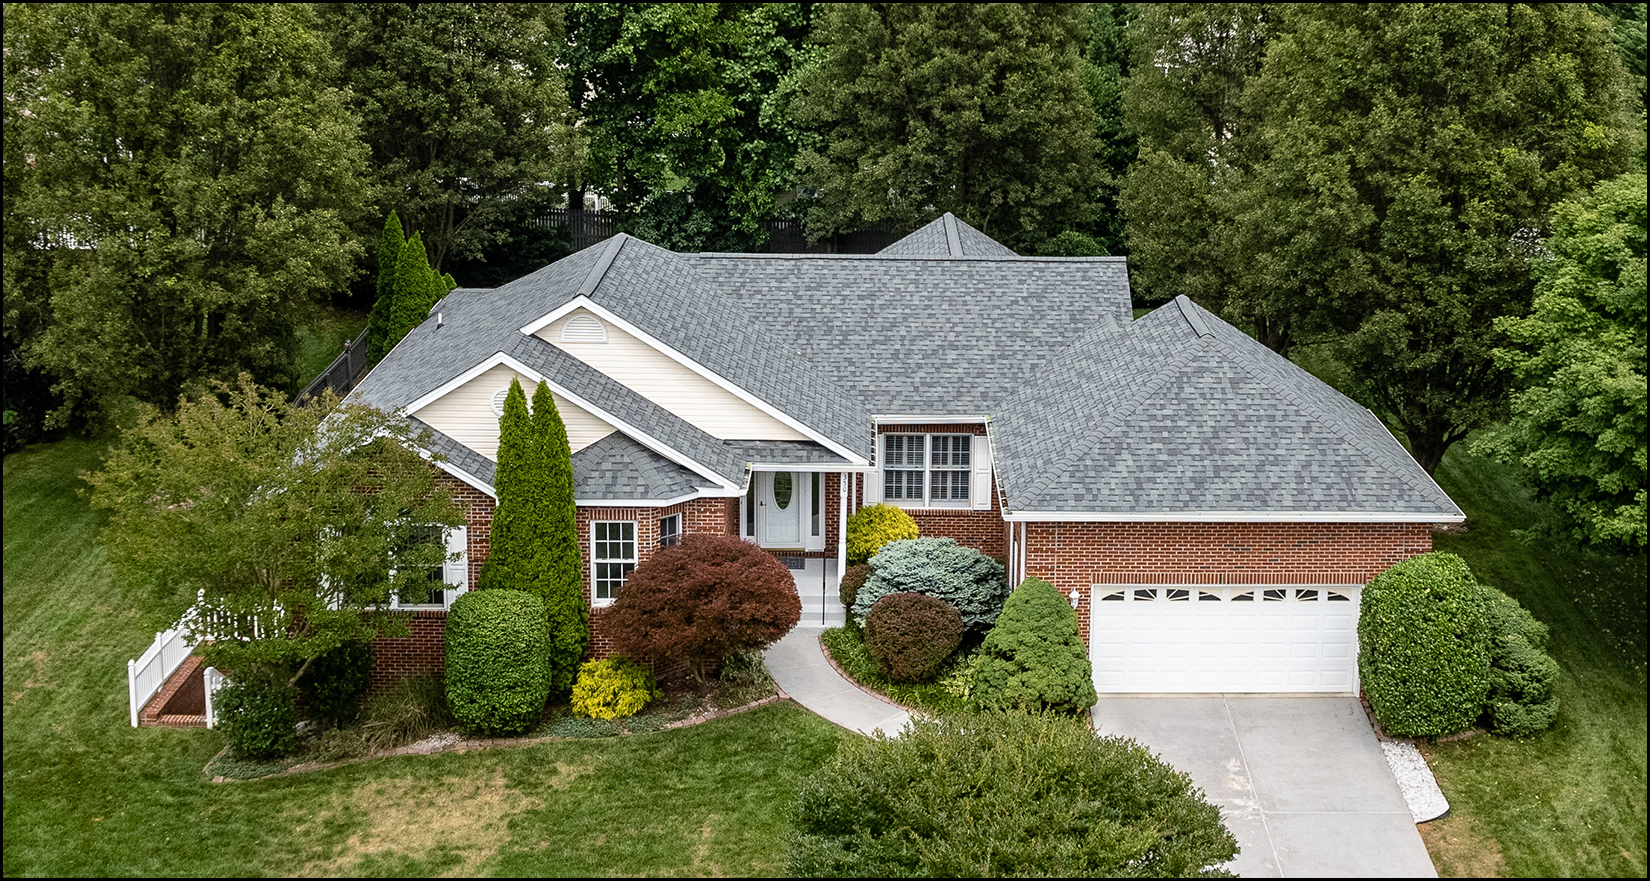
First, if you're looking for a spacious four bedroom home in a neighborhood in the Spotswood High School district, be sure to check out 350 Confederacy Drive...
This beautiful, well maintained house in Battlefield Estates has had many updates over the past few years and is currently listed for sale. Find out more at 350ConfederacyDrive.com.
Second, I hope you have had a fun first half to your summer. The weeks are flying by and before you know it, we'll be thinking about and planning for the coming school year. I was out of town for a few days last week for some fun on the water...

I have always loved water skiing but in recent years I have become the boat driver so it was great to have Luke drive this year so I could ski again. It was a fun and relaxing time away with family, and I hope you find time to have fun this summer as well... whether at the lake, at the beach, or right here in the beautiful Shenandoah Valley.
Third, and finally before we get to the market data, each month I offer a giveaway, of sorts, for readers of this market report, highlighting some of my favorite places, things or events in Harrisonburg. Recent highlights have included Red Wing Roots tickets, The Little Grill, and Cuban Burger.
This month I am giving away a $50 gift certificate to Jimmy Madison's... located in downtown Harrisonburg. If you find me at Jimmy Madison's, I'll be enjoying one of many favorite items from their fantastic menu... but always with a side of their delicious Jimmy Sprouts -- Caramelized Brussels Sprouts with sweet pecans, candied bacon and honey thyme vinaigrette. I'm getting hungry just talking about them! Click here to enter to win the $50 gift certificate to Jimmy Madison's.
Now, on to the data...
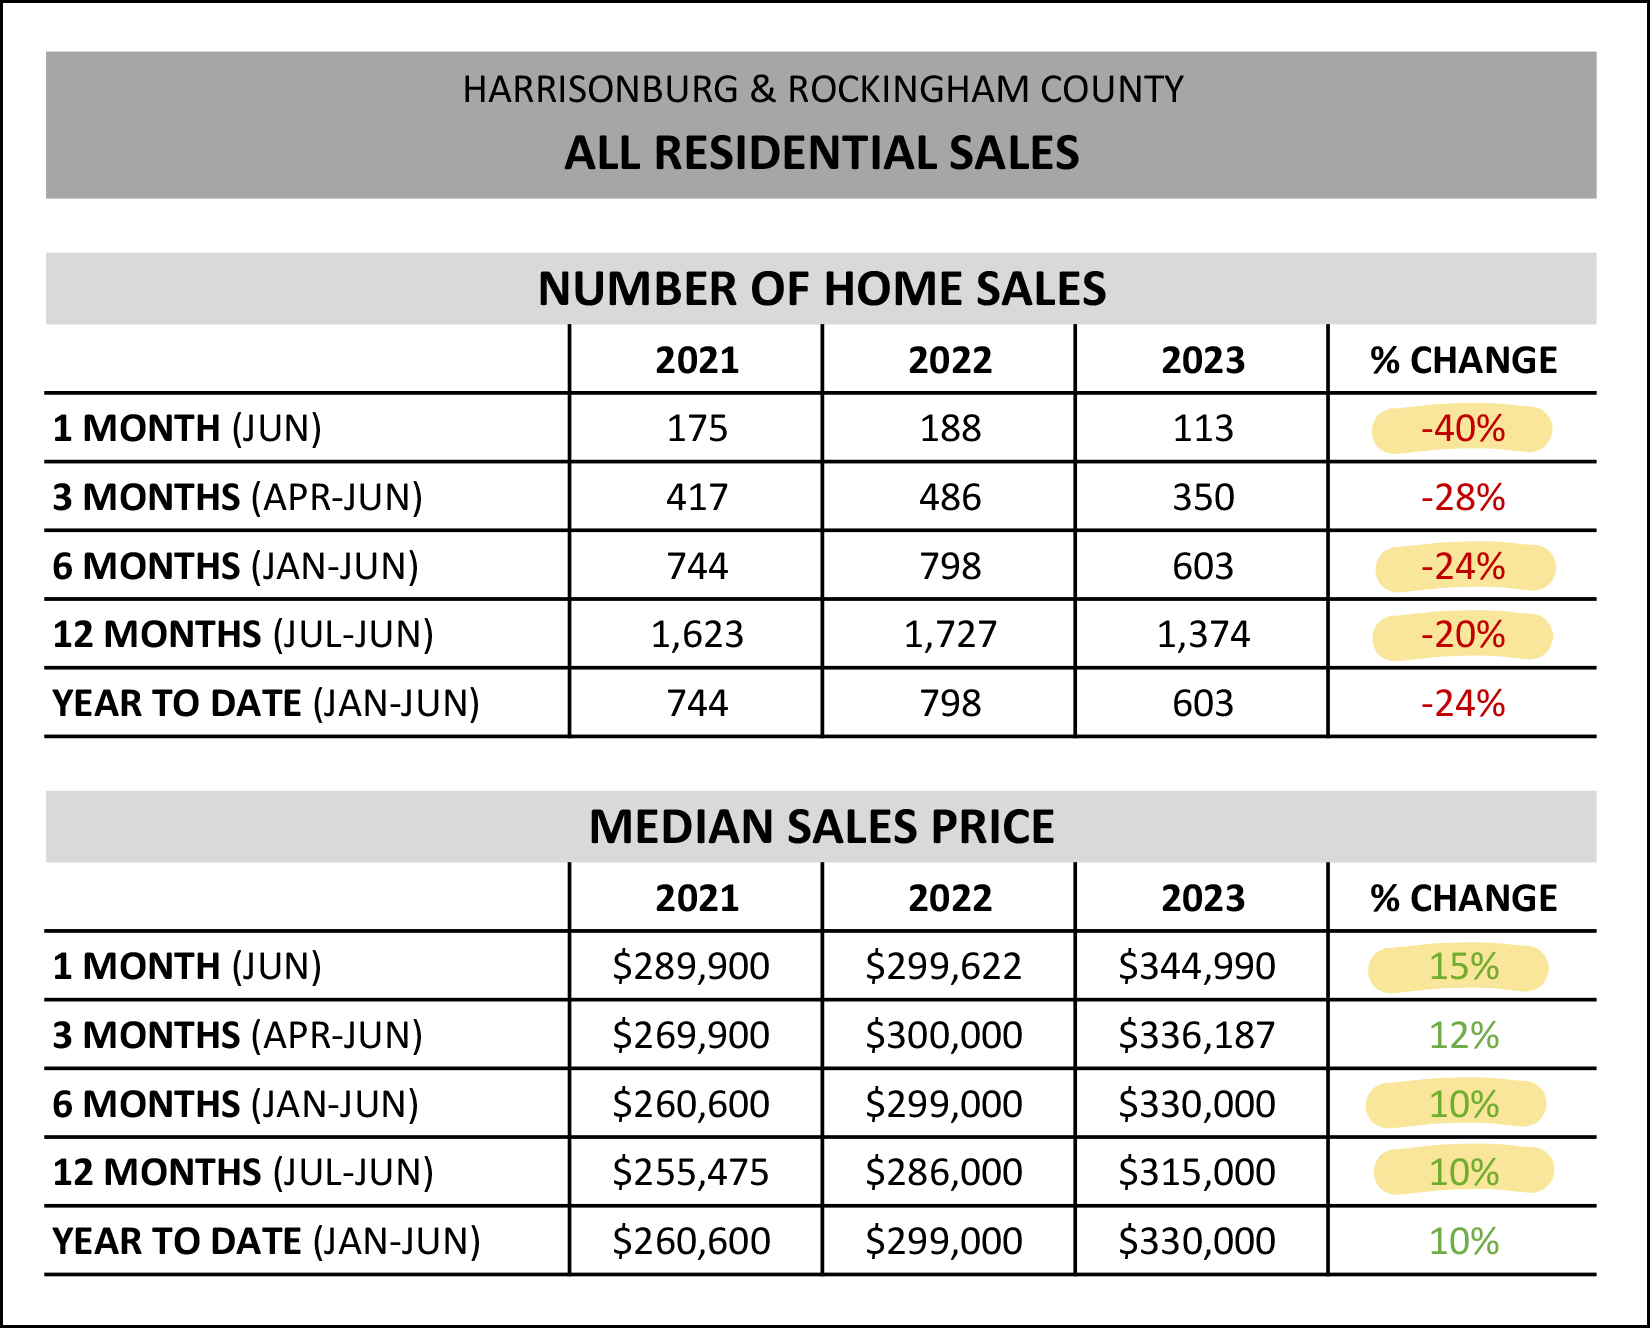
As shown above...
[1] There were only 113 home sales in June 2023, which was a 40% decline from last June. We'll see this visually in a graph in a bit.
[2] We've seen 603 home sales in the first half of the year which is a 24% decline from the first half of last year. This is the "far fewer homes are selling" part of my market report.
[3] If we stretch back a full year (12 months) we will find 1,374 home sales -- a 20% decline from the 1,727 home sales seen in the 12 months before that. So, regardless of how you slice or dice the data, fewer homes are selling in Harrisonburg and Rockingham County this year than last. But...
[4] The median sales price in June 2023 ($344,990) was 15% higher than last year when it was $299,622.
[5] The median sales price in the first half of 2023 ($330,000) was 10% higher than the first half of 2022 when it was $299,000.
[6] The median sales price over the past 12 months ($315,000) was 10% higher than in the in the 12 months before that when it was $286,000. As such, regardless of how you look at it, the median sales price is still on the rise in Harrisonburg and Rockingham County, despite far fewer homes selling.
Here's a visual of the drop off in the number of homes selling...
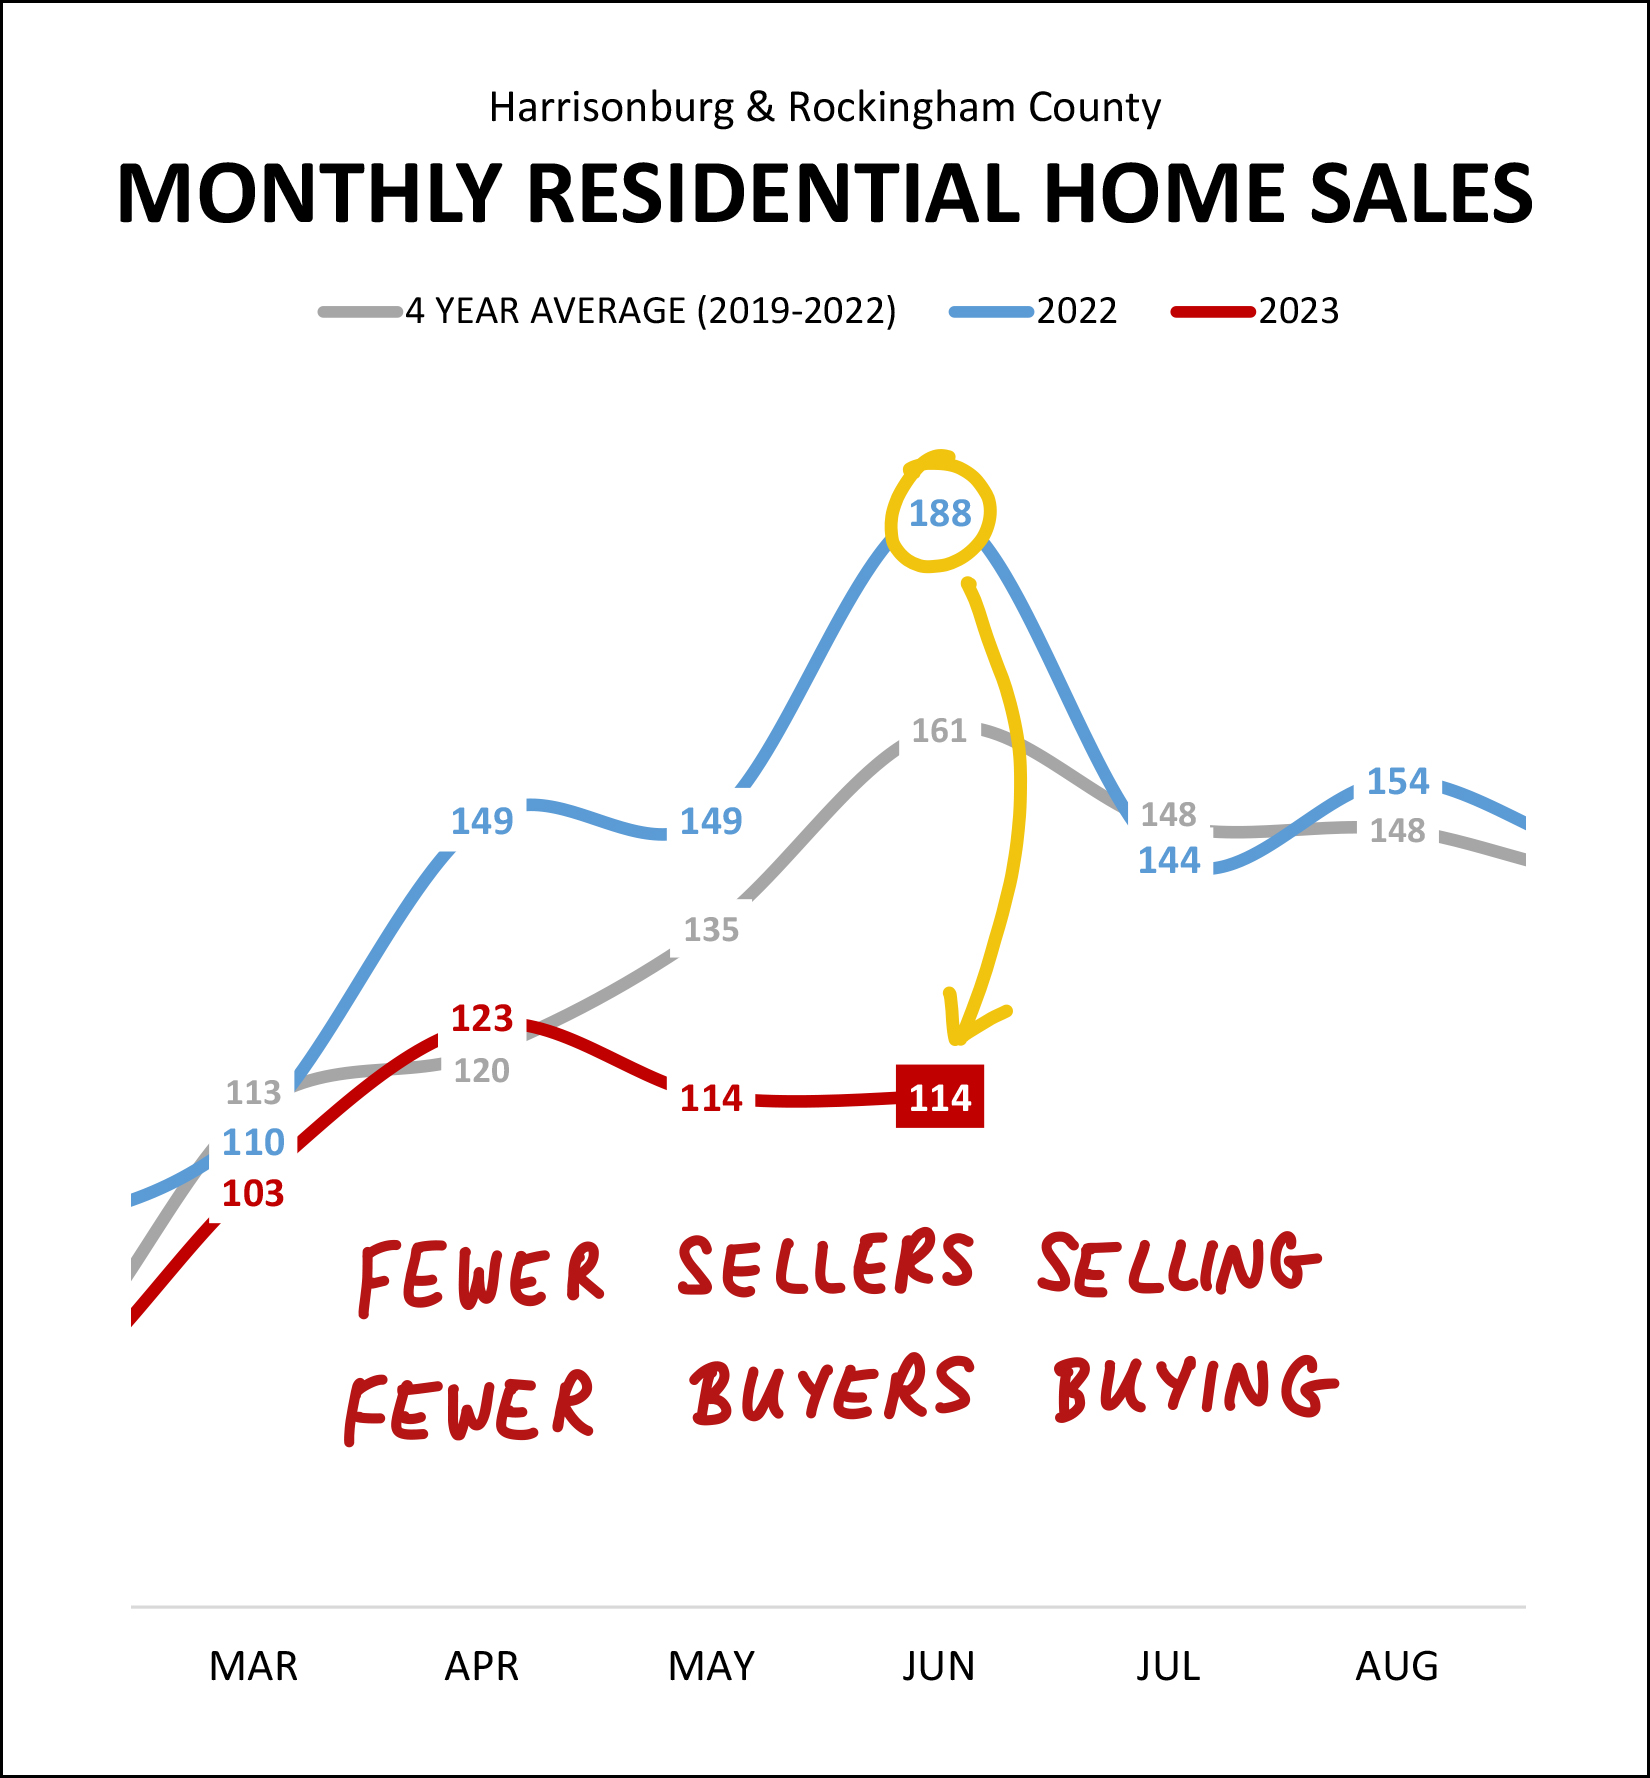
The blue line above shows the number of homes selling per month last year -- compared to the red line which shows this year's home sales. As is quite evident, the number of homes selling has been far lower this year than last, particularly over the past few months -- April, May and June.
The grey line above shows the average number of home sales per month based on the past four years (2019-2022) of data. When looking at all three lines together it becomes clear that home sales last year were significantly above historical averages and home sales this year are now (particularly in May and June) significantly below historical averages.
As I'll continue to discuss throughout this report... this decline in the number of homes selling is (perhaps obviously) both a result of fewer sellers selling and fewer buyers buying. We need both a seller and a buyer for a home sale to take place. As we'll see in later graphs, inventory levels remain low -- so it seems likely that the main constraint on home sales is the number of sellers selling... not a limit on the number of buyers who would like to buy. But before we get to inventory levels, let's look at a slightly longer historical perspective...
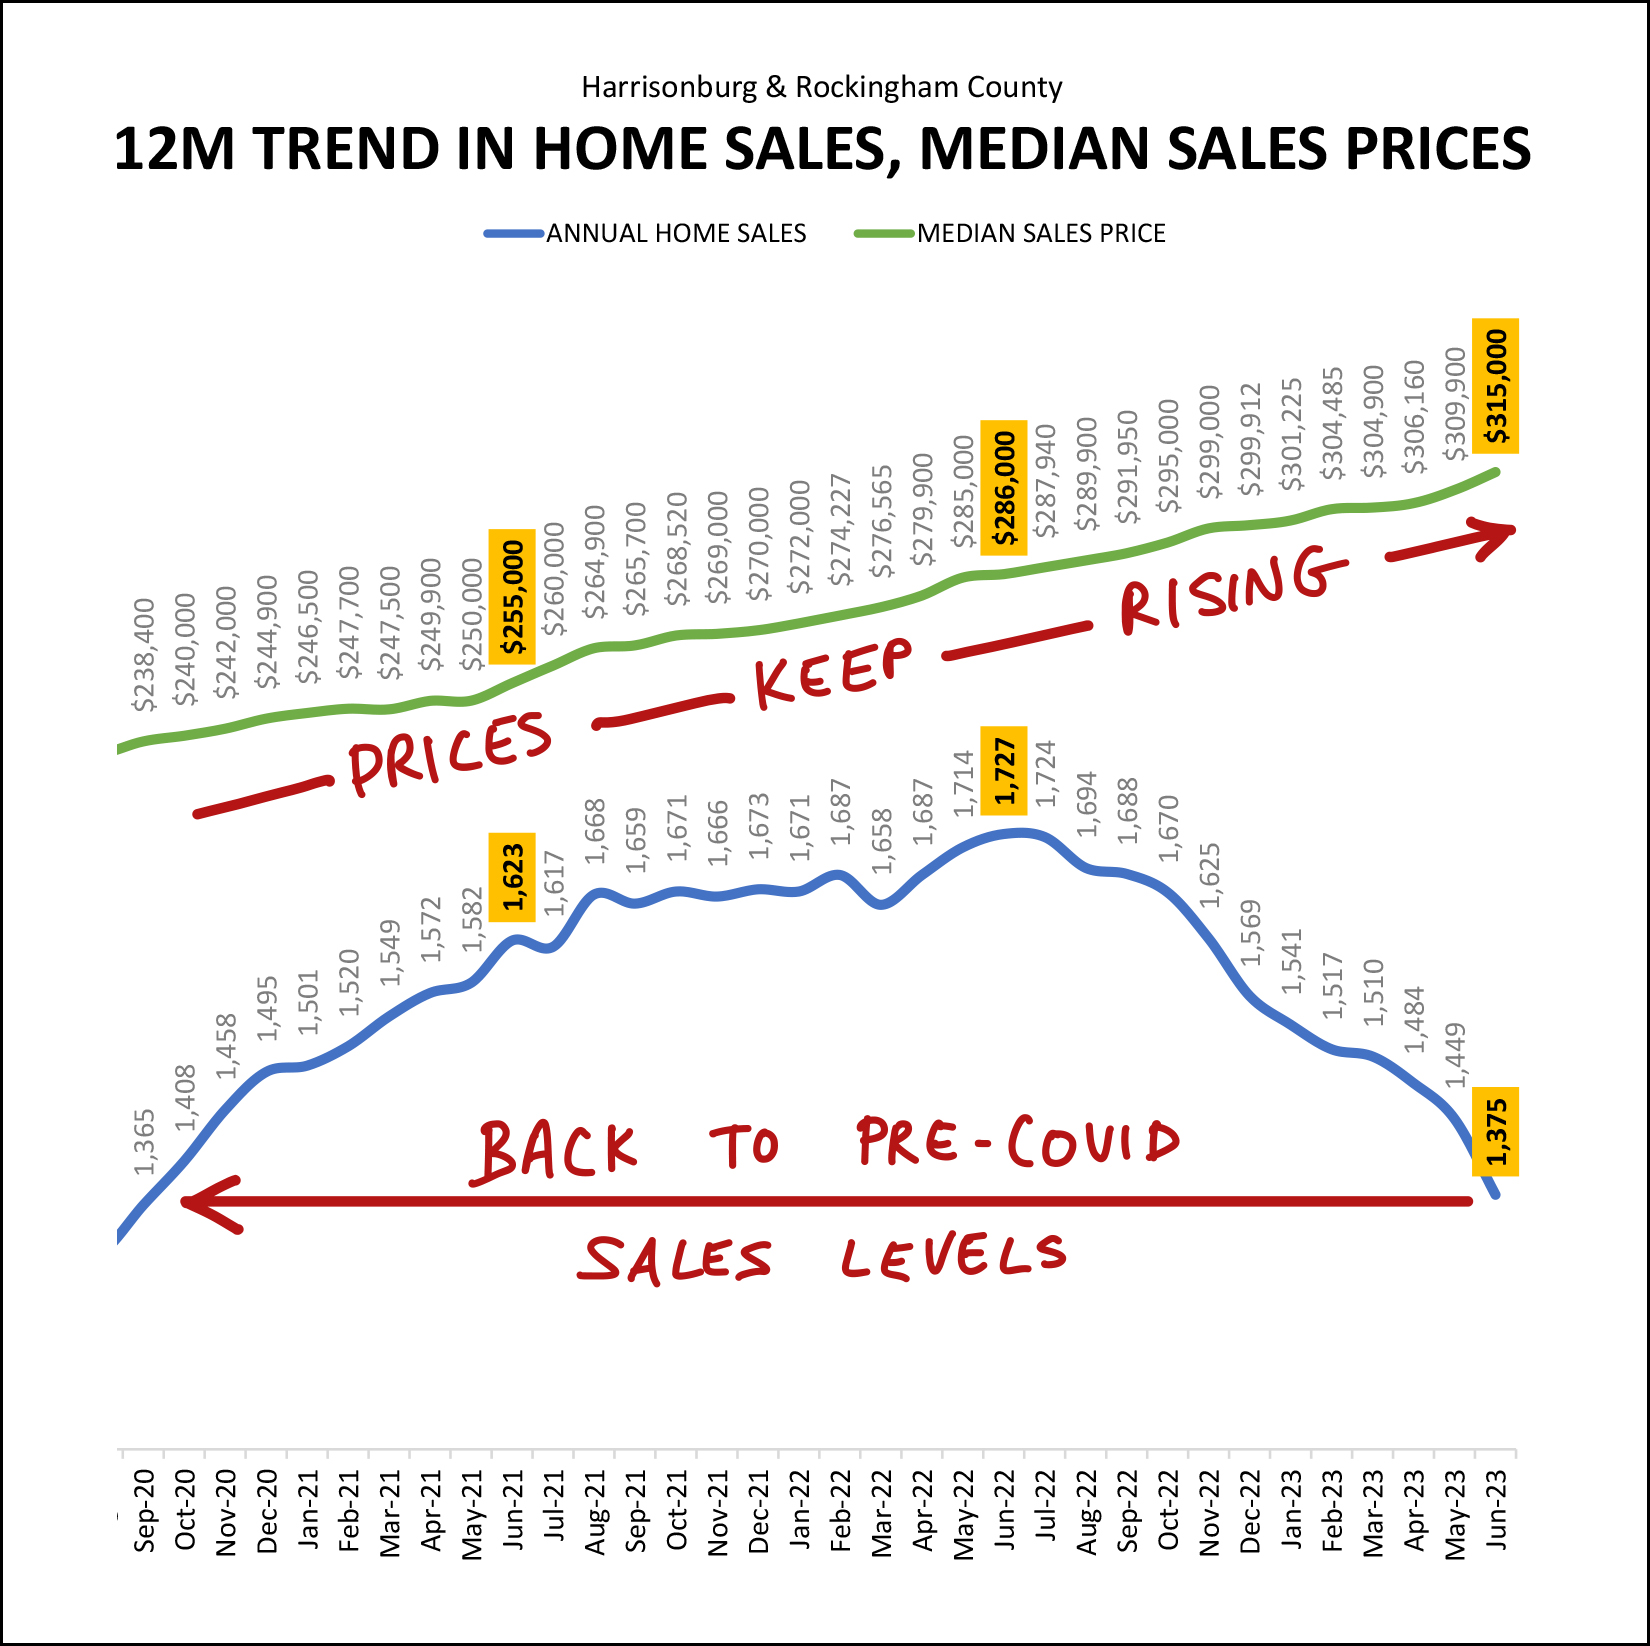
The blue line above shows the number of home sales per year, updated each month. This snapshot looks back to late 2020 (in the thick of Covid) when home sales were surging upwards, from 1,365 annual sales all the way up to 1,727 annual sales. But over the past year we have seen annual sales steadily drop... all the way back down to 1,375 sales per year... about the same place as where we were in the early months of the pandemic. If the pandemic (and low mortgage interest rates, and lots of people working from home) drove the number of annual home sales up over the course of two years... it was immediately followed by much higher mortgage interest rates driving the number of annual home sales down over the course of the most recent year.
When the number of home sales in our market was surging in 2020, 2021 and 2022 it certainly made sense that home prices were rising steadily, as shown in the green line above. But over the past year, even as the number of homes selling has declined, and even with higher mortgage interest rates, we have continued to see home prices keep on rising. This (ever higher prices) is an indication (along with continued low inventory levels) that the limitation of the number of homes selling is almost certainly primarily a supply side issue -- not enough sellers being willing to sell.
To put rising home prices in context... take a look at this change in the median sales price in our local market over the past four years...
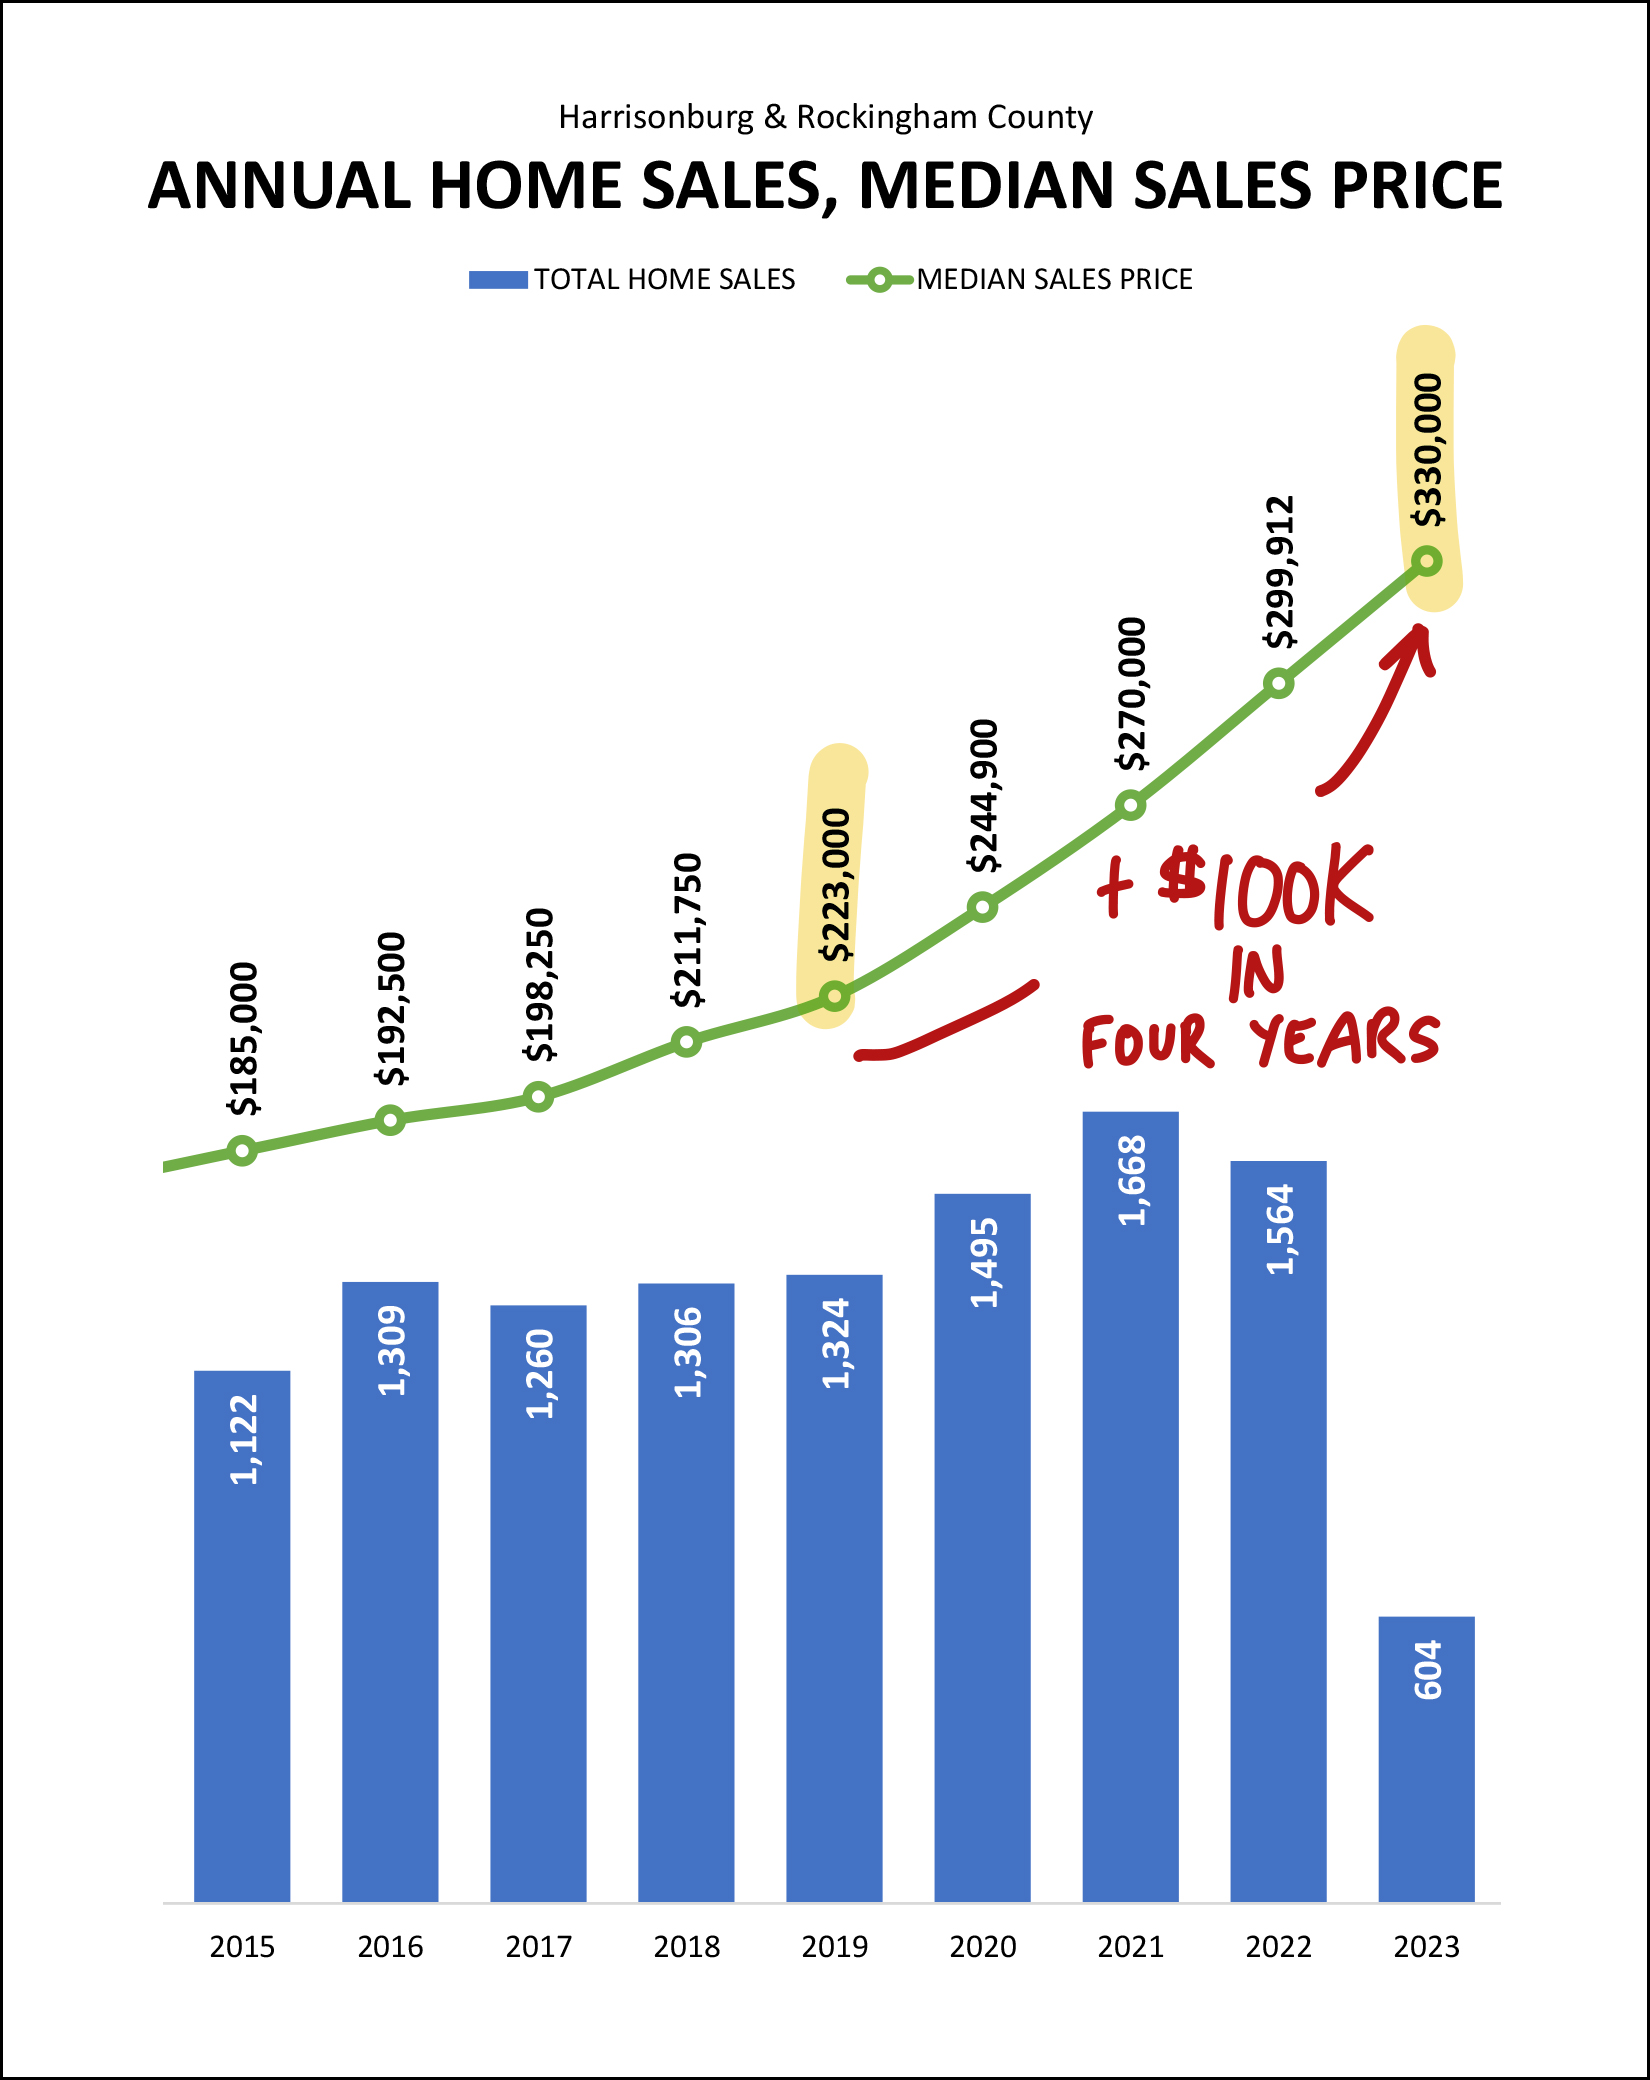
The median sales price in Harrisonburg and Rockingham County has increased by more than $100,000 over the past four years. Wow! Four years ago your purchase of a median priced home would have had you spending $223,000 -- and today you'd be spending $330,000. This is certainly wonderful news if you have owned a home over the past four years -- or if you bought a home four years ago -- and less exciting news if you do not own a home and/or have been trying to buy a home for any or all of the past four years.
It is important to note that these figures are not adjusted for inflation. I'll take a look at that separately, hopefully soon, as we have seen significant changes in what a dollar buys you over the past few years -- not just with houses, but across the majority of the economy.
As should come as no surprise, the precursor to fewer home sales is... fewer contracts being signed...
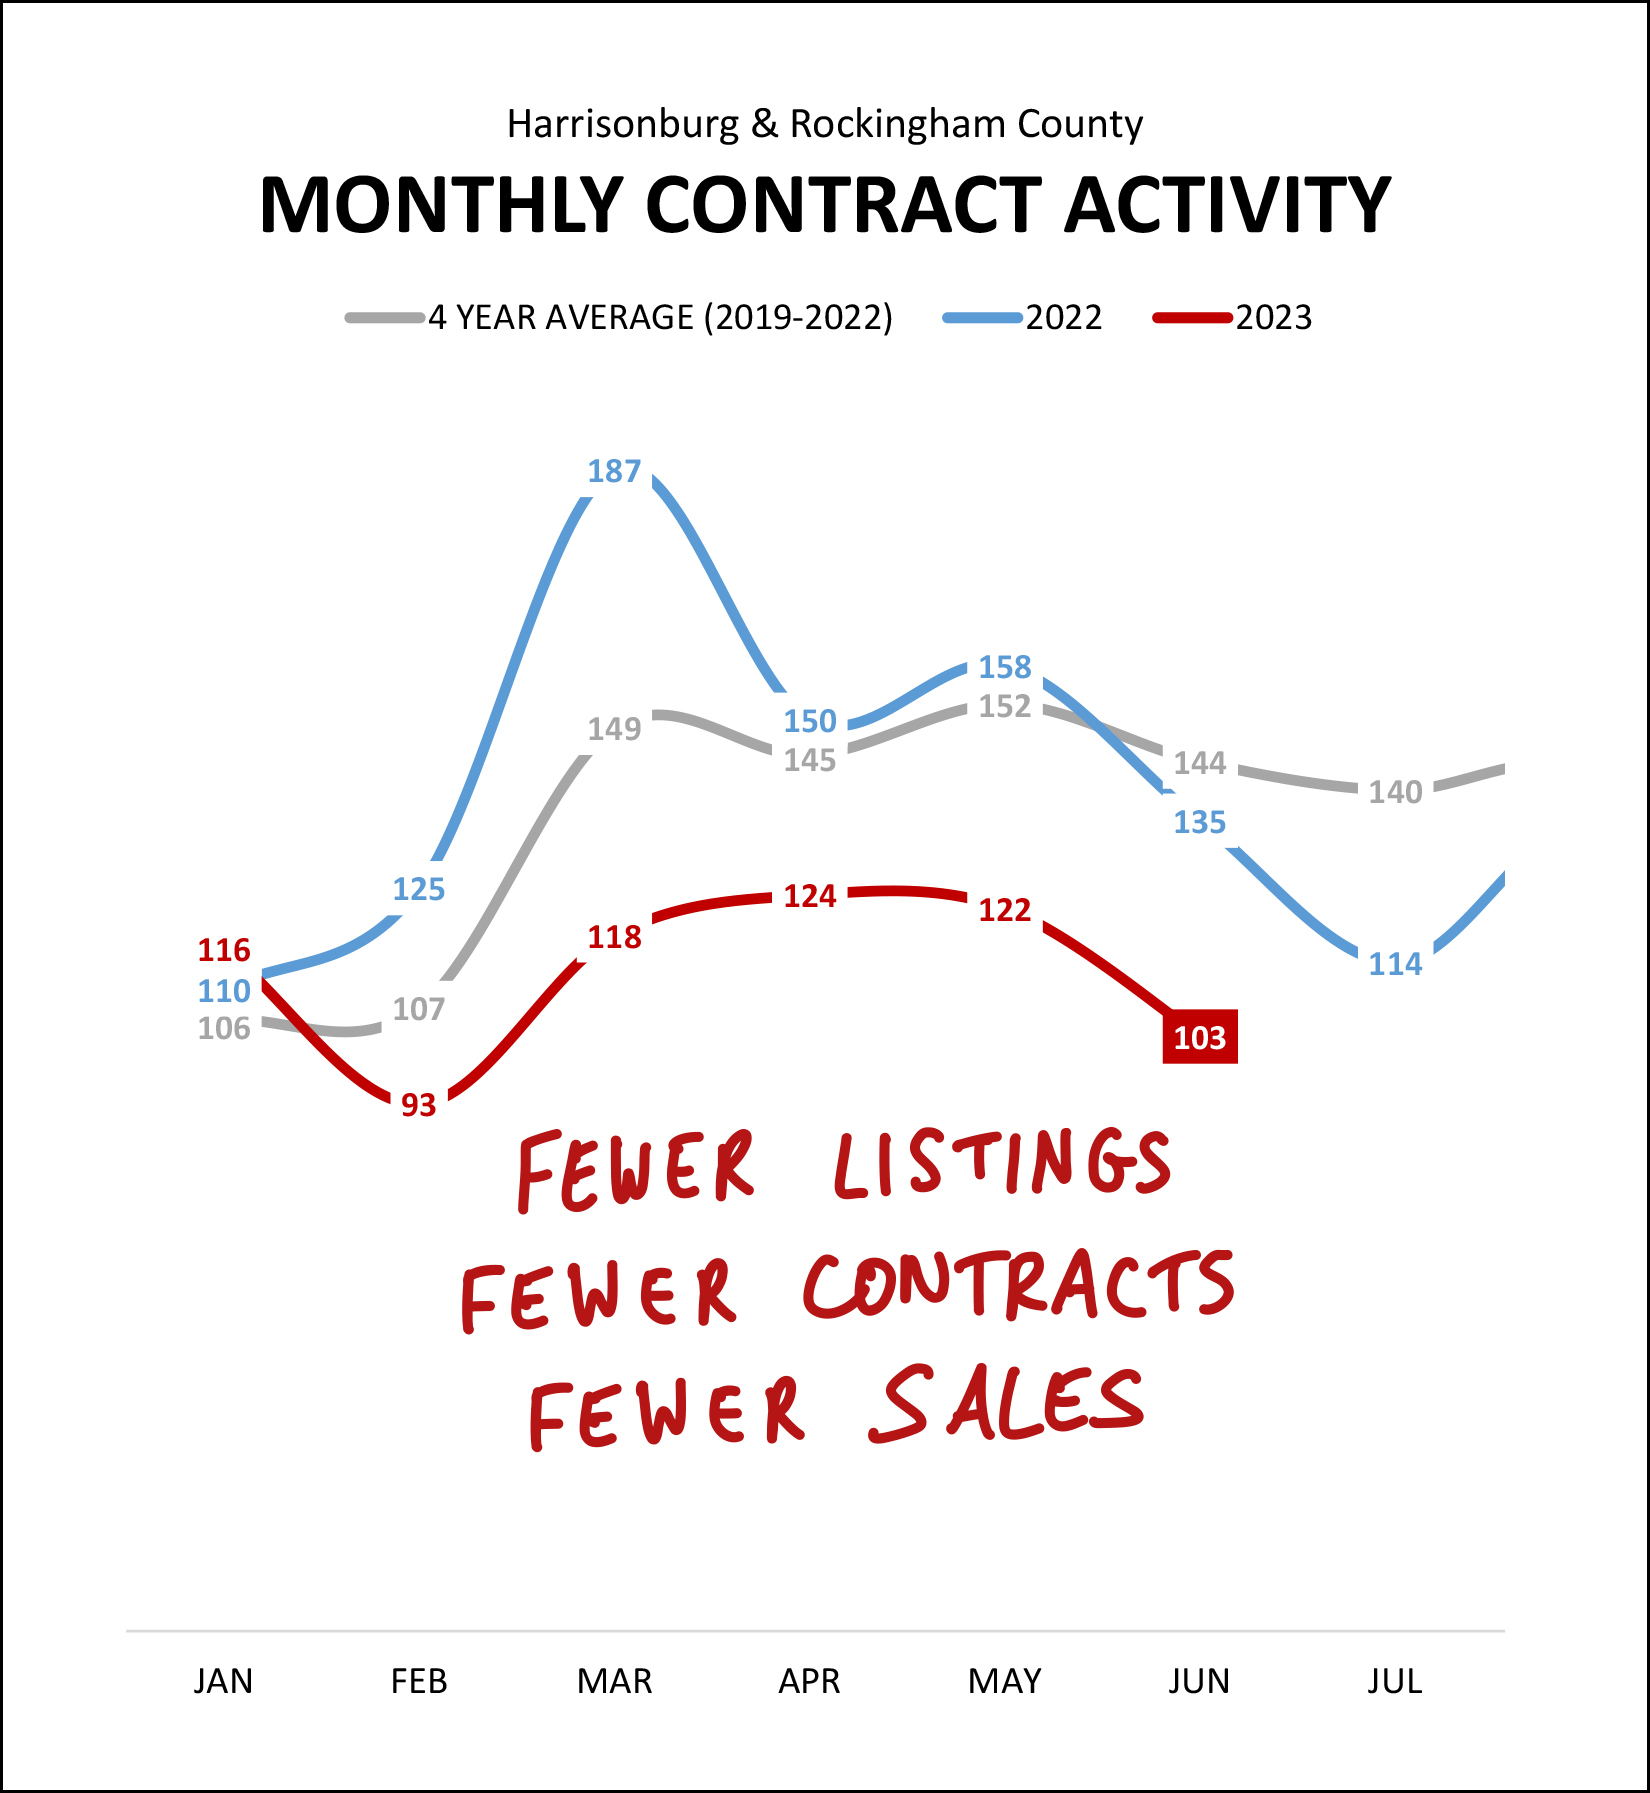
As to the point I made earlier, the blue line above (last year's monthly contracts) was certainly above the historical average (grey line) but this year's trajectory of monthly contracts (red line) is well (well!) below historical averages. Looking ahead to home sales for the rest of the summer and into fall, we are likely to see continued to declines in home sales based on continued low levels of contracts being signed.
As mentioned previously, one of the main reasons why we are seeing fewer home selling... is because there are fewer sellers selling...
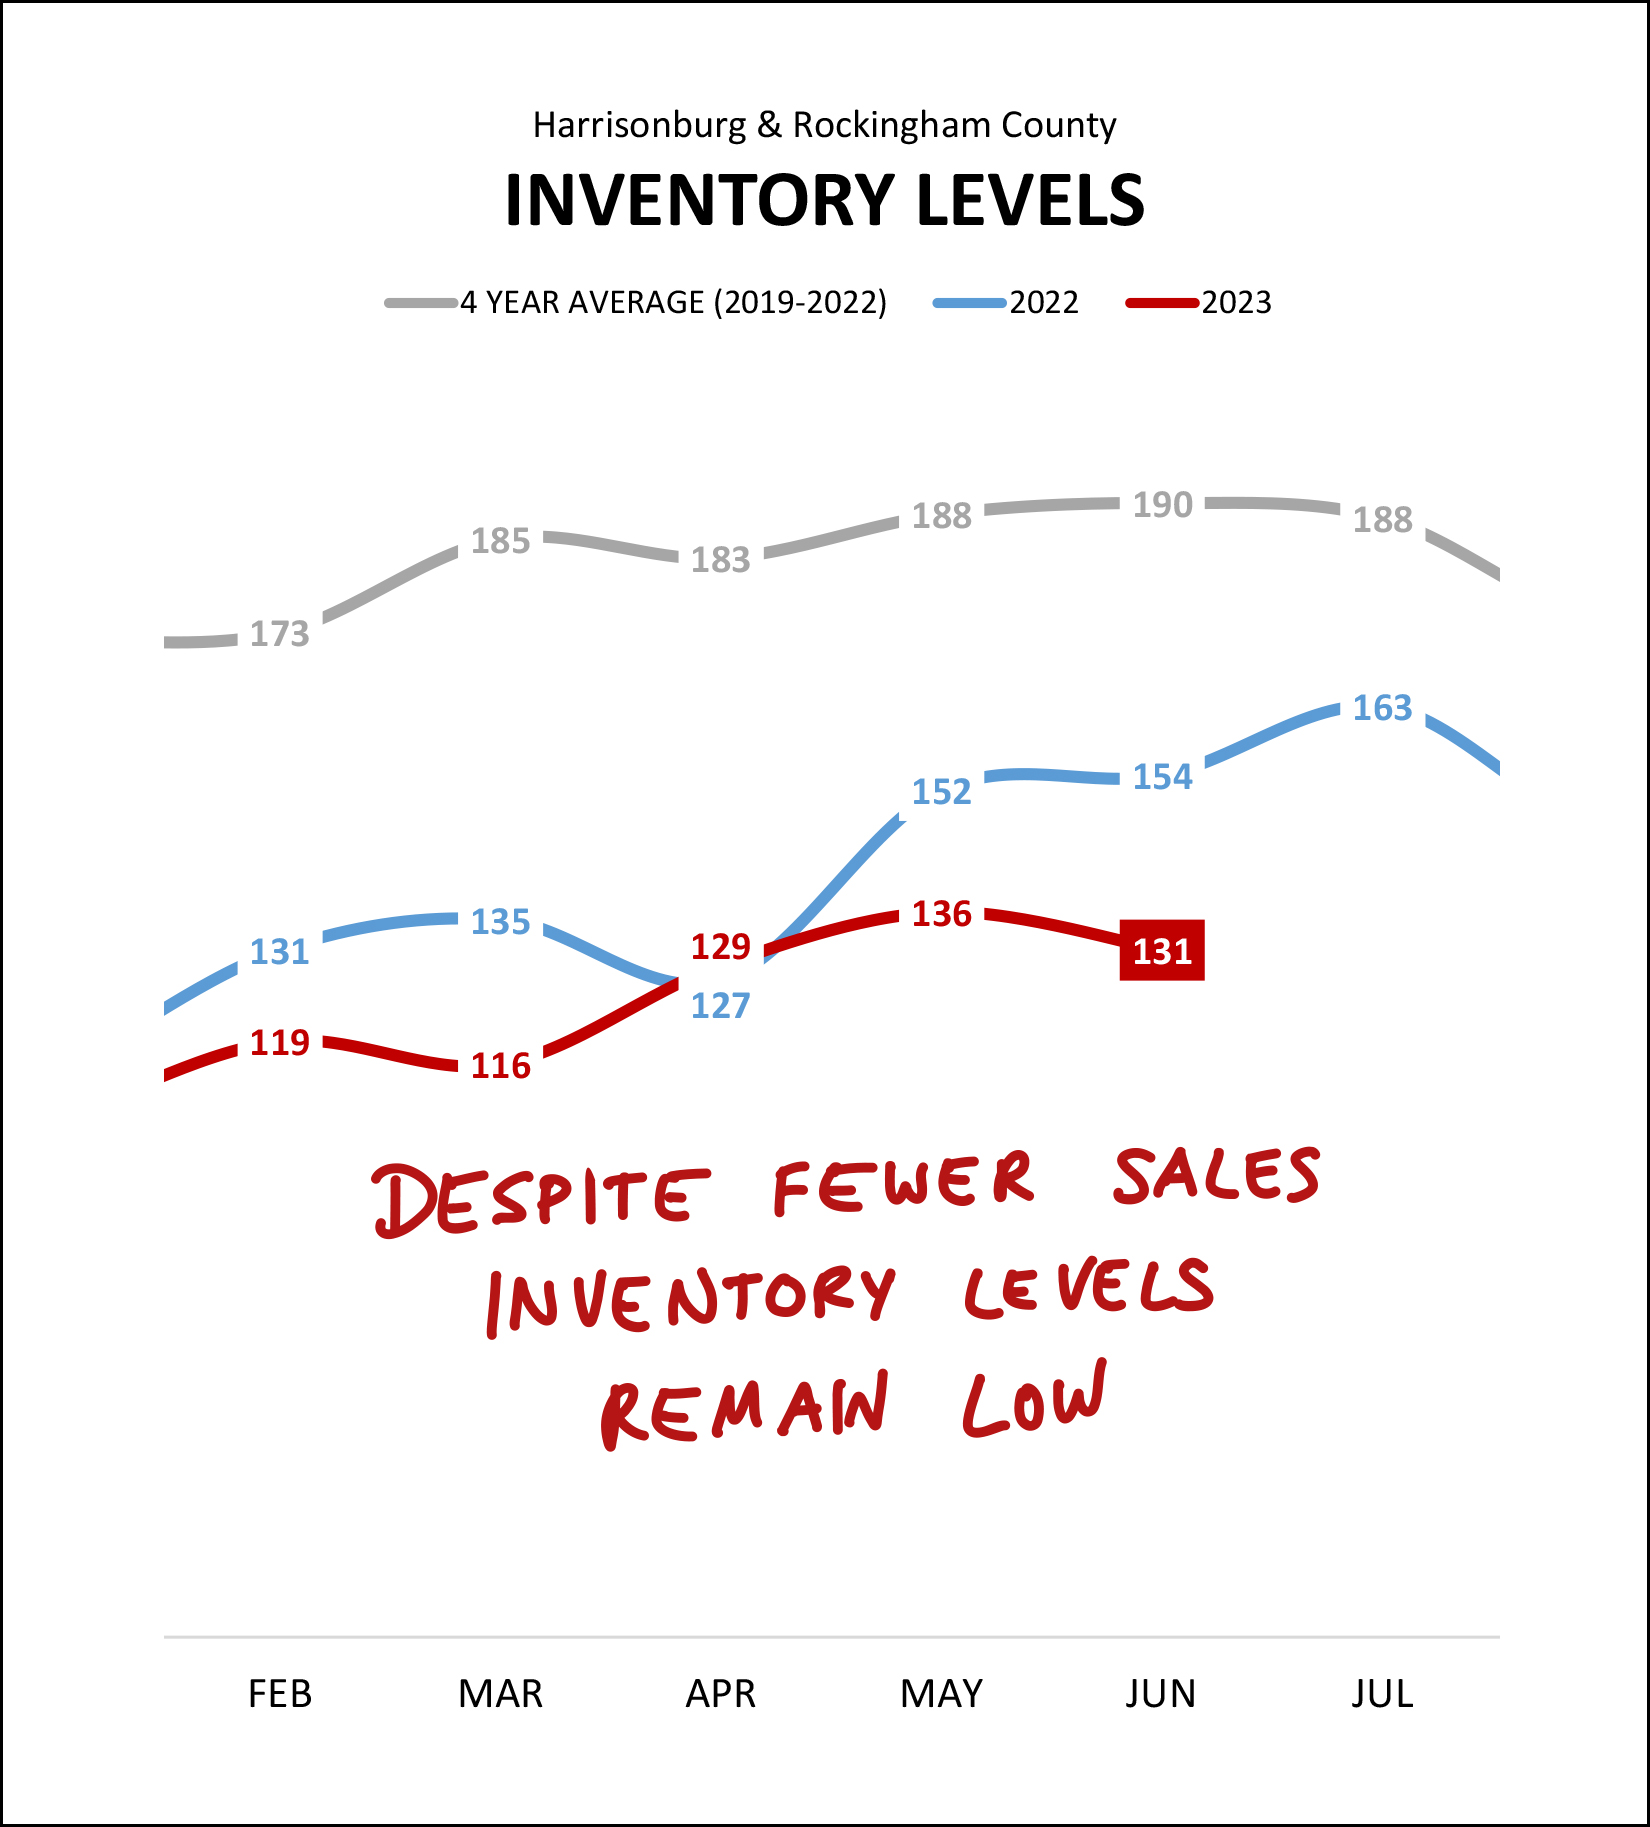
Over the past four years (grey line above) we have seen an average of 180 to 190 homes for sale as we have rolled through March, April, May and June. This year (red line above) we have seen between 116 and 136 homes for sale during those same months. Inventory levels are remaining low despite far fewer home sales. This is the data point (alongside continued increases in the median sales price) that seems to rather clearly confirm that the decline in home sales is almost entirely related to fewer sellers selling -- and not fewer buyers wanting to buy. Across many (though not all) price ranges and property types, home buyers keep snatching up most new listings that come on the market -- which is keeping inventory levels quite low.
How quickly are those new listings getting snatched up, you might ask? That is most readily measured via the "days on market" metric...
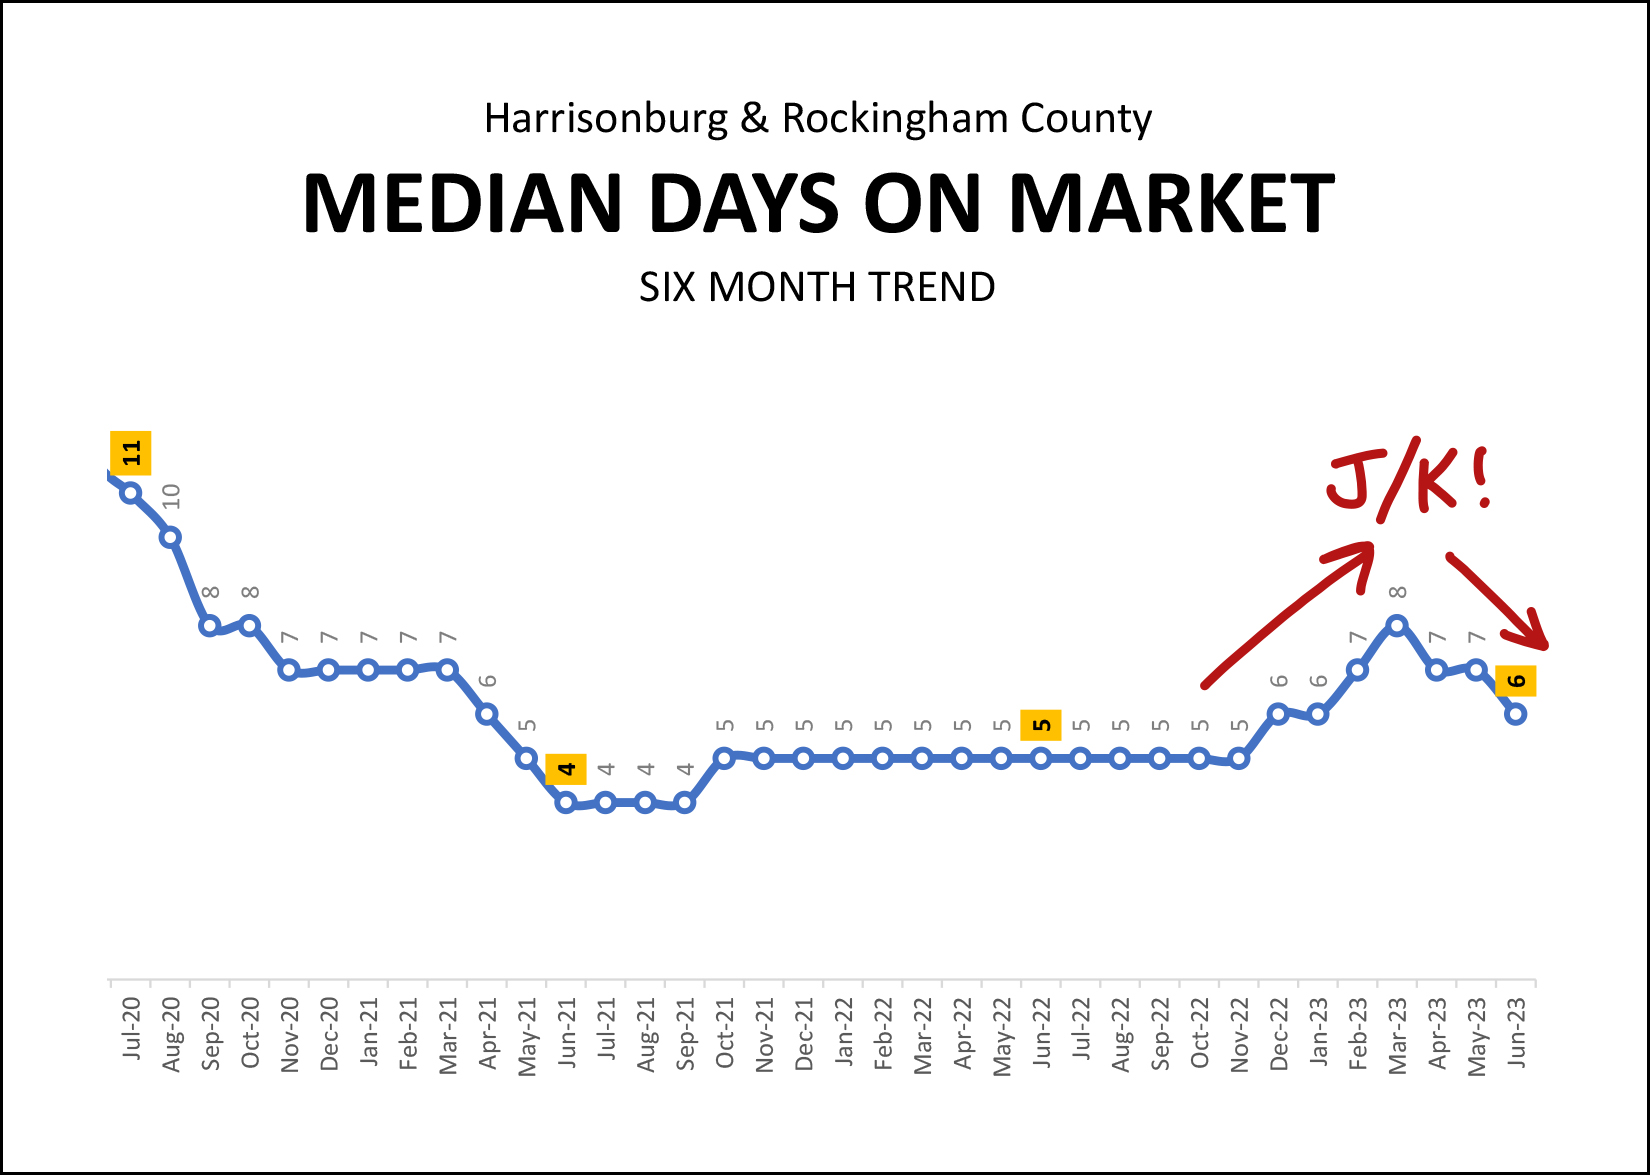
The graph above tracks the median "days on market" metric -- looking at six months of data at a time. As such, the most recent data point of a median of six days on the market is based on January 2023 through June 2023 home sales.
After dropping, dropping, dropping to a median of only four days on the market in mid-2021, we saw a steady report of a median of five days on the market all the way through the end of 2022. But then, it seemed that things might be changing as the median days on market crept up to eight days on the market in early 2023. But... maybe not, after all... as median days on market has shifted back down to only six days over the past few months.
If we ever see a significant shift in market balance -- with more sellers trying to sell than there are buyers to buy -- we are likely see that reflected in this median days on market metric. As is likely evident from the graph above, we're not seeing that type of market shift right now, despite far fewer homes selling this year than last.
Finally, how about those mortgage interest rates. :-/
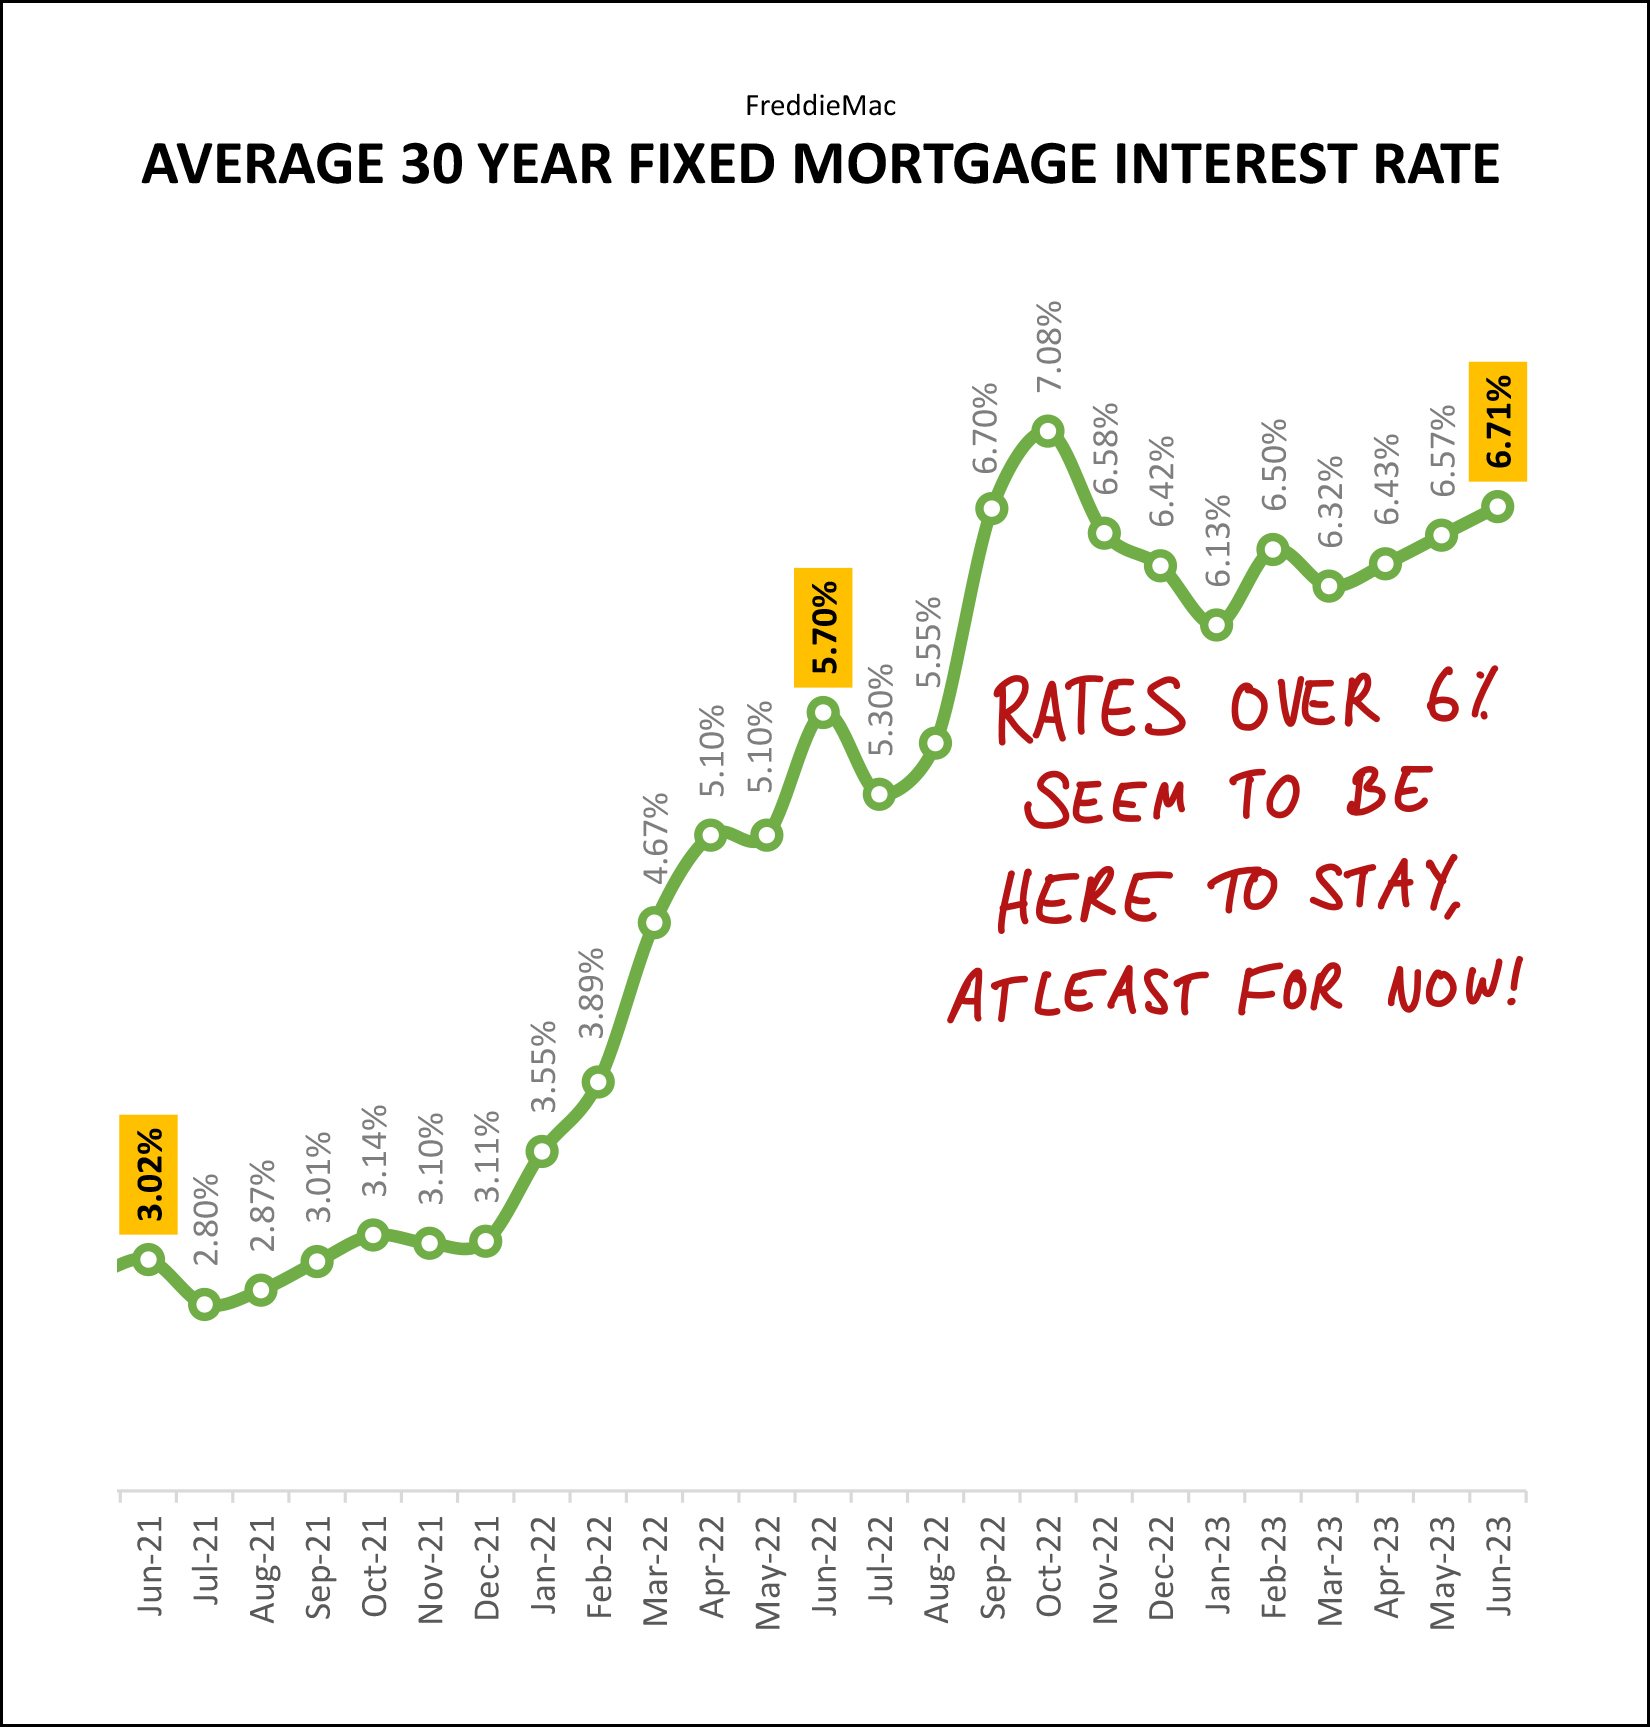
Please only looking briefly (and wistfully) at that 3.02% rate from two years ago... and then focus more on the past year. We have seen relatively volatile mortgage interest rates over the past year -- starting at 5.7%, ending at 6.7%, drifting as high as 7.1% and as low as 6.1%.
It seems likely that we will continue to see mortgage interest rates over 6% for the balance of 2023... though home buyers would certainly love to see that be closer to the 6.31% seen in January rather than the 6.7% at the end of June or the 6.96% seen this week.
Having sifted through all of the data above, what does it all mean for current home sellers and would be home buyers?
Home sellers are likely to still do quite well in the current market, as the median sales price keeps rising and inventory levels (your competition) remain quite low.
Home buyers are likely to continue to have difficulty securing a contract on a home as we move through 2023 due to fewer sellers selling, homes still going under contract very quickly, and likely competition from other buyers for many new listings.
If you are planning to sell your home, or buy a home, in the coming months I would be happy to chat with you about how your segment of the local housing market (based on location property type and/or price) is performing as it compares to the overall market. Feel free to reach out to me if I can be of any assistance to you as you make plans to buy or sell. You can reach me most easily at 540-578-0102 (call/text) or by email here.
Until next month, I hope you find some time to disconnect and enjoy the summer season with your family, friends and loved ones... and if you need me to drive the boat while you water ski... just let me know... ;-)

