Brought to you by , Funkhouser Real Estate Group, , scott@HarrisonburgHousingToday.com
Monday, November 13, 2023
Happy Monday, Friends!
Before we get to the real estate news...can we just start by saying... Go Dukes!?! JMU has been on a roll over the past few weeks and months in multiple sports. The football team remains unbeaten at 10-0 and will host ESPN's College Game Day this Saturday. The men's basketball team defeated #4, Michigan State last week followed by two more wins. The men's soccer team beat #1 UCF two weeks ago. The volleyball team is entering the Sun Belt Conference tournament as the second seed of the east division. And on, and on. This has been a fun year for rooting for the Dukes. If you live locally in the Harrisonburg area I hope you have been able to get out to watch some of these exciting games at JMU... and if you're an out of the area alum, come on back to get in on the action!
Secondly, before we get to the housing data... each month I provide a monthly giveaway, of sorts, for readers of this market report, highlighting some of my favorite places, things or events in Harrisonburg. Recent highlights have included Hank's Grille, Taste of Thai and Merge Coffee. This month I am giving away a $50 gift certificate to Kyoto Japanese Steakhouse. Our family has enjoyed Kyoto for years - for family birthday dinners and other special celebrations. If you haven't been to a meal at Kyoto, you should make a point to do so soon. Click here to enter to win a $50 gift certificate!And now... on to the latest data and trends in our local housing market!
First, an overview of a few key indicators...
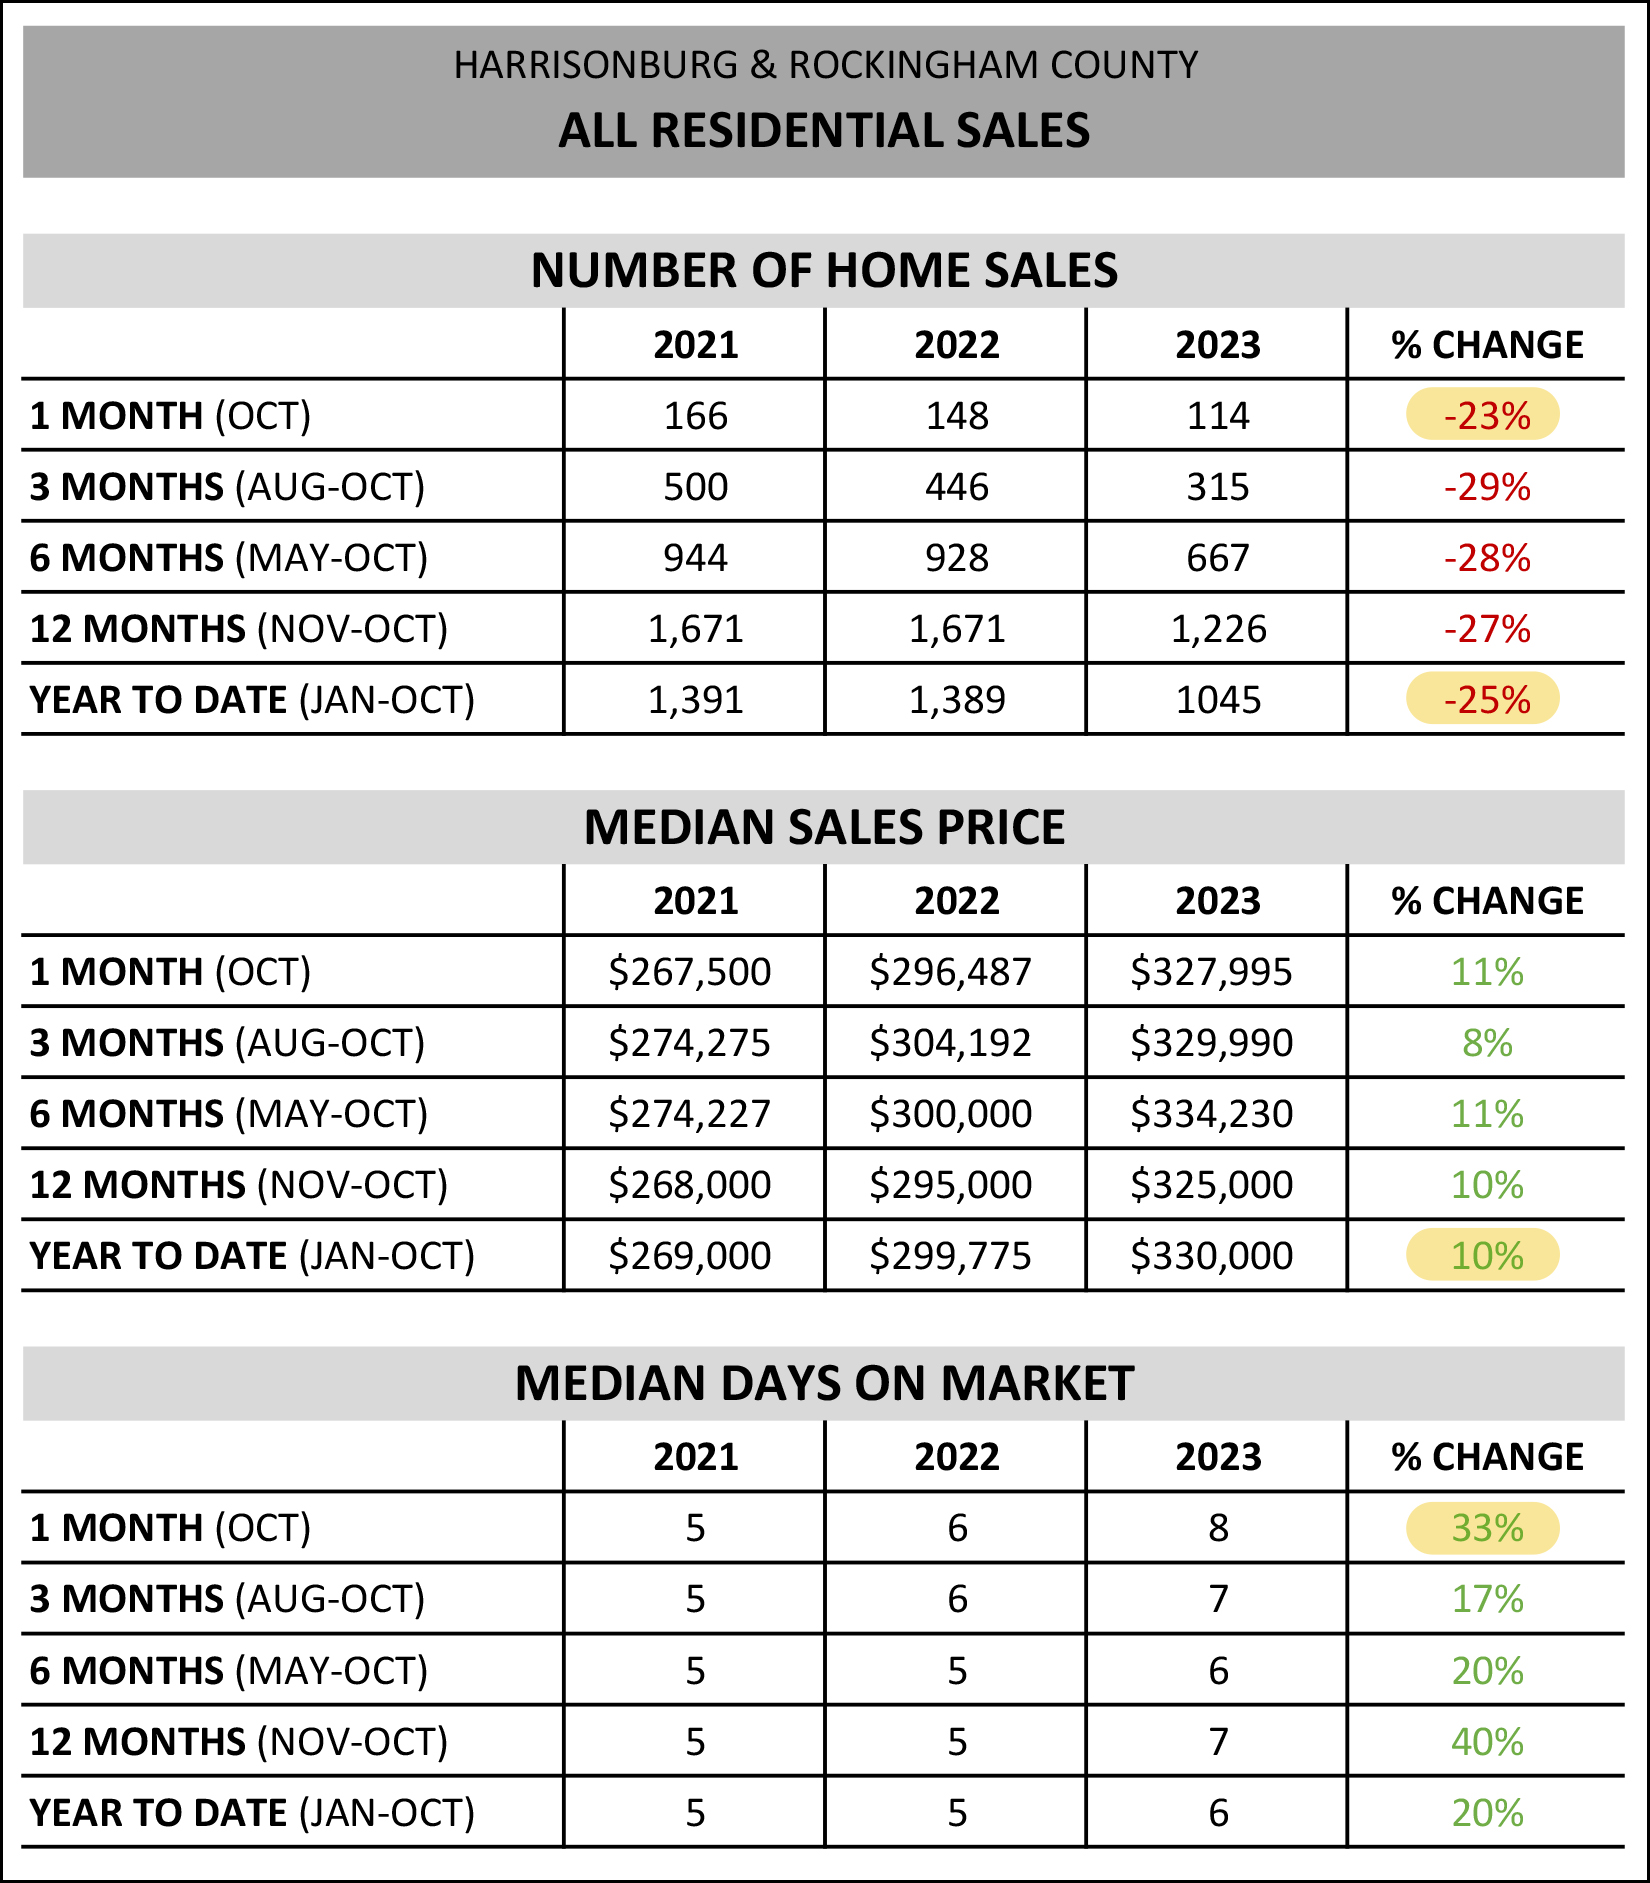
The highlighted trends above aren't all that new -- they are a continuation of what we have been seeing through most of 2023...
[1] We continue to see fewer and fewer home sales in Harrisonburg and Rockingham County. This October there were 23% fewer home sales than last October. This year (Jan-Oct) we have seen 25% fewer home sales than last year during the same timeframe.
[2] Despite fewer home sales taking place, home prices keep on rising. The median sales price thus far in 2023 is $330,000 which is 10% higher than the median sales price of $299,775 that we saw last year.
[3] Homes are selling (as a whole) ever so slightly more slowly than last year -- even if it shows up as a 33% increase in the median days on market. Last year's median days on market in October was six days... and this year it's up 33% to eight days. So, many homes (at least 50%) are still selling quite quickly, even if ever so slightly more slowly than last year.
Next up, though, let's take a look at a data table that might surprise you a bit...
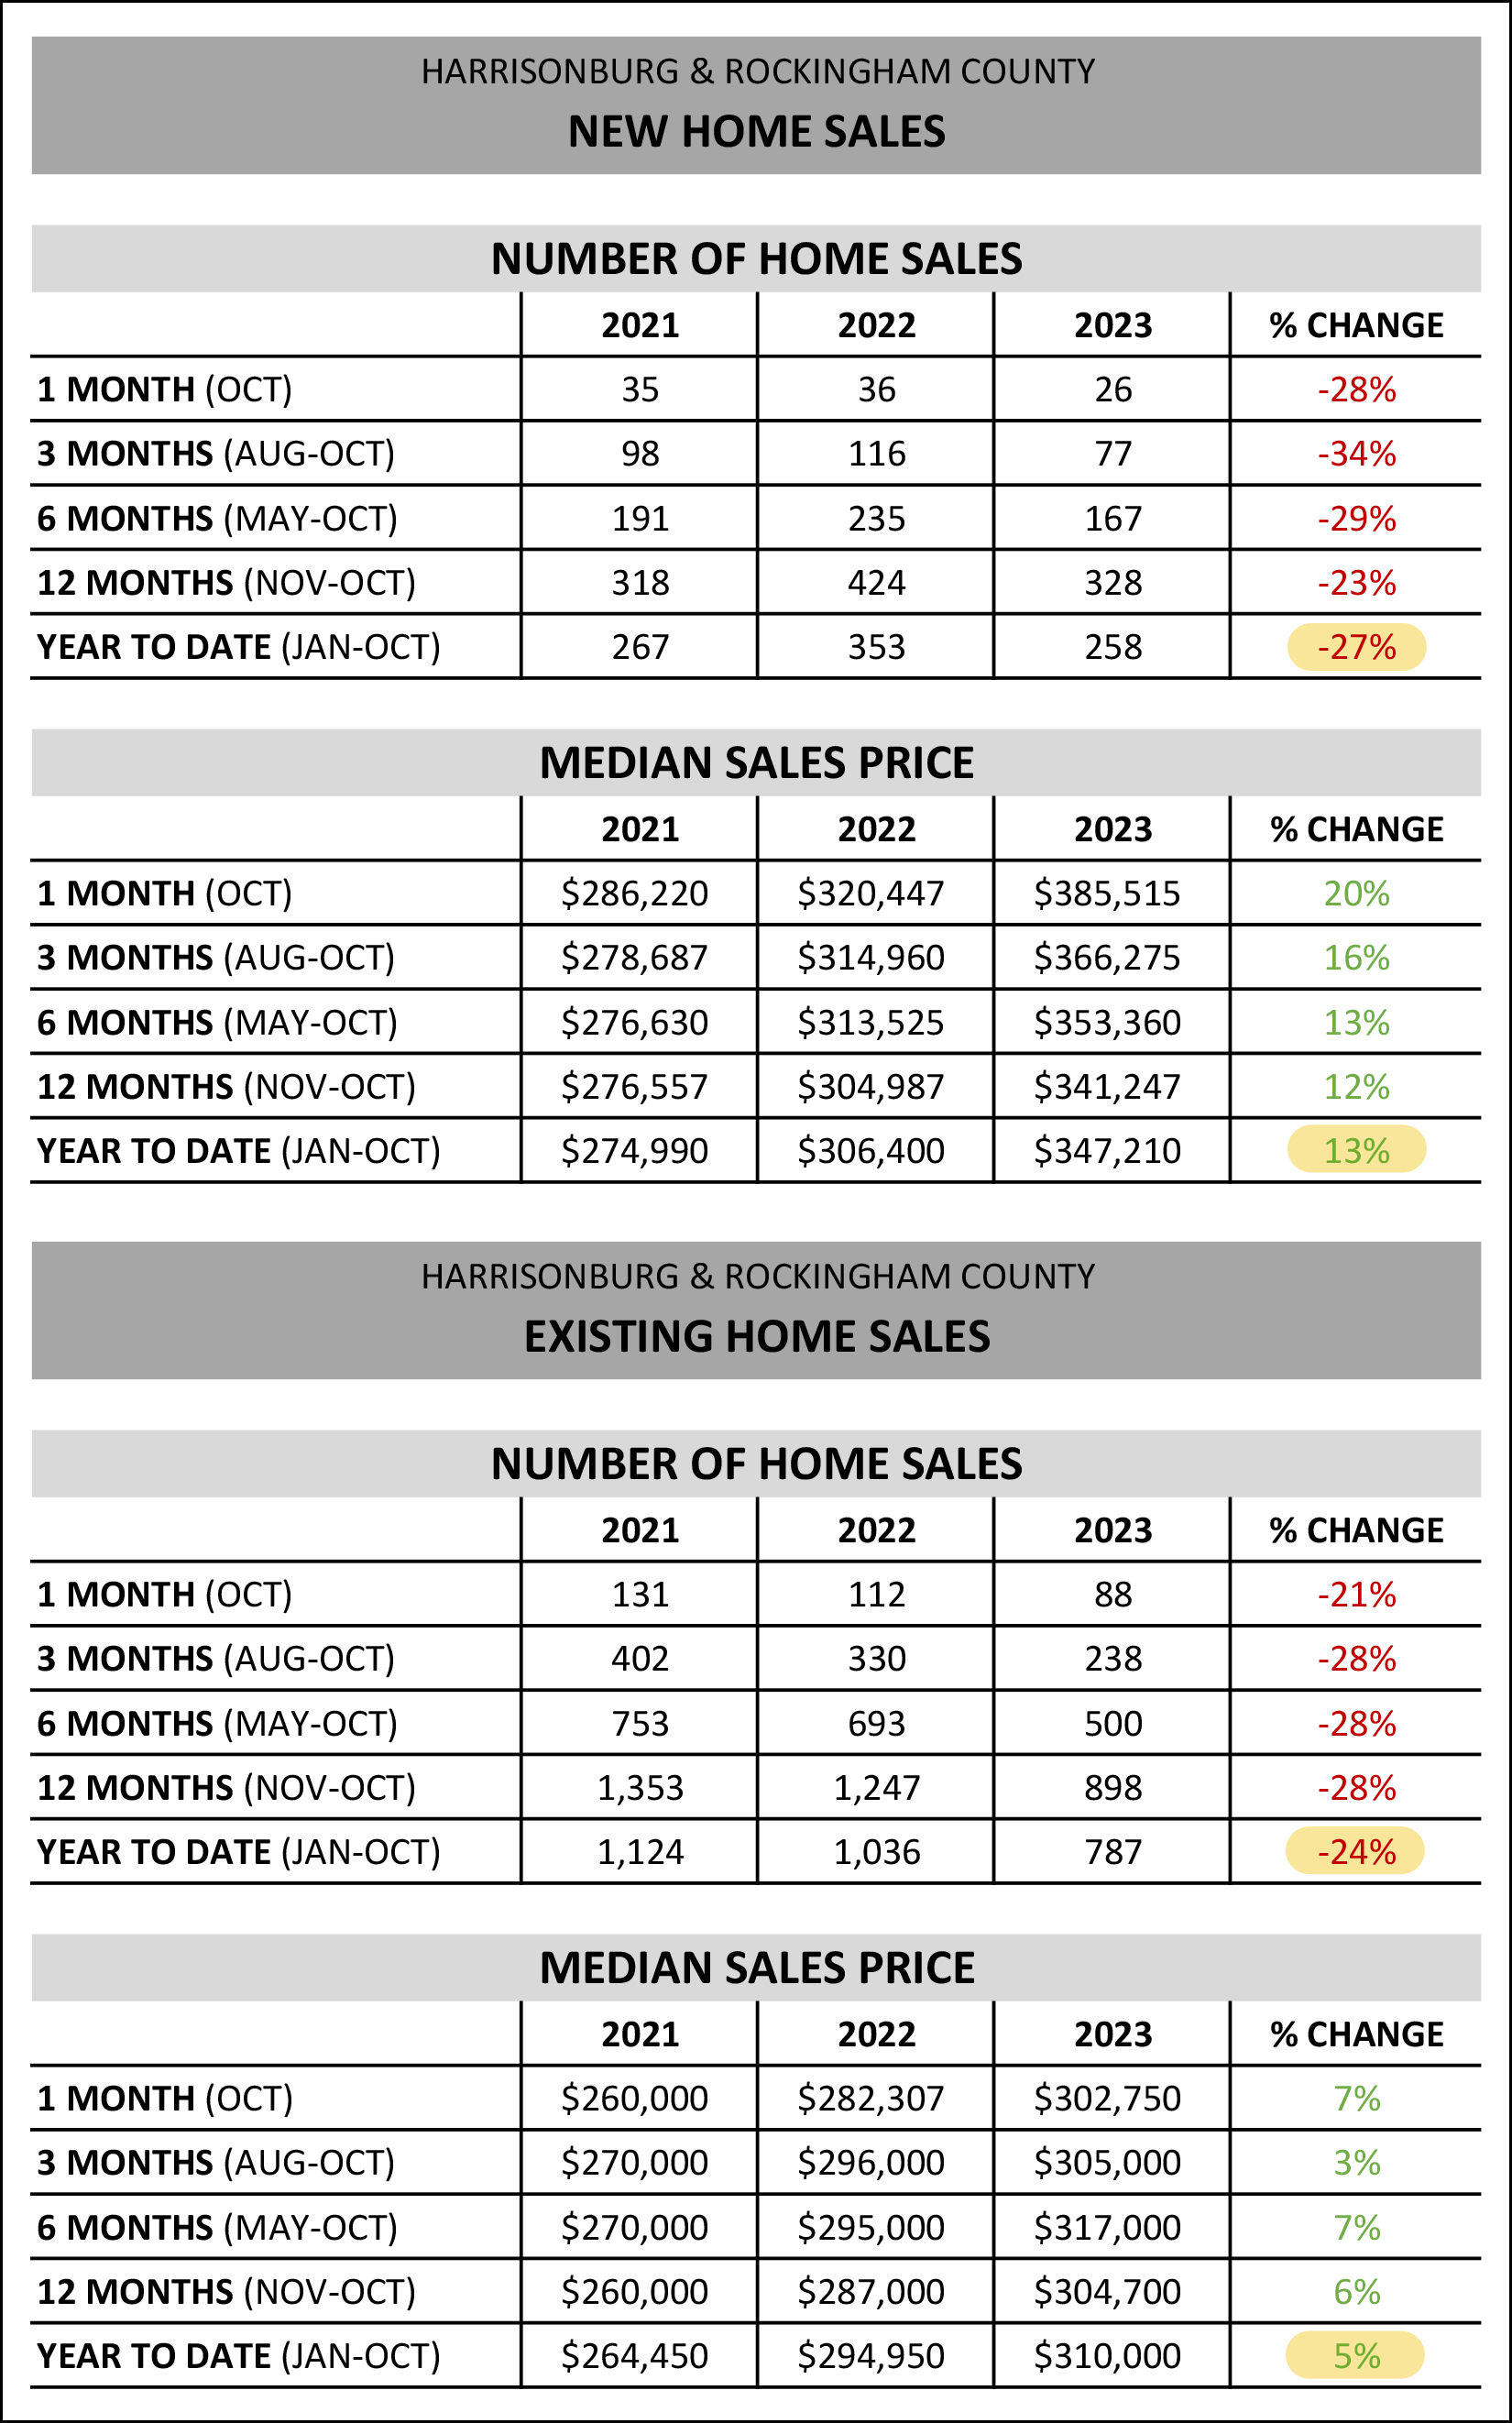
The top two tables above look only at new home sales while the third and fourth table look at existing home sales.
First, the decline in the number of homes that are selling (2023 vs. 2022) is relatively similar between new home sales (-27%) and existing home sales (-24%).
But... the change in median sales price over the past year is where we notice some differences. The median sales price of new homes has increased 13% over the past year -- while the median sales price of existing homes has only increased 5% over the past year.
Hmmmm.... so while the market wide median sales price has increased 10% over the past year, if we strip out the new home sales (and their impact on pricing) we are only seeing a 5% increase in the median sales price.
This 5% increase in the median sales price of existing homes in 2023 follows an 11.5% increase in that metric in 2022. So, perhaps the increase in (existing) home prices is slowing?
Now, moving on to some visuals of the latest trends we're seeing in our local housing market for all the visual learners amongst us.
First, how much slower has this year been than last year?
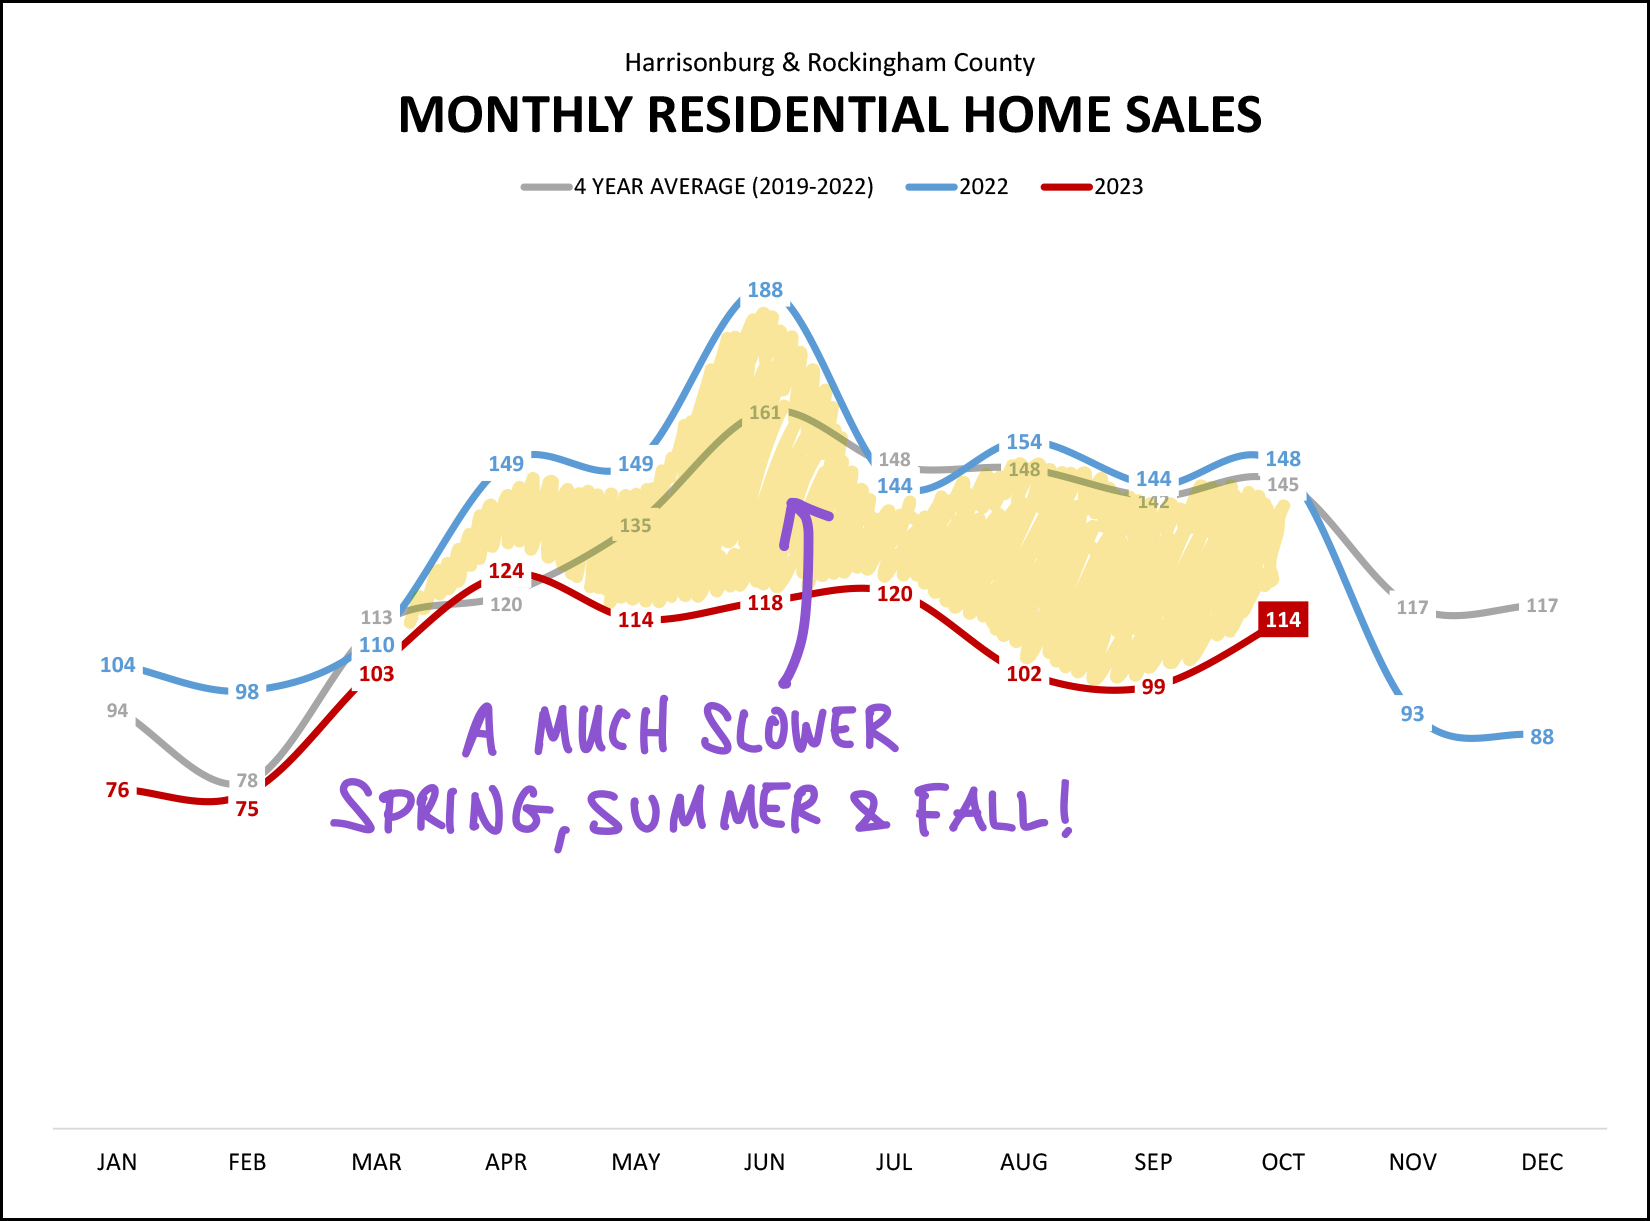
My yellow scribbles above are filling in the area between last year's home sales figures (blue line) and this year's home sales figures (red line) to show how much of a gap we have seen in home sales between March and October.
Last year (Mar-Oct) we saw 1,186 home sales.
This year (Mar-Oct) there have only been 894 home sales.
This is a big drop (25%) and it seems to mostly be a reduction in the number of sellers selling... though we can start to re-think that a bit as we move through another month of rising inventory levels. But all that is to come... keep reading.
Next up, the long term trends in the number of homes selling and the prices of those homes...
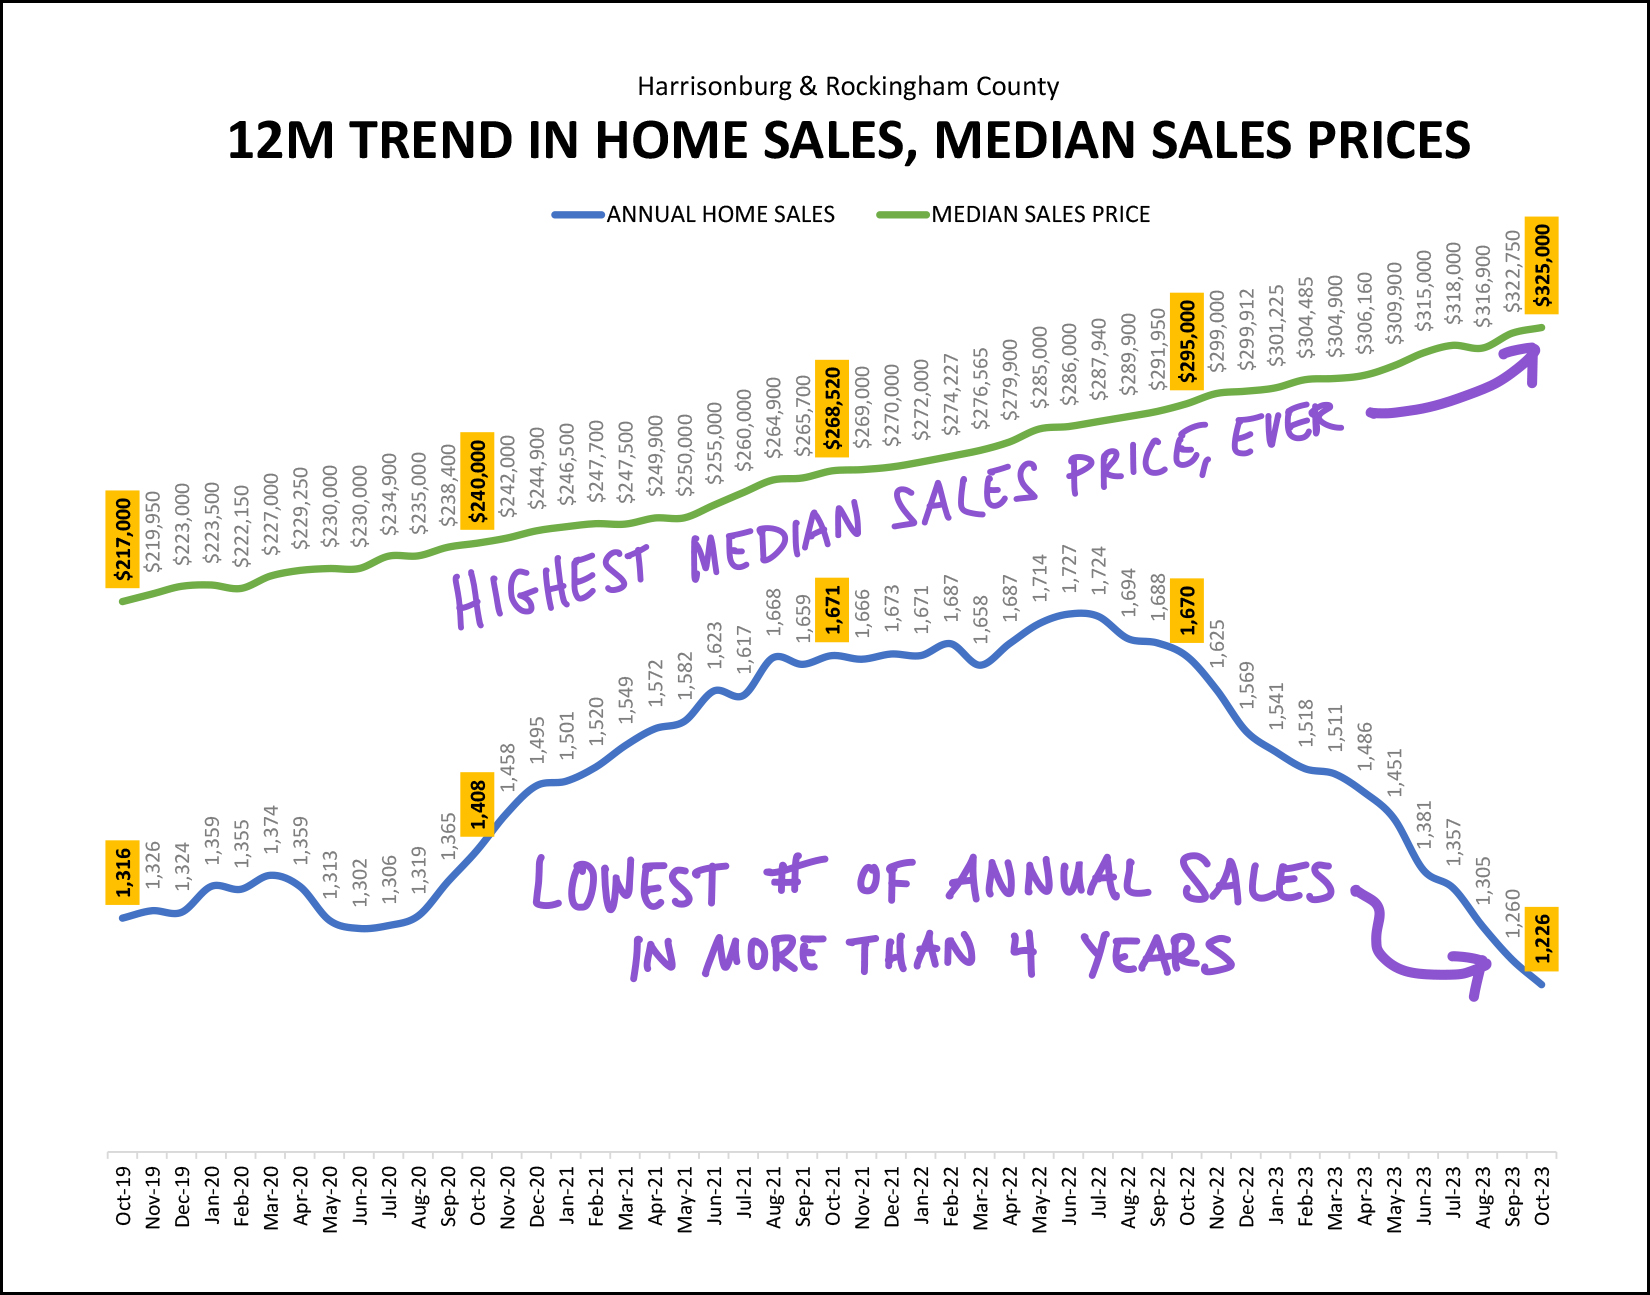
The number of annual home sales has now dropped all the way down to 1,226 home sales... which (as this graph points out) is the lowest number of annual sales in over four years.
And... it's actually much longer than four years. The last time we were seeing homes sell at an annual rate lower than 1,226 homes per year was way back in July 2016... over seven years ago!
With home prices being as high as they are (illustrated by the top line in the graph above) and with mortgage interest rates being so high (now) compared to rates most homeowners have on their current mortgages -- I don't think we will see this annual rate of home sales start to increase in the near future.
Shifting gears a bit, let's look forward to the remainder of the final quarter of 2023 as it relates to contract activity...
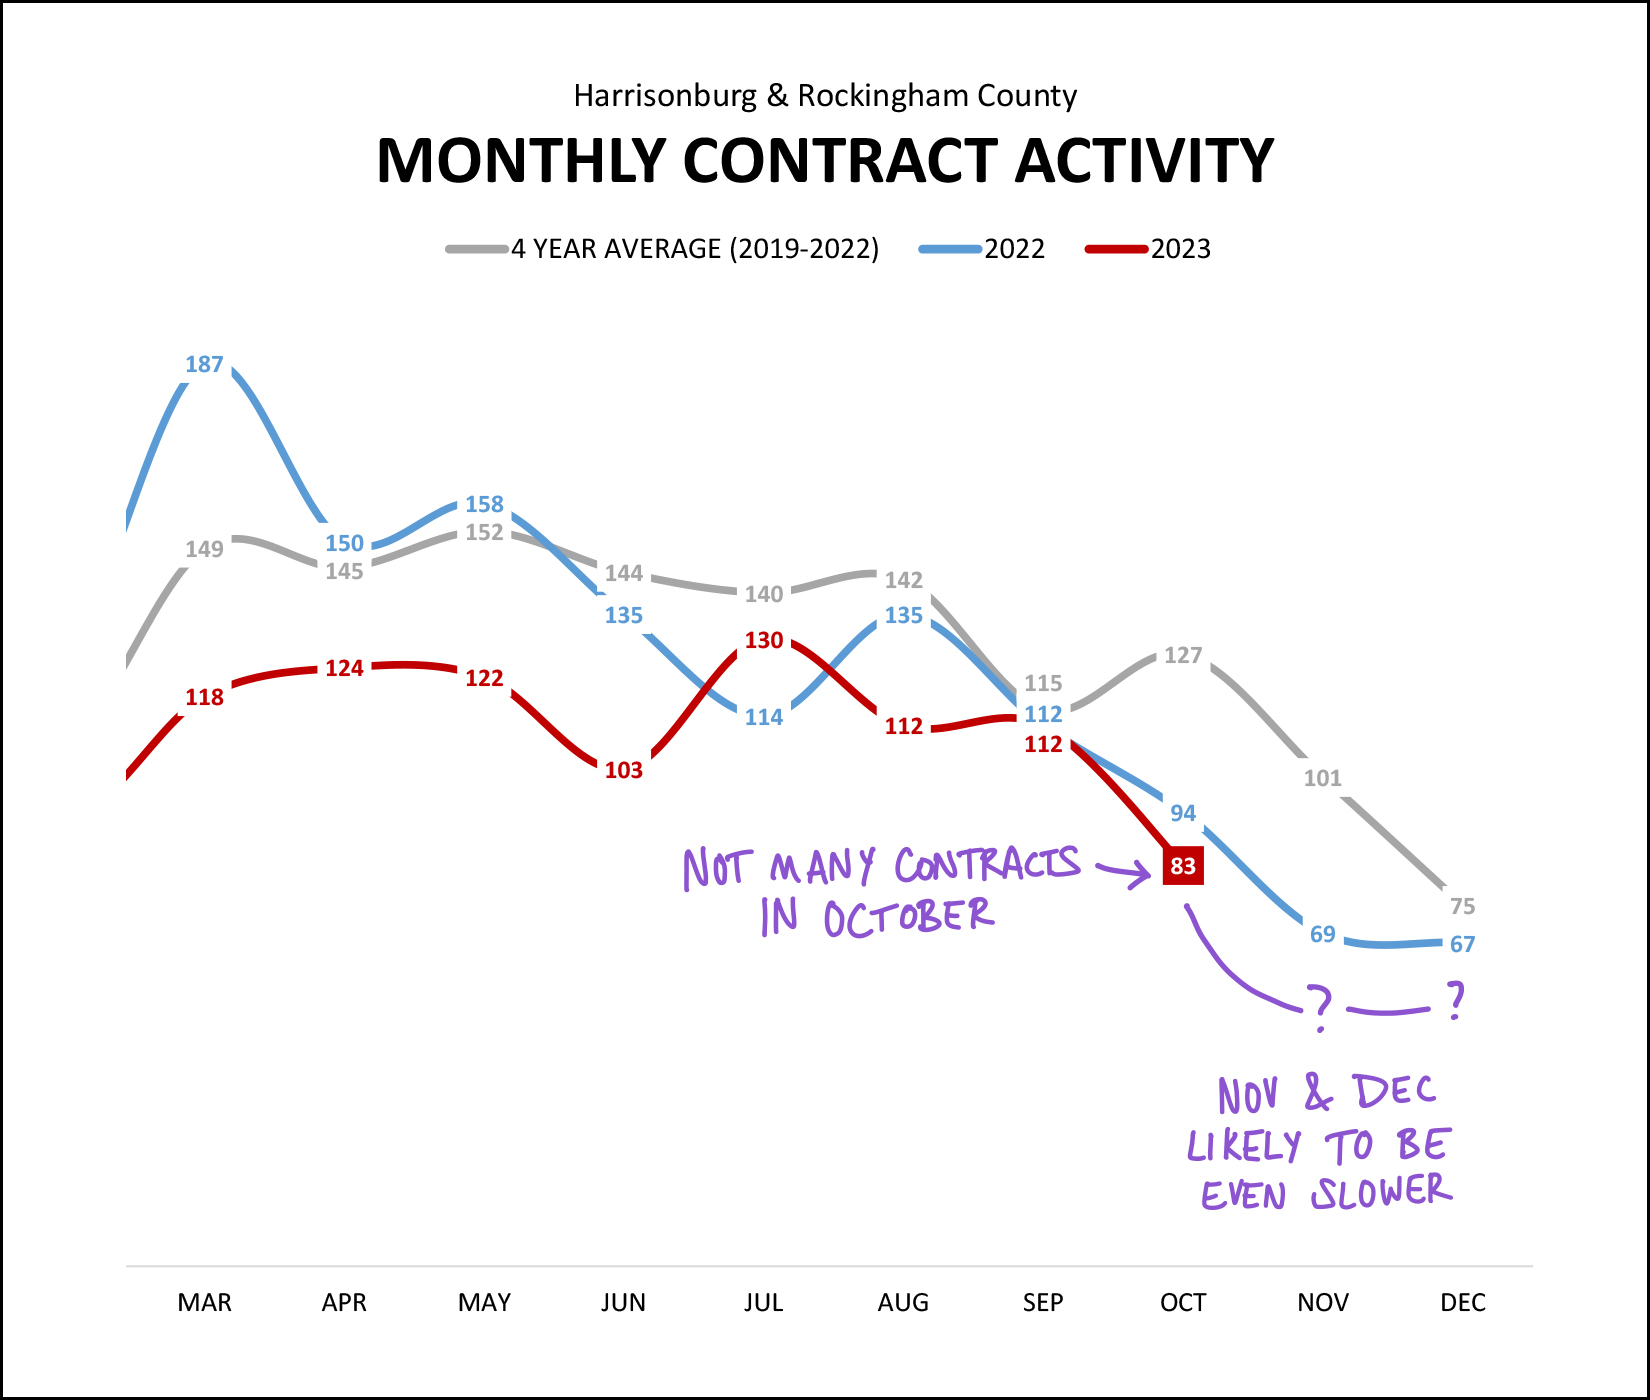
Only 83 contracts were signed in October 2023 which is slightly lower than last October (94) and significantly lower than the average October over the past four years (127).
Looking ahead, it seems likely that we will see even fewer contracts being signed in both November and December. This is interesting to keep in mind when we get to the inventory graph in a bit.
But before we get to the inventory numbers, here's a bit of a counter indication as to contract activity...
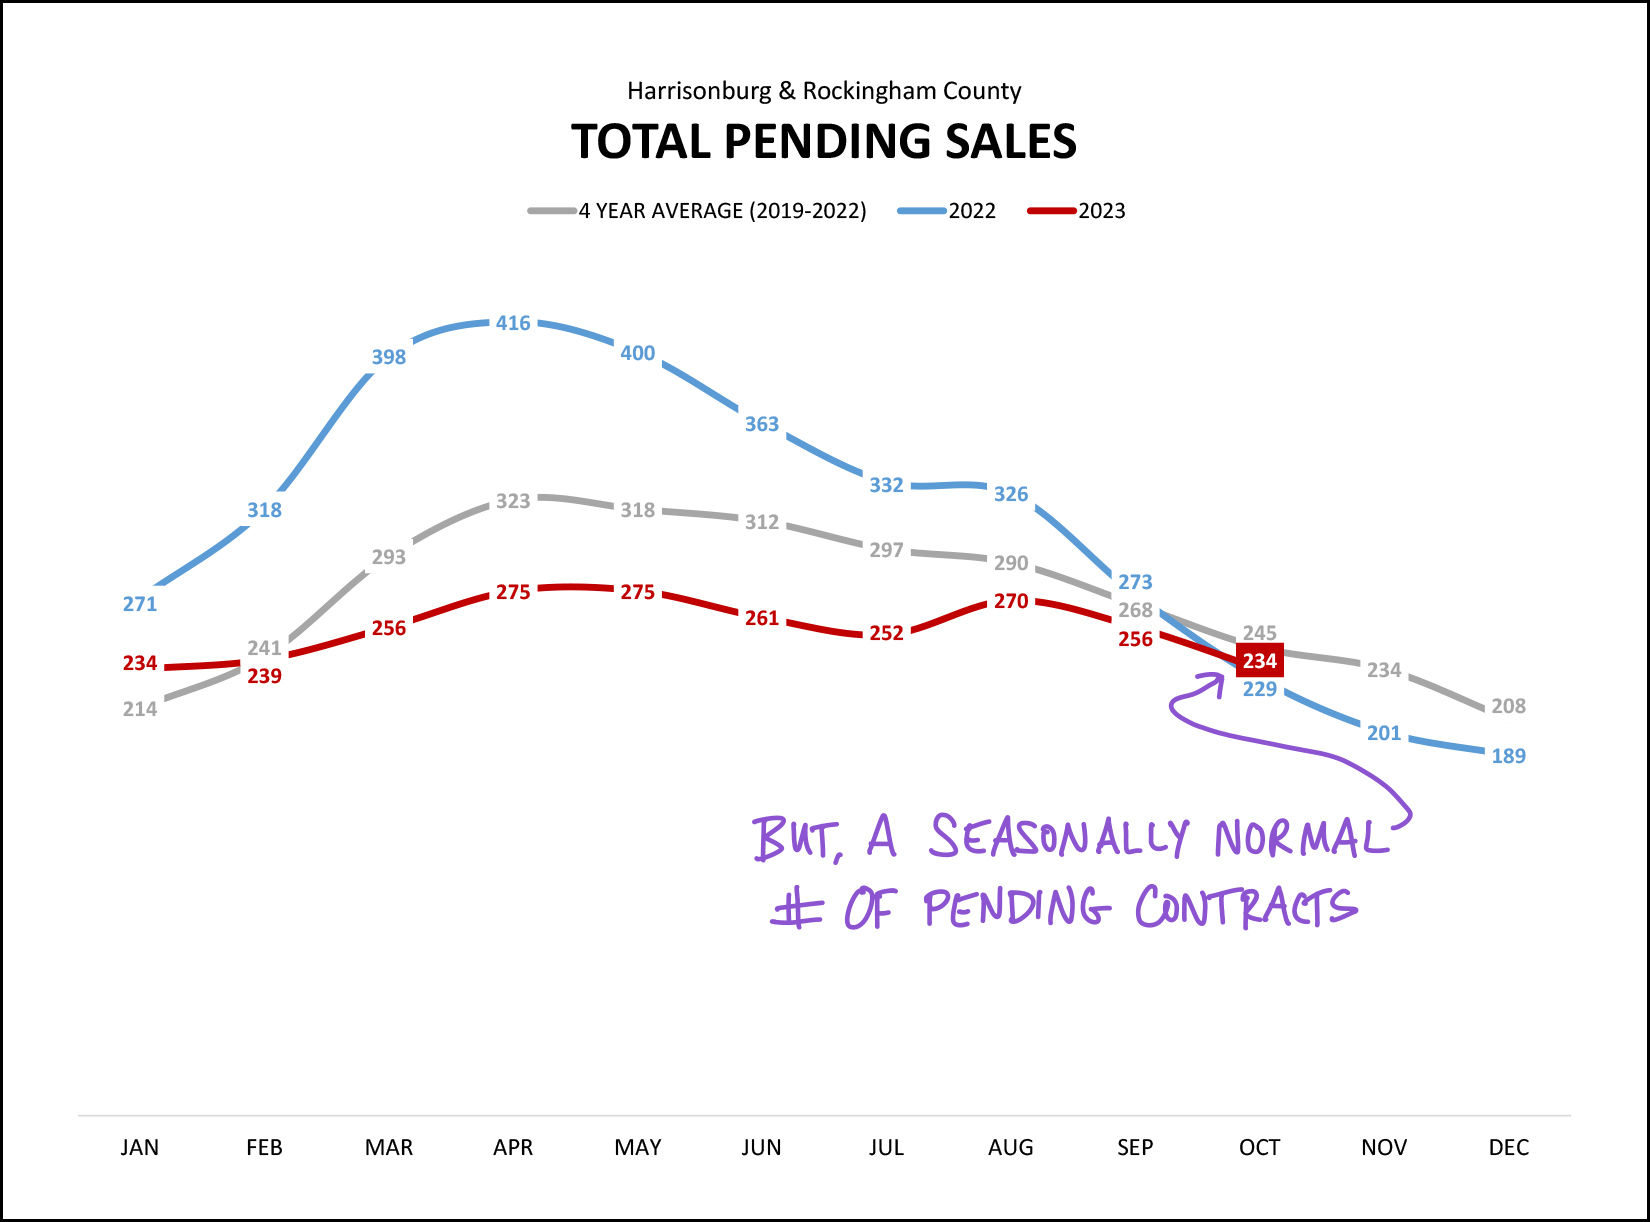
Despite slower contract activity, of late, the number of pending sales (under contract homes) is hovering around 234 contracts right now... which is very much in line with where we would expect it to be based on where we were at the end of last October (229) and the average end of October data from the past four years (245). Thus, perhaps we'll see normal-ish numbers of closed sales in November and December, given the normal-ish number of homes that are currently under contract?
Now, inventory, the most interesting, unexpected and atypical indicator in this month's report...
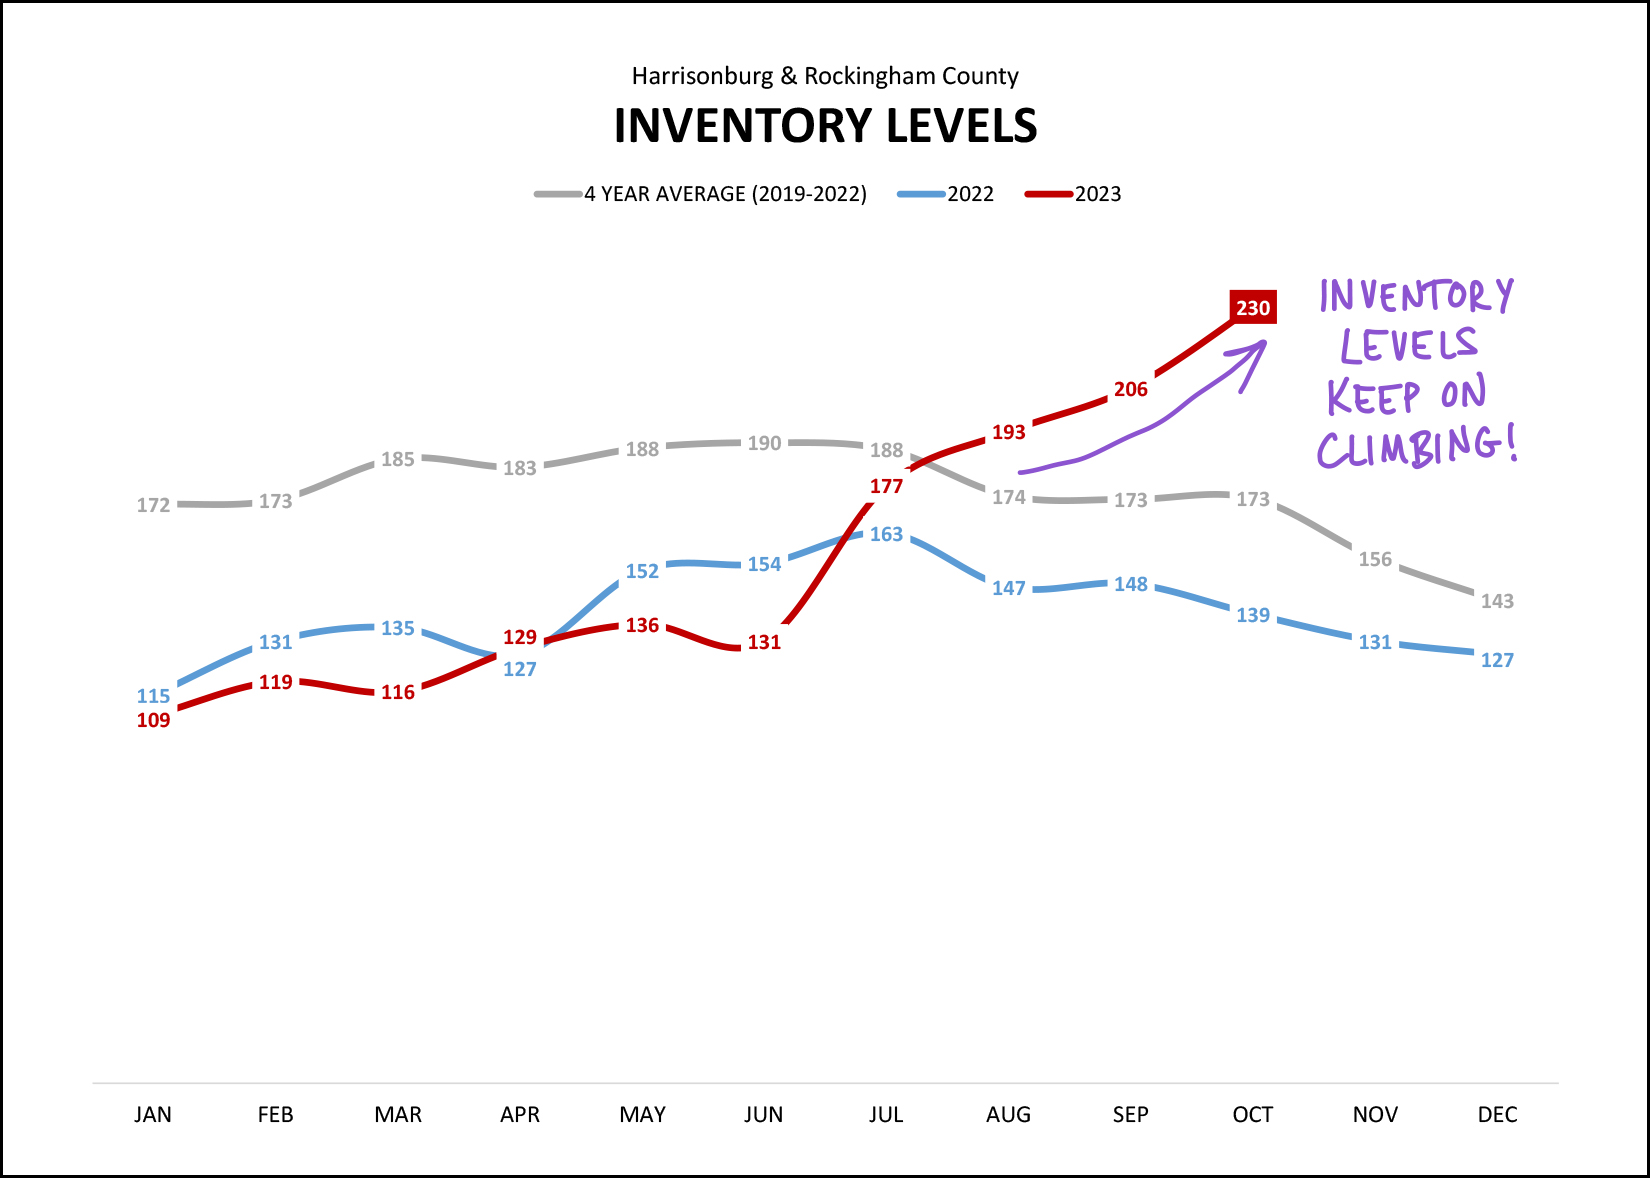
Inventory levels are continuing to climb, as they have for the past four months now. The 230 homes that are currently on the market is 65% more homes than were on the market a year ago. What does this mean?
[1] While the homes that are selling are still selling rather quickly, there is an increasing number of homes that are not selling right away and that is causing inventory levels to climb.
[2] If you are listing your home for sale you might see it go under contract quickly -- contributing to the low "median days on market" figure -- or you might not see it going under contract quickly -- contributing to the increasing inventory levels. Yes, I understand very clearly which group every home seller would like to be a part of -- but every home seller is not automatically a member of the "my home sold in a flash" club any longer.
Circling back a bit, here's the median days on market data, showing that plenty of people are still in that "my home sold in a flash" club, with a significant caveat to follow...
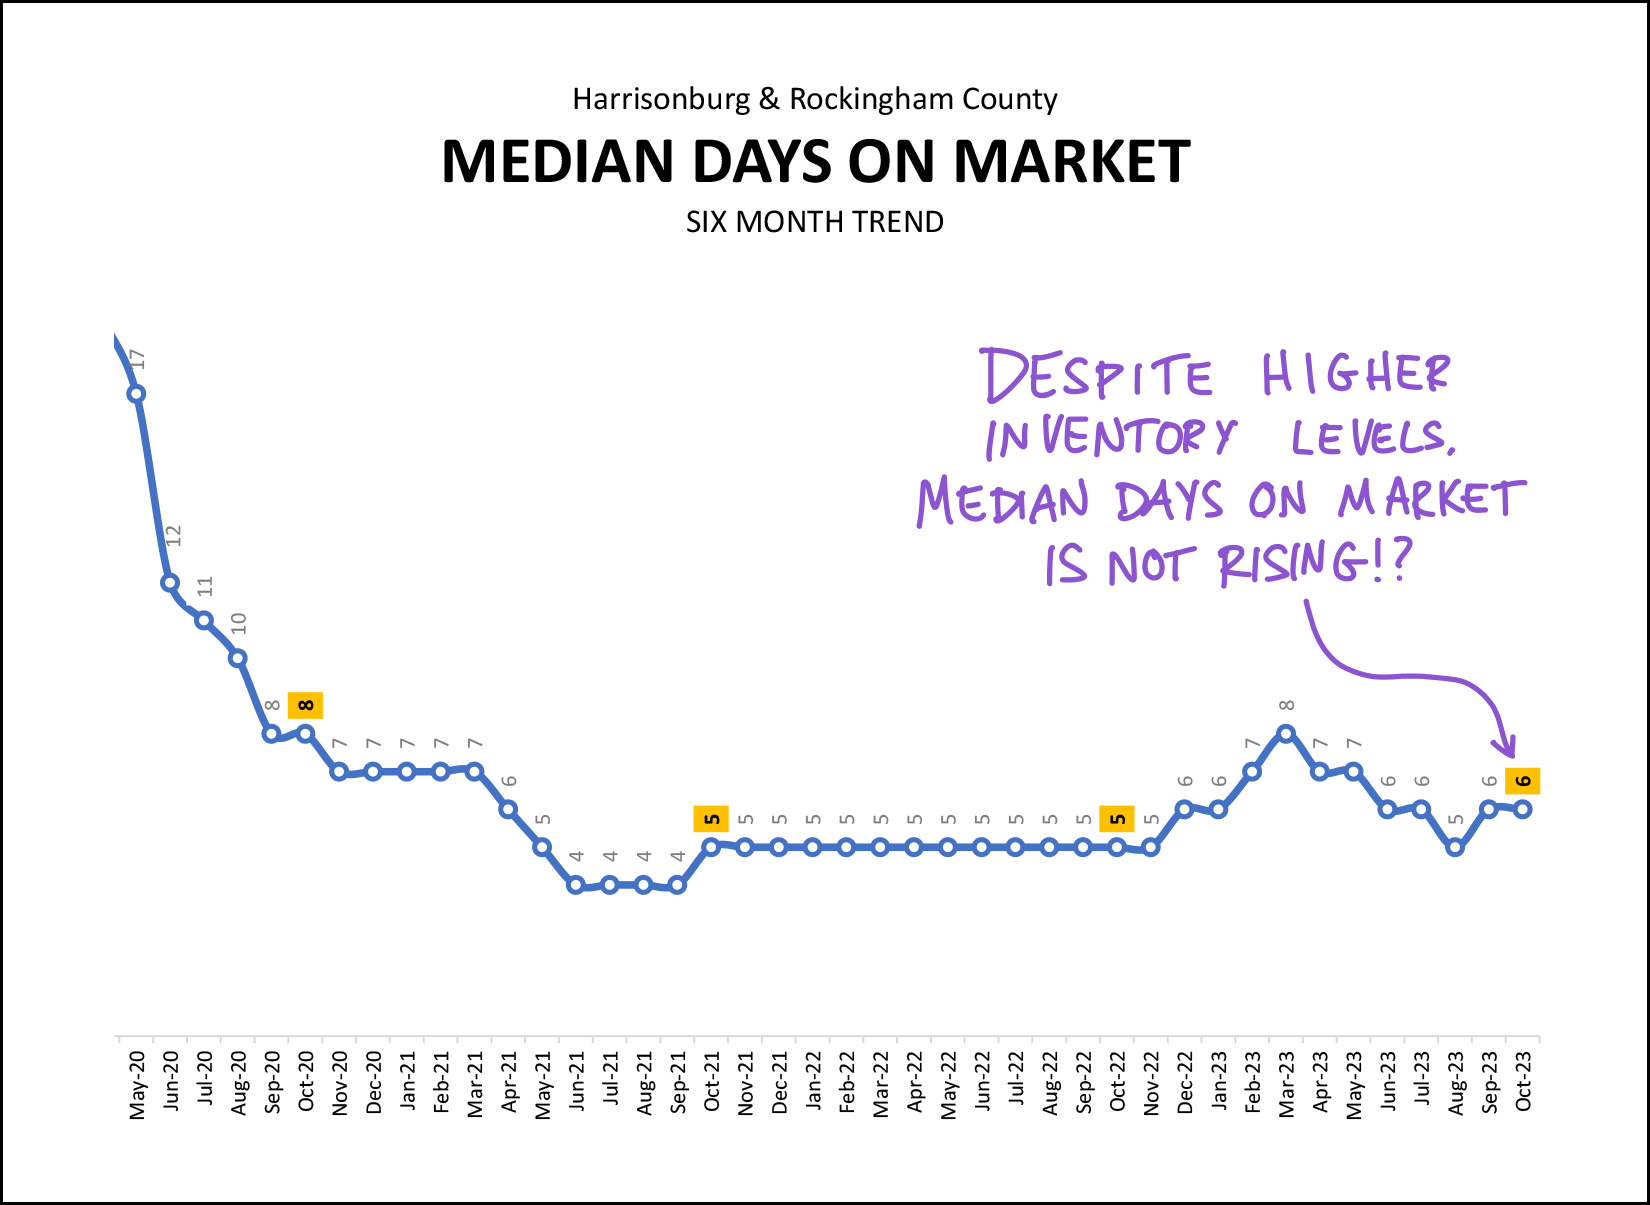
Let's be clear on what this graph (above) does and does not show...
[DOES] This graph does show that half of the homes that have sold in the past six months have gone under contract in six or fewer days and half of the homes that have sold in the past six months have gone under contract in six or more days.
[DOES] This graph does show that the time it is taking for homes to go under contract is about the same now as it was in the crazy times of 2021 and 2022. We were seeing a median of four to five days then, and a median of six days now.
[DOES NOT] This graph does not show that all homes that are listed for sale will go under contract with a median of six days. These median days on market figures are calculated only based on homes that sell, once they have sold.
I'll speak more to the "so what" or "now what" portions of these indicators a bit later.
And finally, one of the main reasons for fewer home sales in 2023, those pesky high mortgage interest rates...
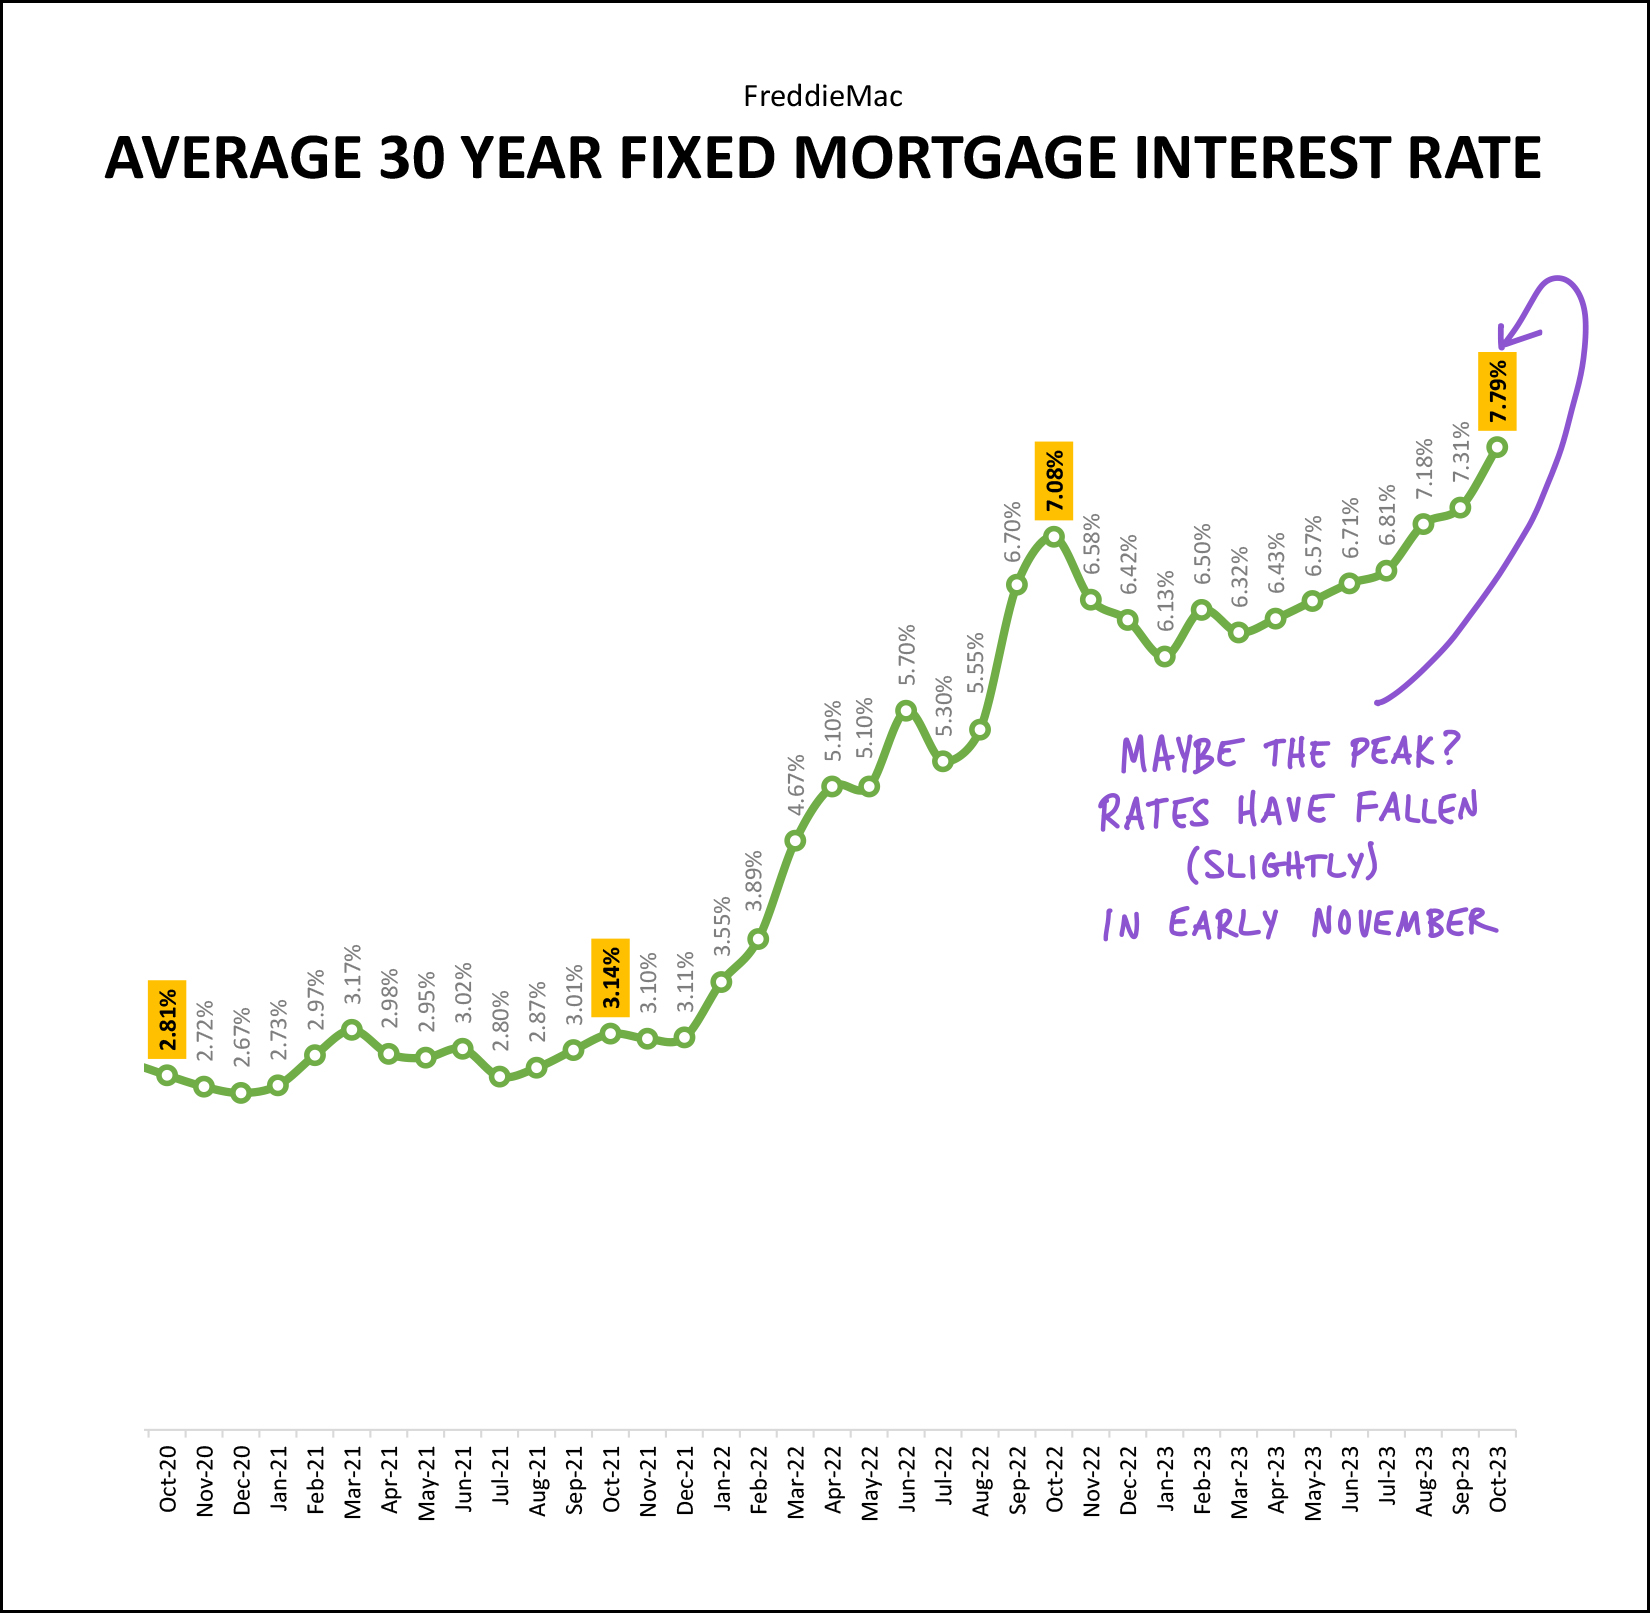
We now seen mortgage interest rates above 6% for more than a year... they have been over 7% for the past three months... and they were getting close to 8% at the end of October!
These high (higher) mortgage interest rates put a damper on home sales activities...
[1] Buyers think twice about buying after they calculate their monthly mortgage cost based on today's rates.
[2] Sellers think twice about selling when they realize they'd be giving up their current (likely) low rate for a (likely) much higher rate today.
I don't think we will see much of an increase in the number of homes that are selling until we see mortgage interest rates heading back down. It is worth noting that rates have come back down a bit in November, dropping from 7.79% down to 7.5% as of last week.
Now, let's move on to the "so what" and "now what" portion of our conversation...
If you plan to buy a home soon...
[1] Yes, mortgage interest rates are high, so talk with a lender to make sure you have a clear understanding of your potential mortgage payment and make sure that it fits in your budget.
[2] You likely are seeing more options of homes to consider now than you would have had over the past few years. Enjoy possibly having a few options at once instead of just one option at a time.
[3] You might not have to make a decision about an offer within 30 minutes. Yay! Think it through, go back and look a second time, make sure you are comfortable with your potential offer and your buying decision.
If you are selling your home and it's already under contract...
[1] Congratulations.
[2] Don't talk about it with anyone in the next category. ;-)
If you are selling your home and it is not yet under contract...
[1] We should take a look at how your pricing compares to other homes that buyers might currently be considering. We must make sure your pricing is competitive.
[2] We should look at whether other buyers have contracted on similar homes in the past 60 days. Have buyers bought other houses -- and not your house -- or have they not been contracting to buy anything at all?
[3] We will likely want to discuss if or how an adjusted list price might cause a buyer on the fence to make an offer... or a buyer looking at the fence to come view your home. ;-)
[4] Sometimes the only solution is to be patient as there are no longer multiple buyers in the market, always, for every house regardless of size, location, features and price.
If you plan to sell your home soon...
[1] Pricing is key! Let's be super realistic (or overly realistic) with pricing so that you can join the "my home sold in a flash" club.
[2] We will also need to take a look at how many buyers have purchased homes like your home over the past 60, 90 or 120 days to try to have realistic expectations for time on the market.
[3] You might not have a flurry of showings in the first few days that your home is on the market. This does not mean that your home will never sell. It just means that it is not 2021 or 2022. :-)
[4] Selling a home in 2021 and 2022 was a sprint... but you don't need to worry that it will now be a marathon... it is likely to be somewhere between a one mile run and a 5K.
And for everyone...
As all of these market trends (# sales, prices, inventory levels, time on market) adjust in our local market, it's more important than ever to delve deeper into the data related to your specific property type, price range, neighborhood, etc. - regardless of whether you are selling or buying.
We must take a more thoughtful approach than ever to our selling strategy when it comes to pricing, preparation, marketing and negotiating... and a more thoughtful approach than ever to our offering strategy when buying.
I'll wrap it up there for now, but feel free to reach out if you have questions about your particular housing situation -- or if you just want to talk things through. You can reach me most easily at 540-578-0102 (call/text) or by email here.
