Brought to you by Scott P. Rogers, Funkhouser Real Estate Group, 540-578-0102, scott@HarrisonburgHousingToday.com
Brought to you by Scott P. Rogers, Funkhouser Real Estate Group, 540-578-0102, scott@HarrisonburgHousingToday.com
Monday, March 11, 2024
Happy Monday morning, friends!
We're about a week away from spring -- as the seasons go -- and the spring real estate market is almost upon us as well!
Furthermore, this Thursday (3.14) you'll have a chance to celebrate PI day!
Each month I offer a giveaway, of sorts, for readers of my monthly market report. This month you have a chance to win a few pies (pizzas) from Bella Luna. If you find me at Bella Luna I'll likely be enjoying a Caesar Salad and The Don - their meatball pizza. Click here to enter a chance to win a $50 gift certificate to Bella Luna!
And now, let's take a look at some of the most recent trends in our local real estate market, starting with how many homes have been selling of late in Harrisonburg and Rockingham County...
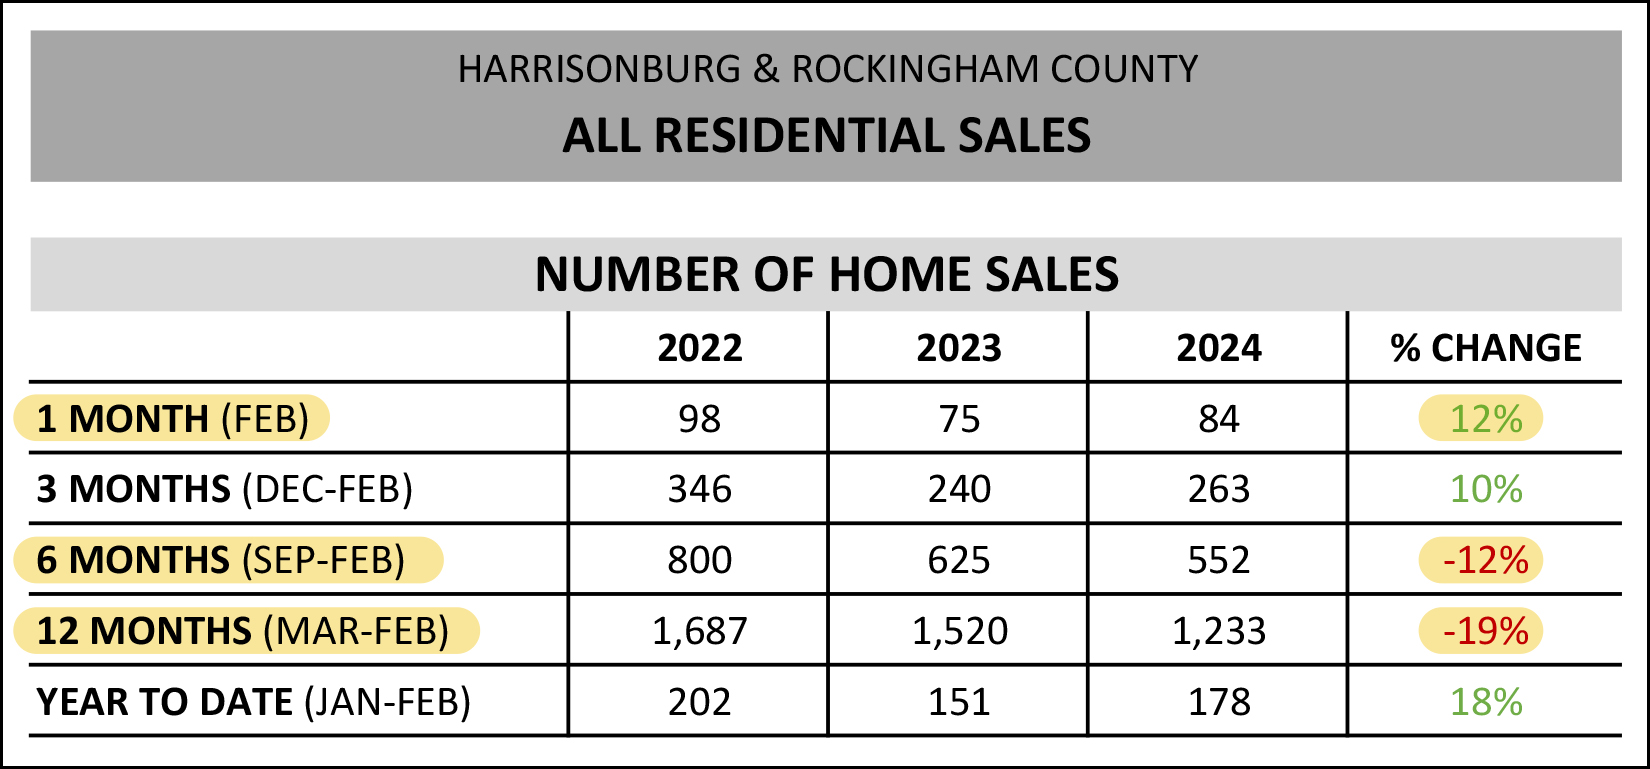
Here's what I'm noticing in the chart above...
[1] You'll see this on a graph a bit further down, but we saw slightly more home sales this February (84) than last February (75). That said, both of these months of February home sales are well below the 98 home sales we saw two February's ago in 2022.
[2] Skipping down to the third highlighted line above, we have seen a 19% decline in home sales in our local market -- but in the past six months (the second highlighted line above) we have only seen a 12% decline in home sales. You'll also see this visually in a graph a bit later, but we may have seen the slowest slow of the recent slowness in our local market -- as it pertains to the number of homes that are selling.
That's all (for the moment) about how many homes are selling -- but let's take a look at the prices at which these homes are selling...
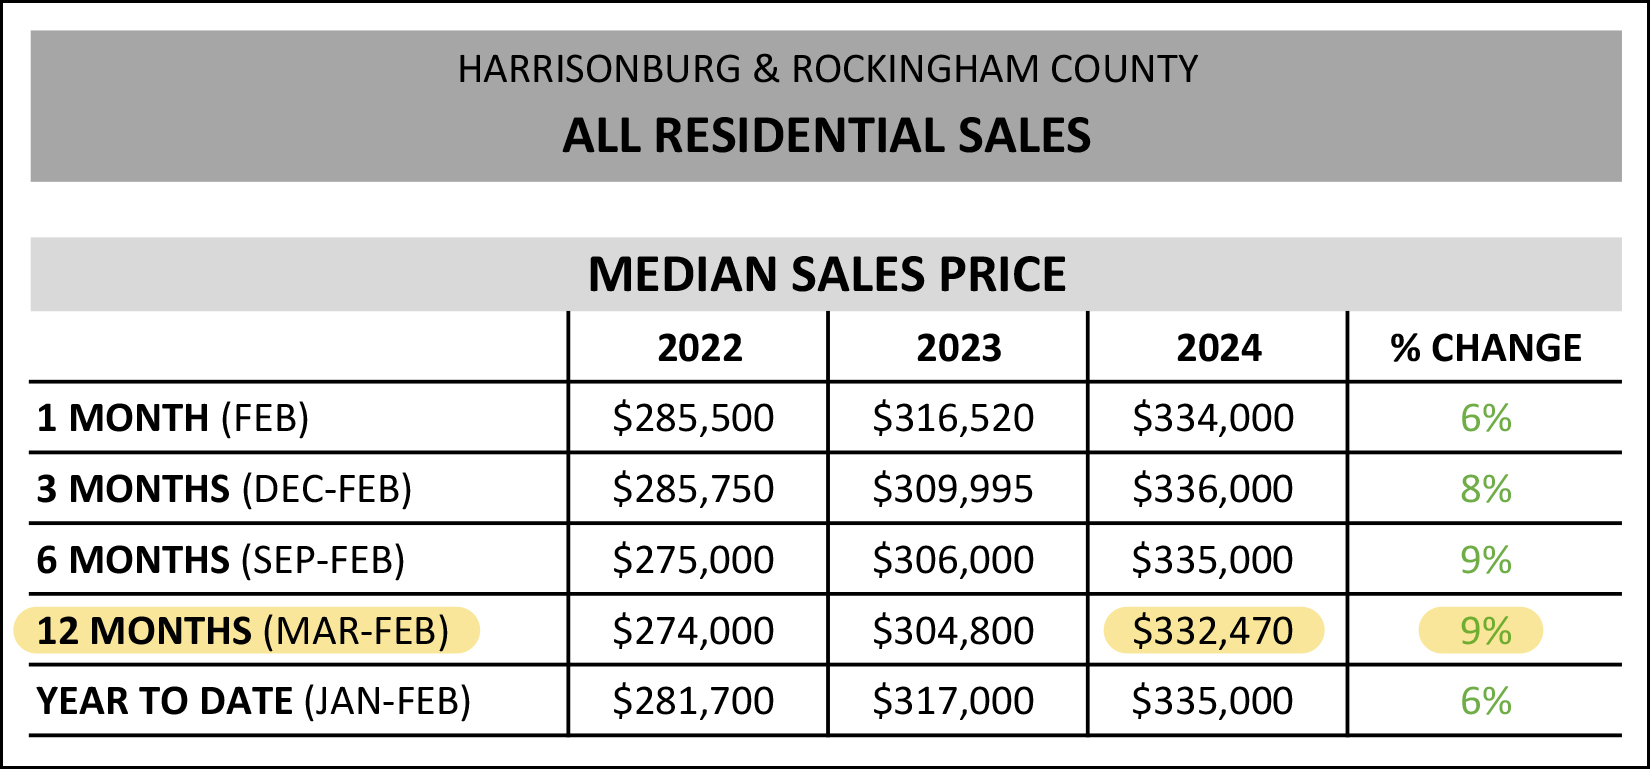
Feel free to peruse them all (above) but I'll just focus in on the one highlighted line. The median sales price of homes selling in Harrisonburg and Rockingham County over the past 12 months has been $332,470. This most recent annual median home sales price is 9% higher than it was a year ago when it was $304,800.
So... the median sales price is definitely still increasing, quickly, though we saw quite a few months (years) when it was increasing by 10% per year. So, maybe the increase in our local median sales price is slowing, barely. We'll know more over the next 3, 6 and 12 months.
And, for another potentially changing trend... how quickly homes are selling...
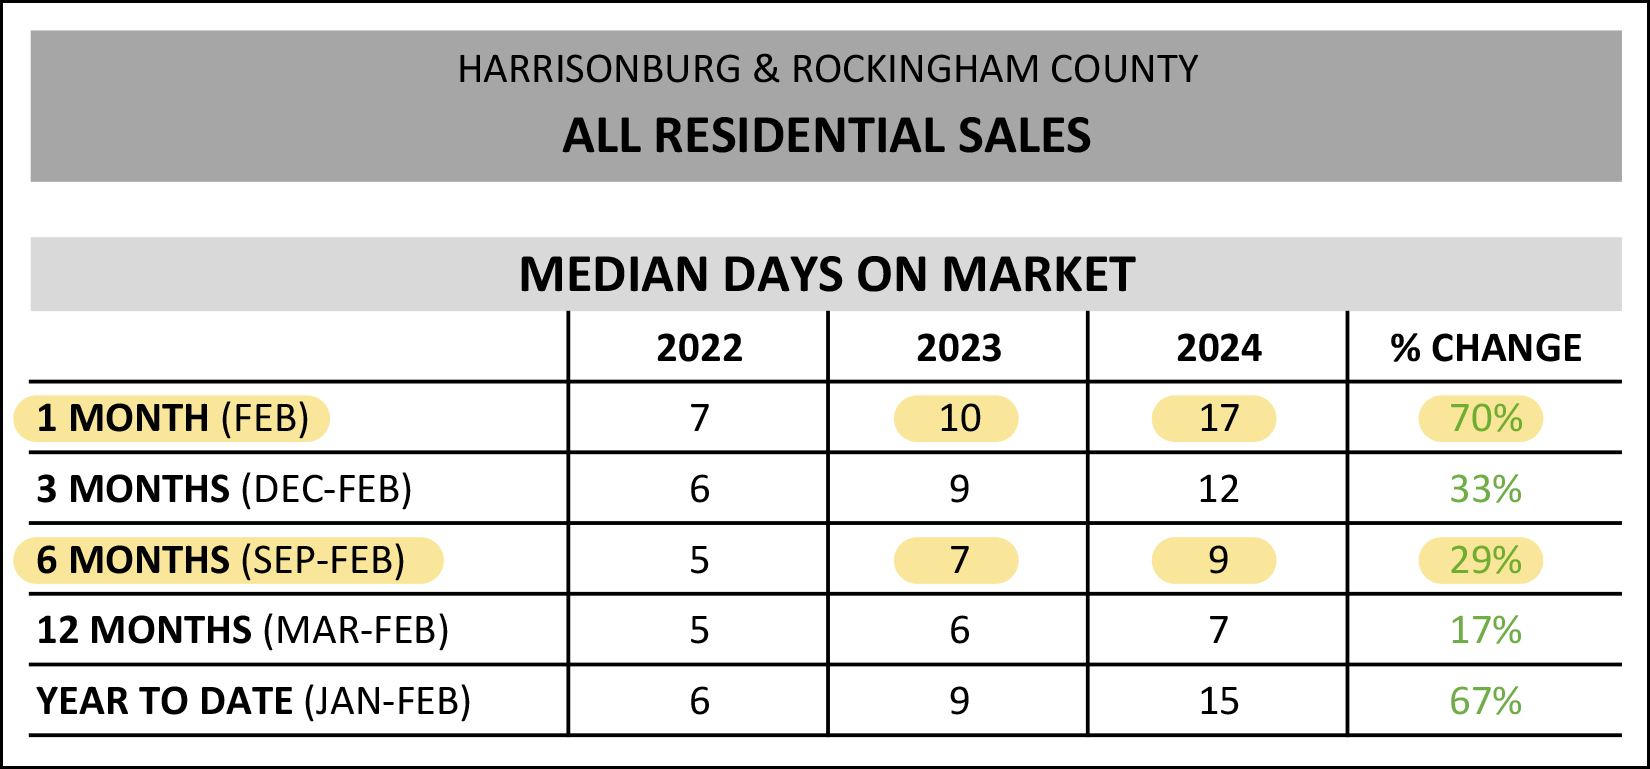
Two items to note above...
[1] I usually hesitate to focus in on just one month of data because it is hard to call anything a trend when looking at such a small data set, but, I will for the moment. Two years ago, homes that went under contract in February did so in a median of 7 days. Last year that was a median of 10 days. This February the homes that went under contract did so in a median of 17 days. So, homes took a good bit longer to sell (go under contract) this February than in recent months of February.
[2] Furthermore, looking at the past six months (September through February) it is taking a median of nine days for homes to go under contract and this is up (slightly) from the median of seven days a year ago and the median of five days two years. ago.
So, is it taking a bit longer for homes to go under contract now than in recent years? Yes. Does it indicate a change in the market, or something else? I'll explore this a bit more further on in this report.
Next up, just a momentary pause to look at home sales only in the City of Harrisonburg...
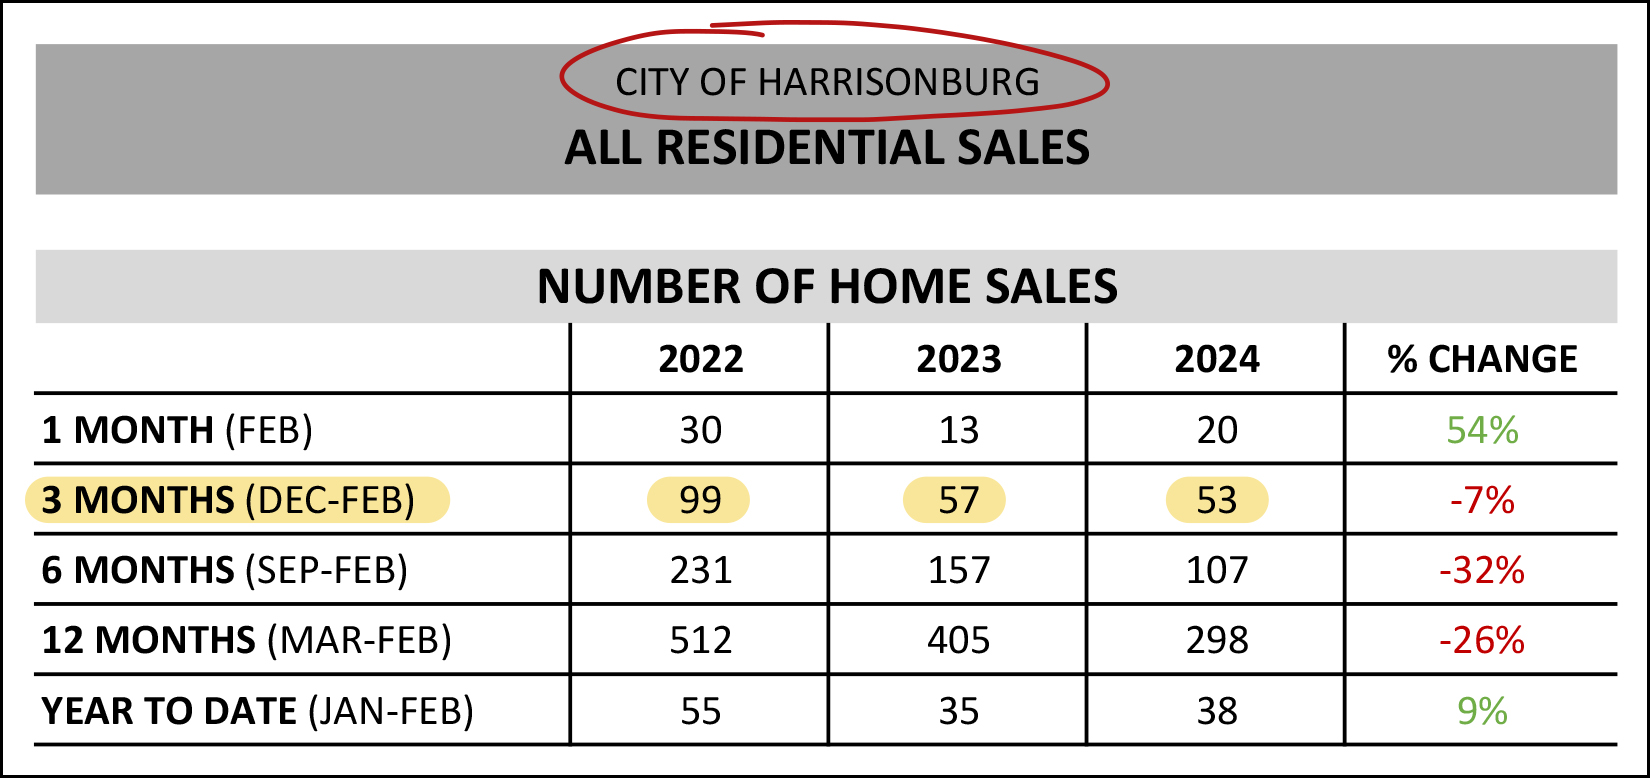
If you have been trying to buy a home in the City of Harrisonburg for the past few months you might have had a difficult time finding something to buy.
As shown above, two years ago there were 99 home sales in the three month period we just finished passing through (December to February) but last year there were only 57 home sales during that timeframe and this year, only 53.
This significant drop in the number of homes selling is not a result of lower buyer interest - but more so a result of fewer homeowners being willing to sell.
Here's hoping -- for all the would be City home buyers -- that we start to see some homes listed for sale in the City of Harrisonburg this spring and summer!
Now, on to some graphs to tell the story a bit more visually, starting with the month by month tracking of home sales in all of Harrisonburg and Rockingham County...
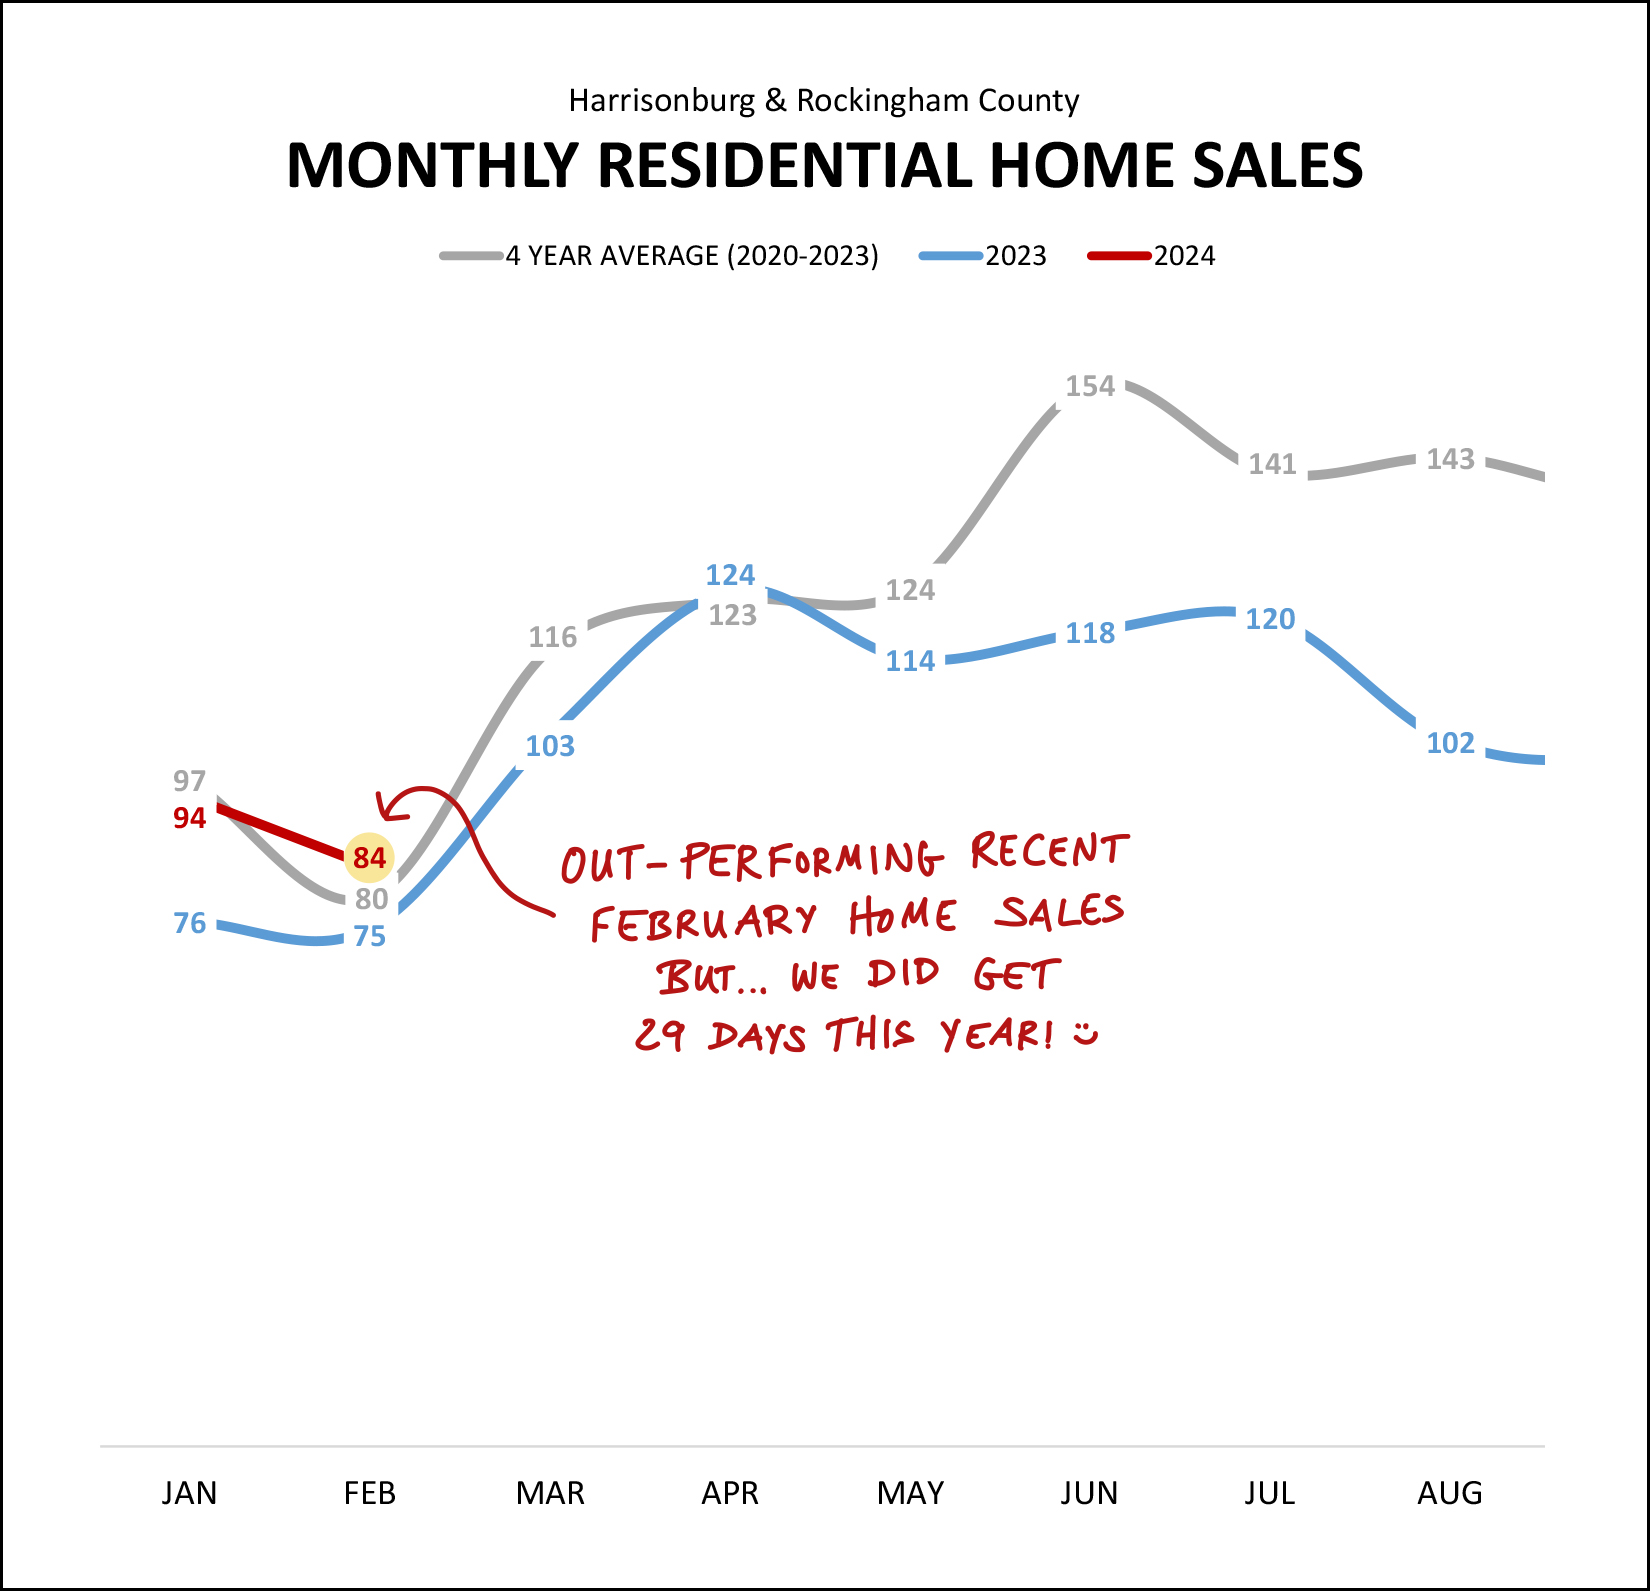
A bit of explanation on the graph above -- the red line shows monthly home sales in 2024, the blue line shows last year (2023) and the grey line shows the average of the past four years (2020-2023) for context.
Home sales this February were a good bit higher (+9) than last February -- and also higher than the average of the past four months of February. As noted above, technically we had one extra day (Feb 29) to achieve that this year, but the higher month of home sales is significant nonetheless.
Given that January 2024 was a good chunk higher than last year (+18) and February 2024 also outperformed last year (+9) it should come as no surprise that the rolling trend of annual home sales seems to be taking a turn upward...
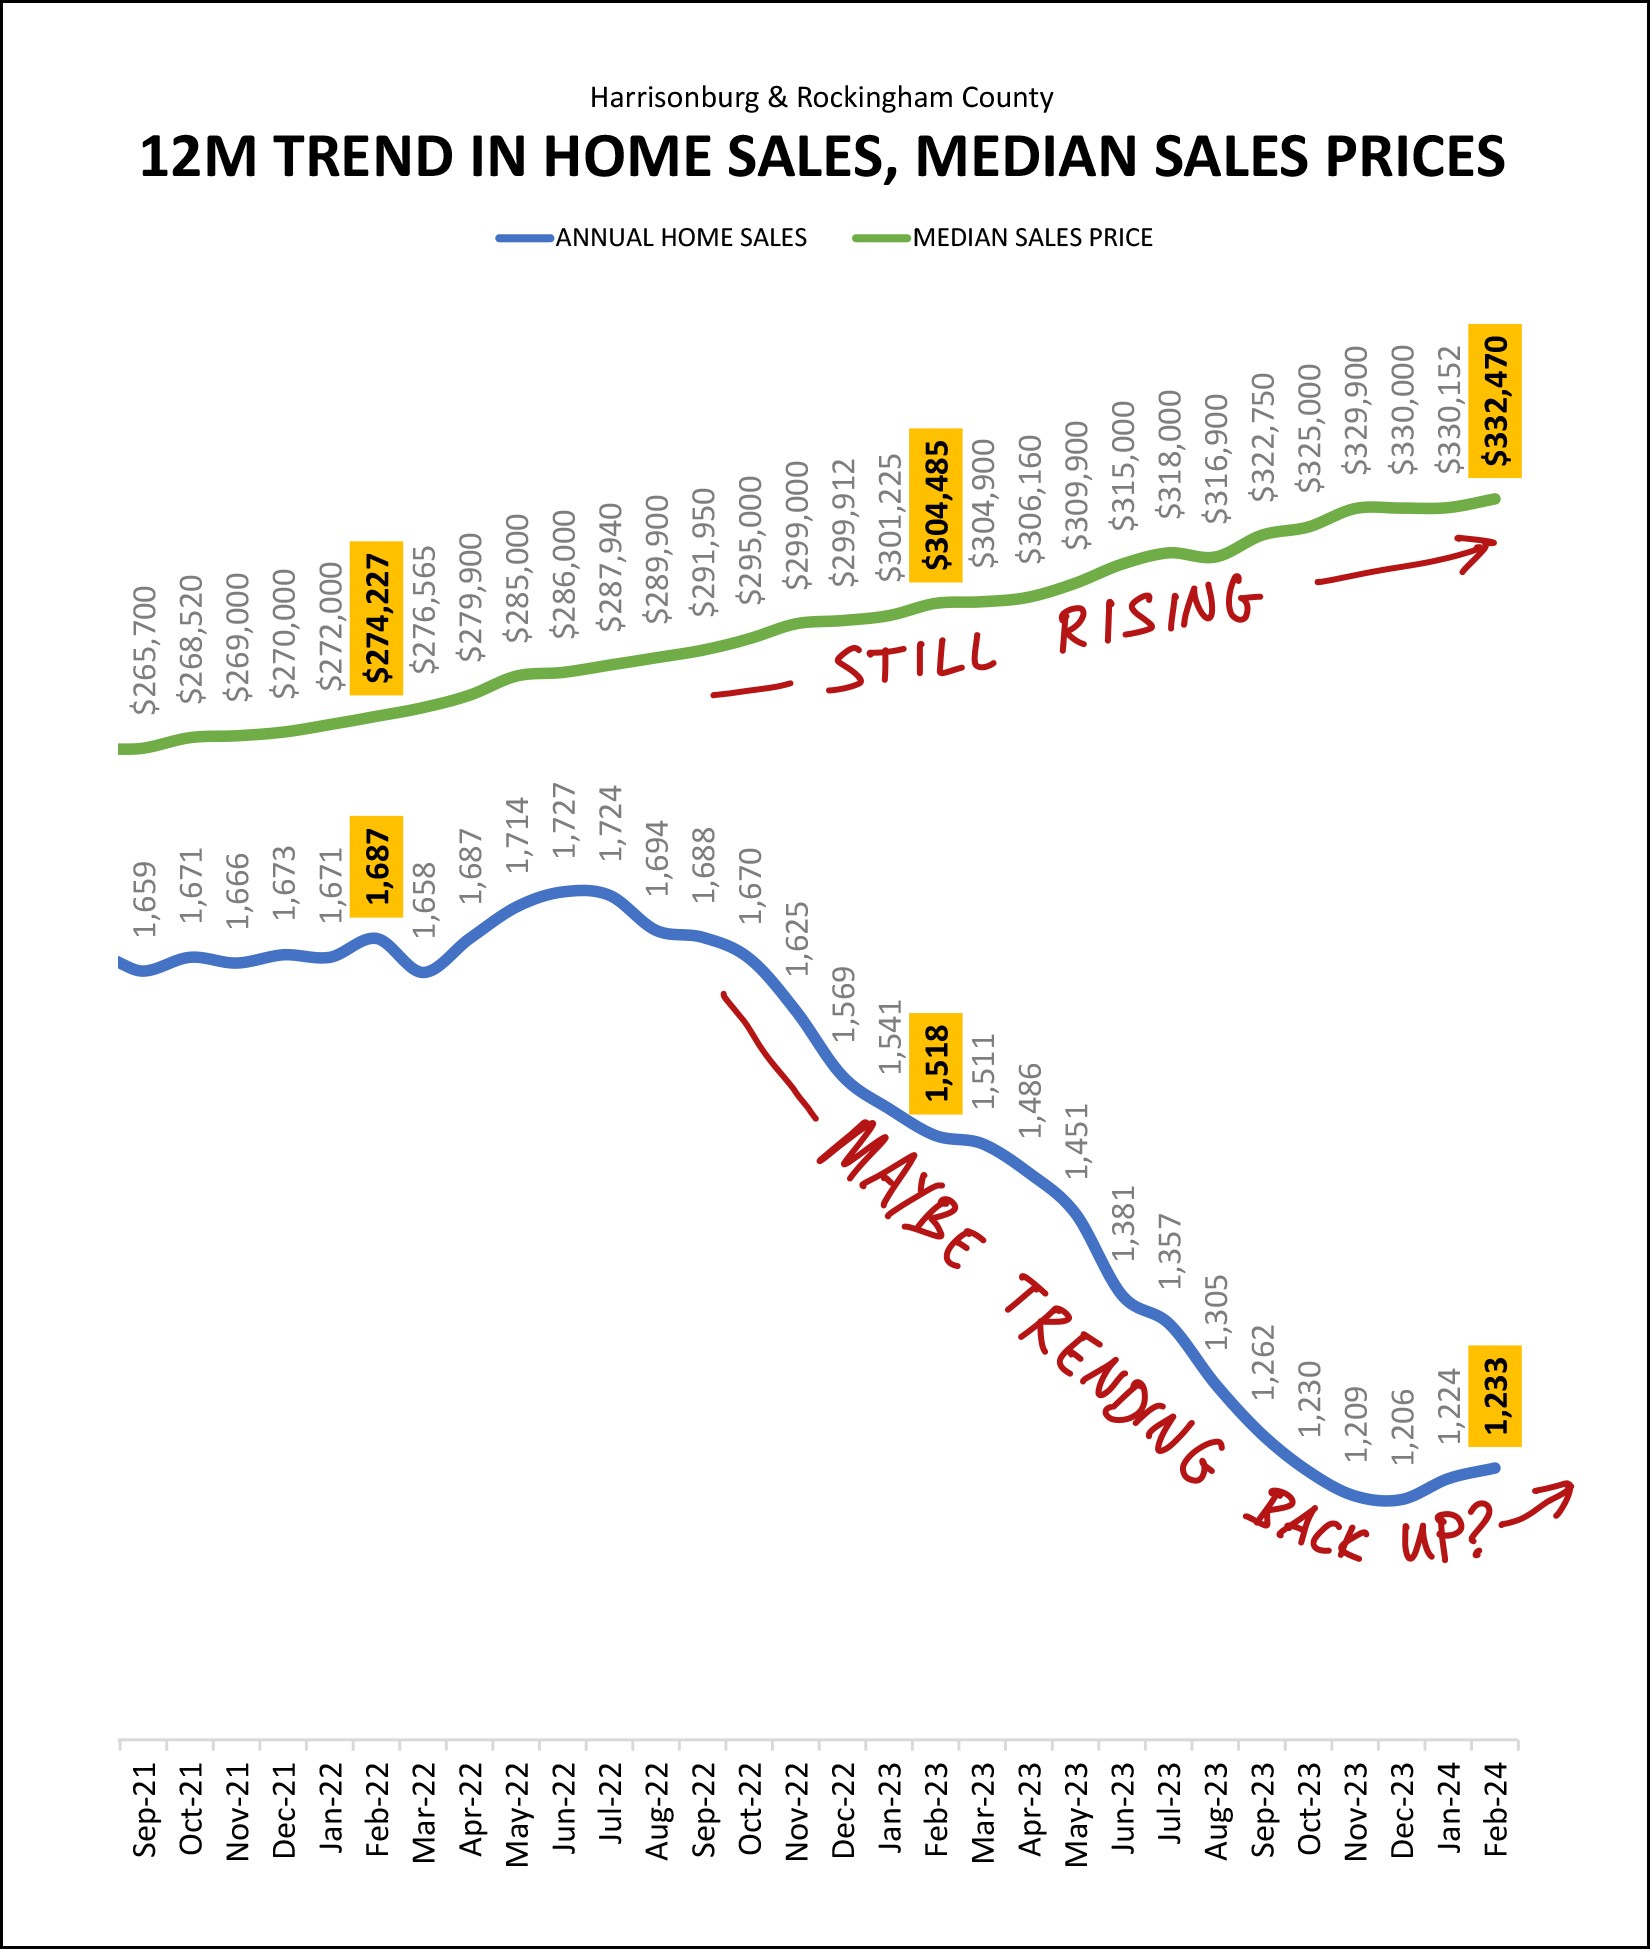
Annual home sales in Harrisonburg and Rockingham County peaked at 1,727 home sales in a year back in June 2022 and since that time have been mostly declining for about 18 months. But... maybe no longer.
As shown above, we have seen increases in the number of annual home sales for each of the past two months. Will this be a trend and will annual home sales continue to rise as we move through 2024 -- quite possibly. Stay tuned to find out as we continue through the year.
Here's another look at the year to year of home sales trends for greater context...
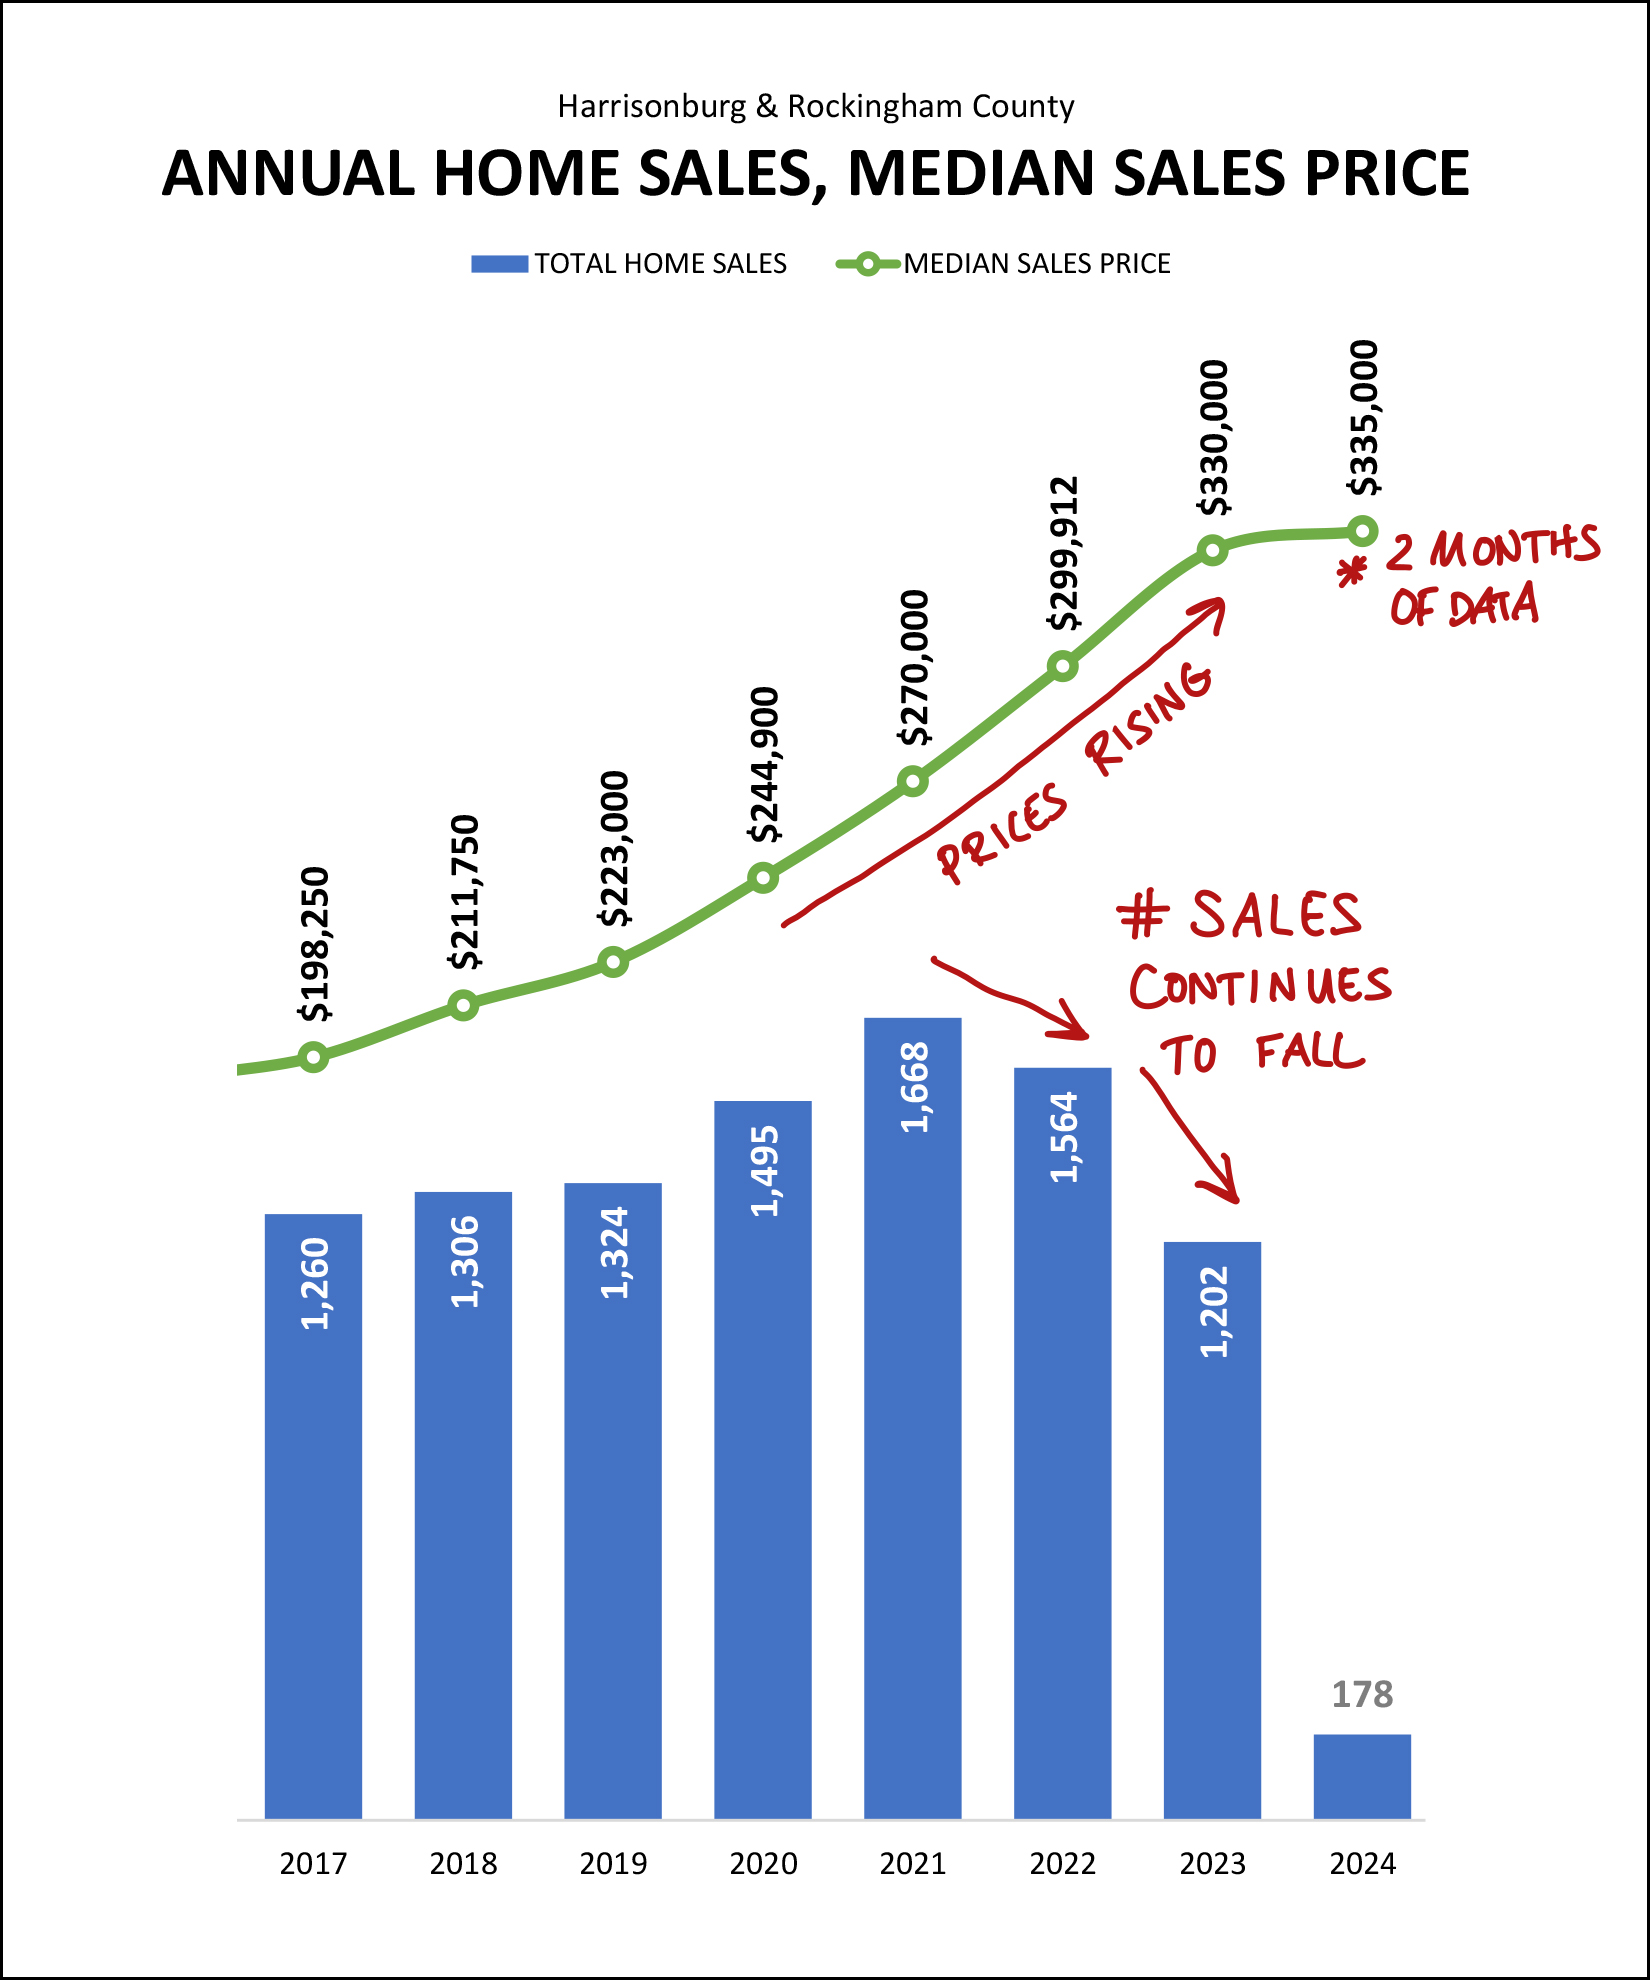
As shown above... the number of homes selling each year steadily increased between 2017 and 2021 from 1,260 sales/year up to 1,668 sales a year. After that time, though, we saw declines in the number of annual sales from 2021 to 2022 and again to 2023. Based on January and February data we could see an increase in 2024 -- but we are very early in the year still.
The same thing can be said about considering the 2024 median sales price -- we are still early in the year. As pictured in the graph above, the median sales price in our market has steadily increased from 2017 ($198,250) all the way through last year ($330,000). When looking at this year, thus far, the increase in the median sales price has been quite a bit smaller than other recent annual gains -- but we're just two months into the year. A few more months of data will give us a clearer picture of whether sales prices are flattening out at all. I suspect that median price increases are not slowing down as much as the graph above would suggest.
Now, to guess at the future a bit, here are the most recent months of contract activity...
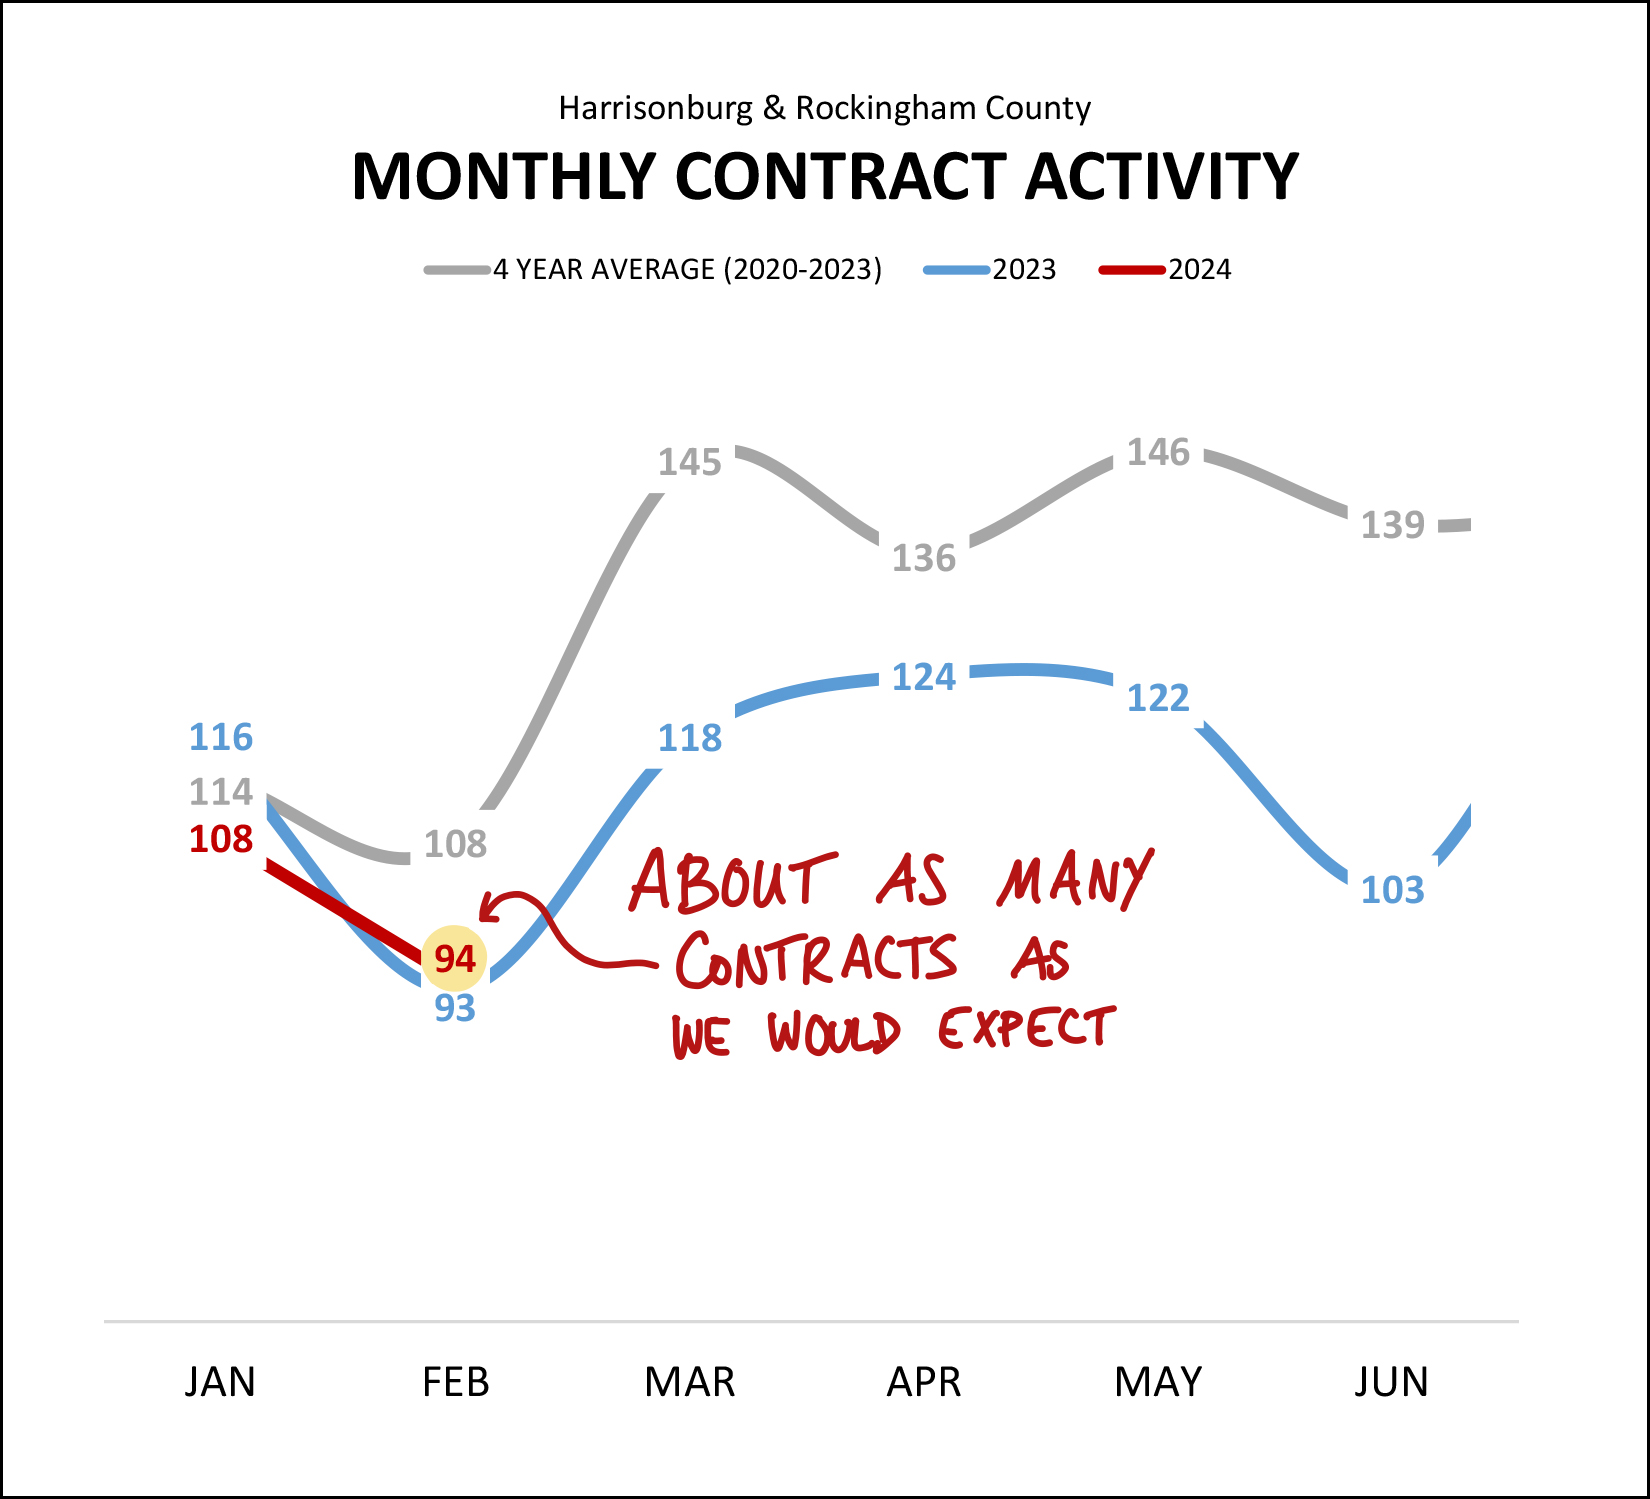
Despite more home sales in January and February this year than last, contract activity has not been telling the same story. There were fewer signed contracts this January (108) than last (116) and in February we only saw an increase of one contract between last year (93) and this year (94). If we expect to see home sales activity pick up in 2024 (over and above 2023) we'll need to start seeing more contract activity in the coming months.
One slightly different take on this is looking at how many houses are under contract at the end of each month...
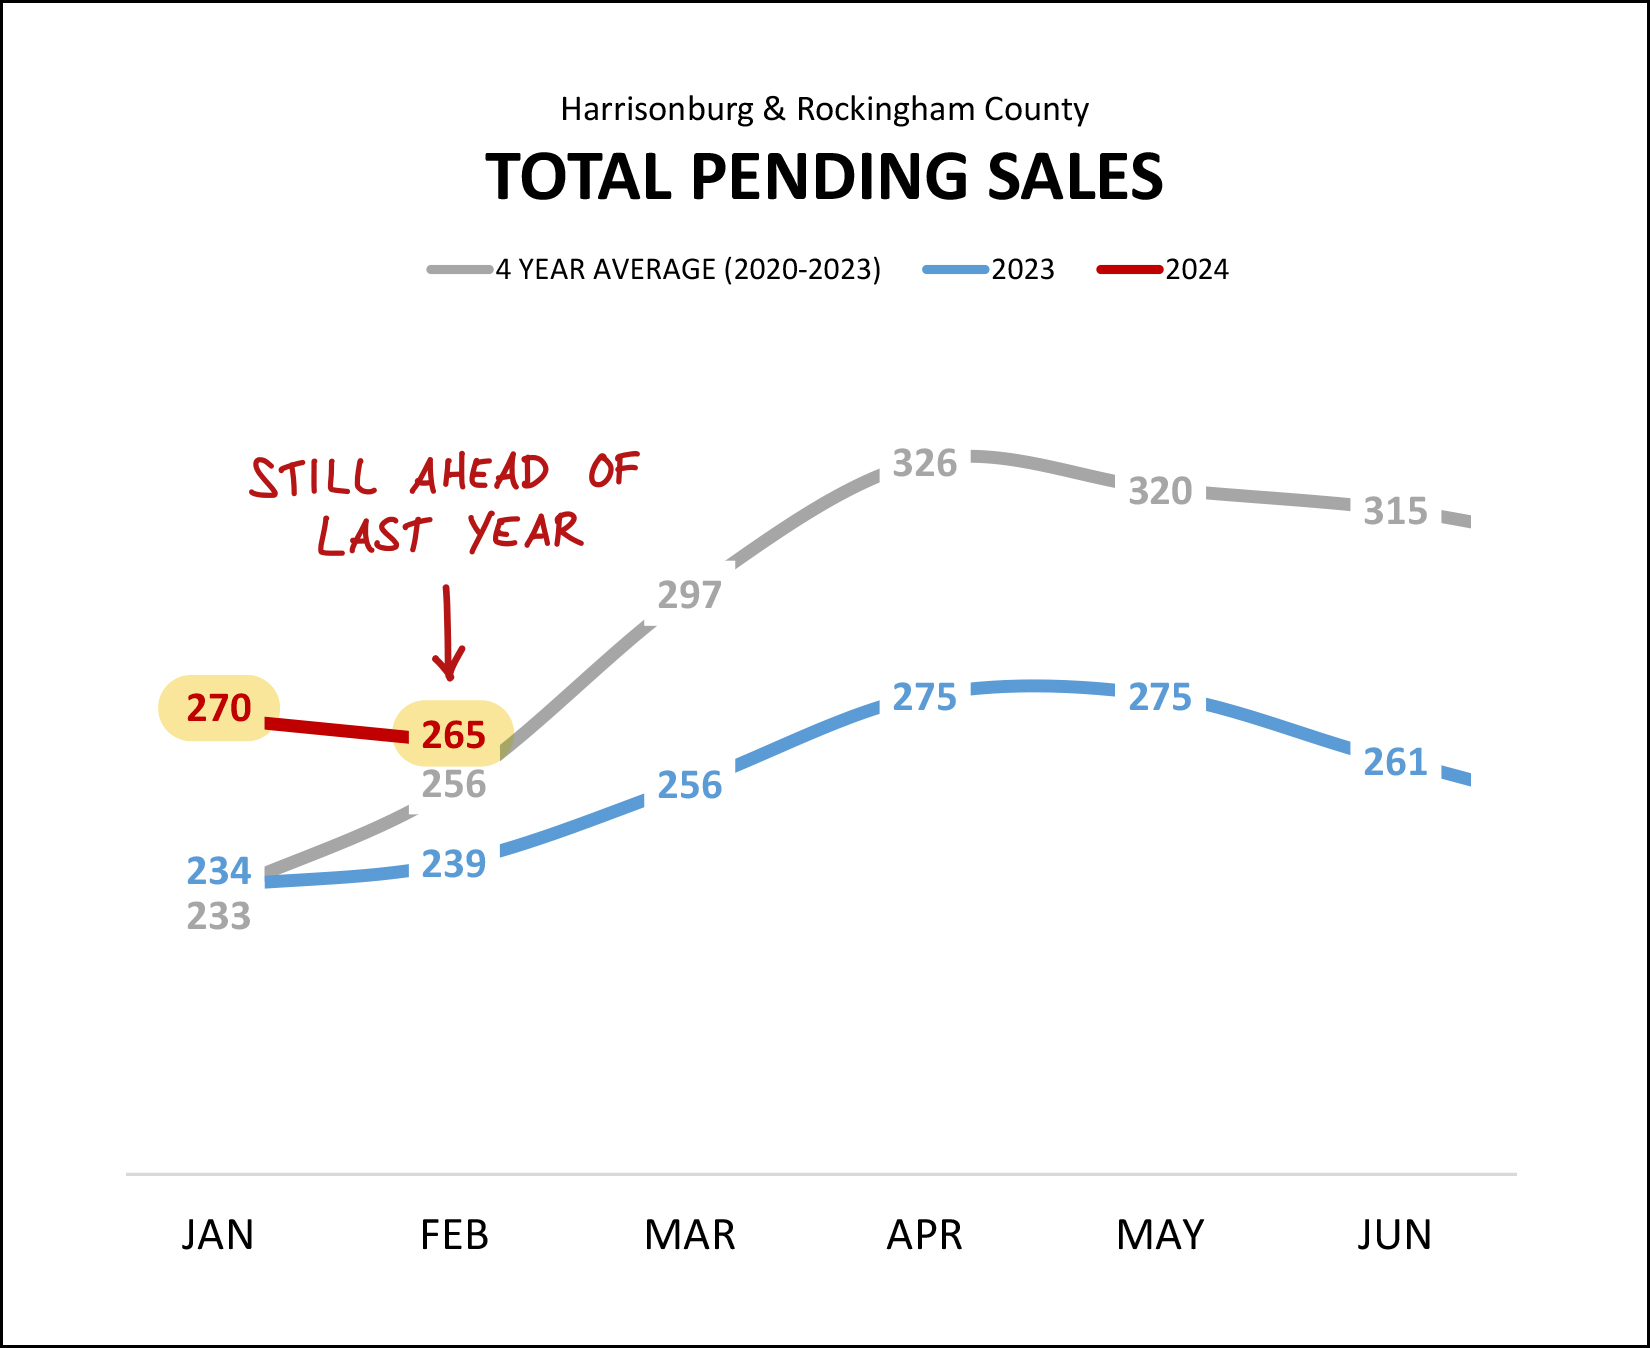
There are currently 265 homes under contract in Harrisonburg and Rockingham per the HRAR MLS, which is well above where we were last year at this time when only 239 (blue line) homes were under contract. This trend (more pending listings) is a good sign for those hoping that we will see an increase of some sort in the number of homes that are selling in 2024.
So, contract activity is a bit lower, but pending sales are quite a bit higher. Confusing. How about inventory levels, how many homes are available for sale from which buyers can select at any given moment?
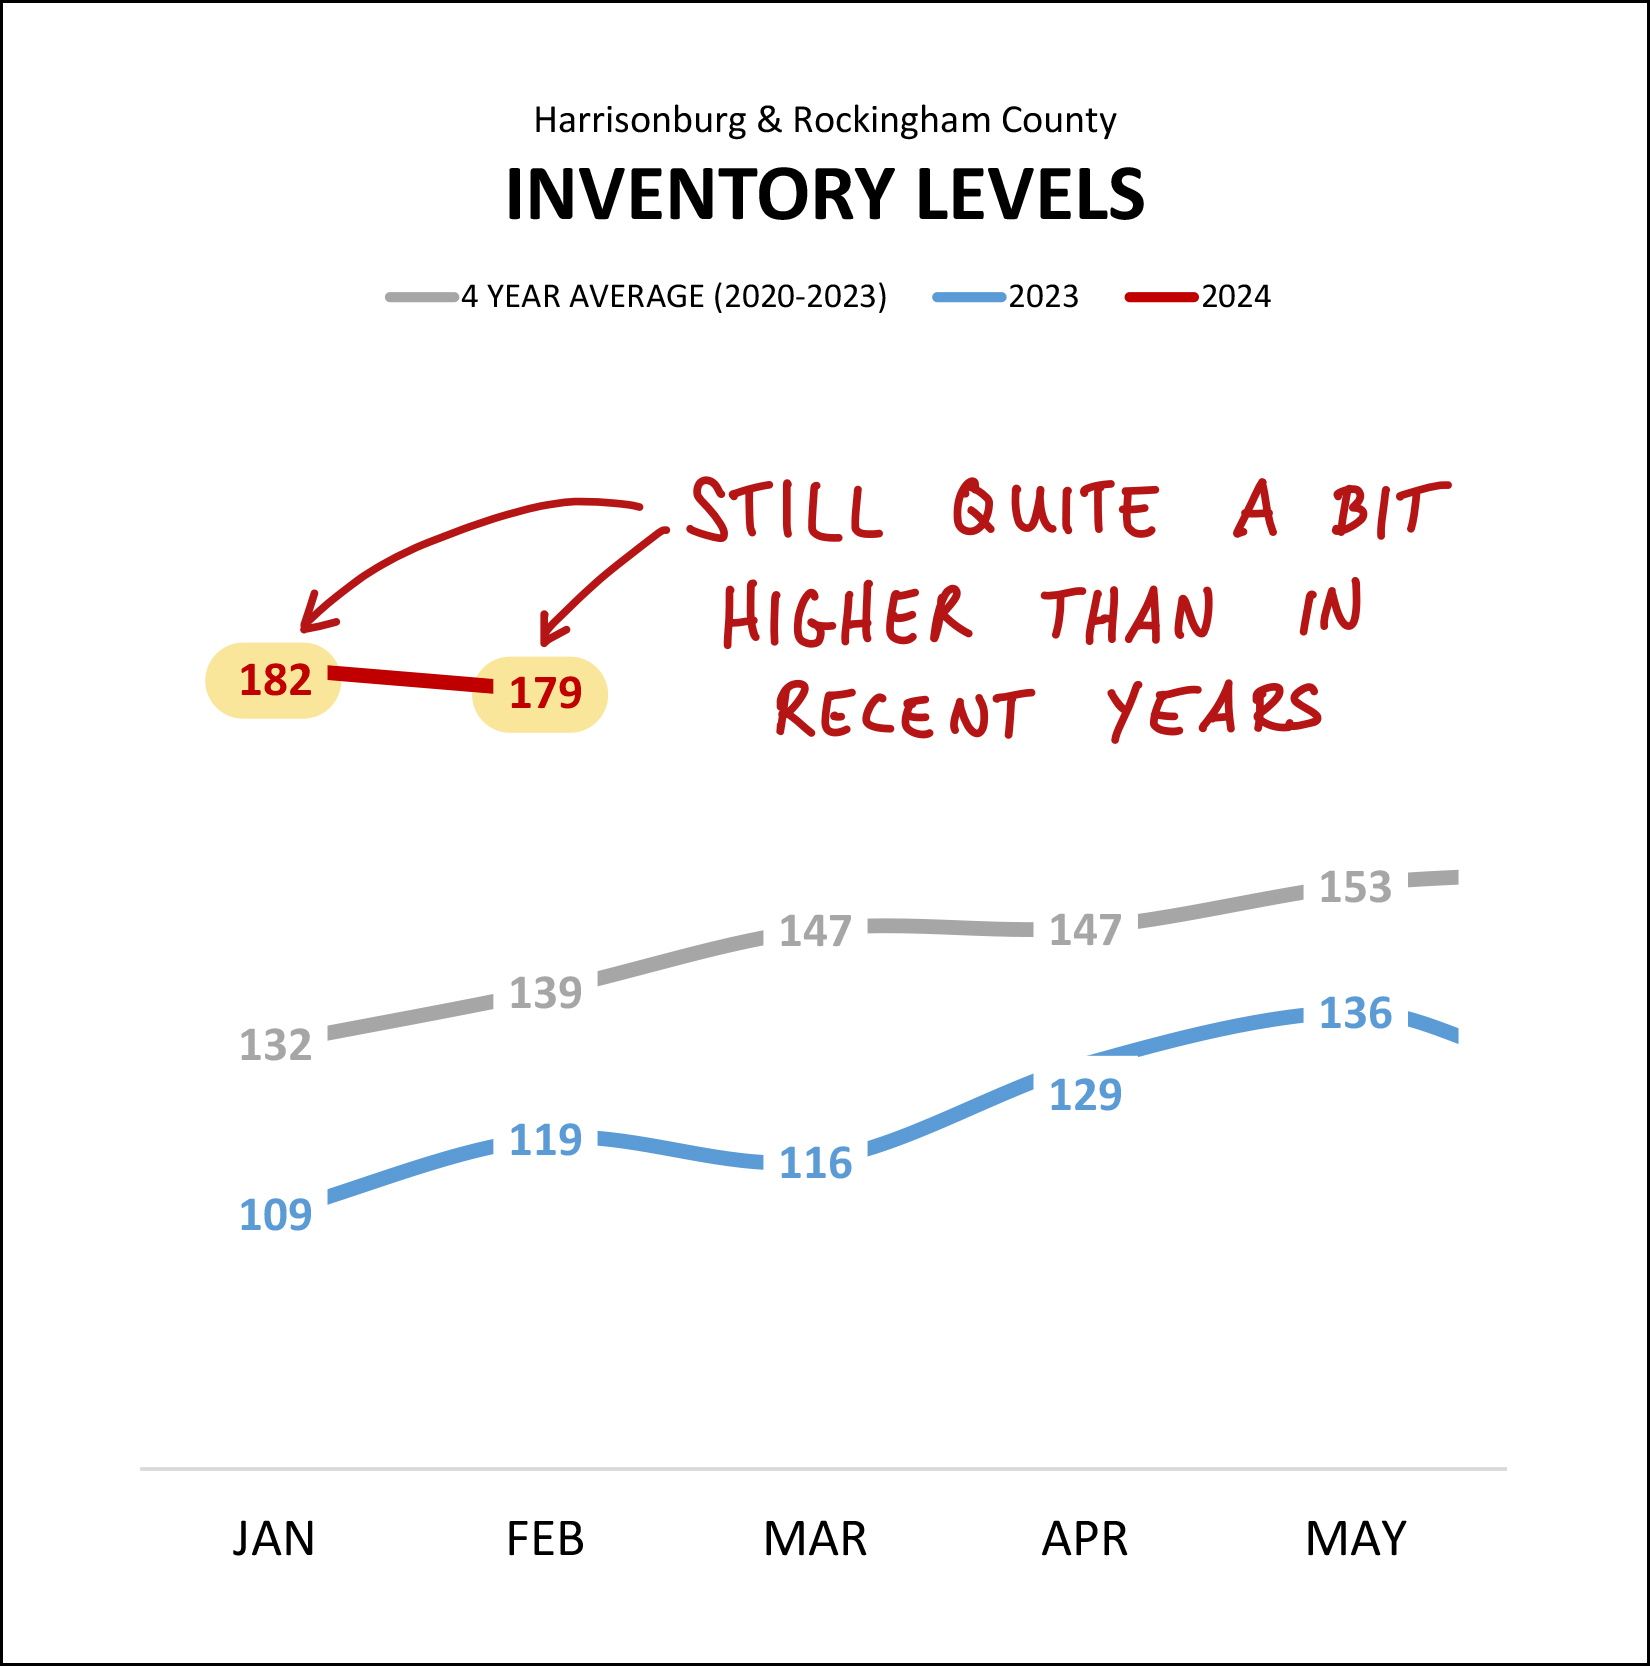
As shown above, inventory levels this year are much higher than in any recent year. There are currently 179 homes for sale, which is well above the 119 homes for sale a year ago. Of note, half of the homes currently for sale are new homes -- and the number of new homes for sale can fluctuate quite a bit from year to year as homes are often listed for sale before they are built.
I don't (darn) have a record of how many resale homes were listed for sale a year ago, but of the 179 homes currently listed for sale, only 88 of the are resale listings.
Next up, how quickly homes are (or are not) going under contract...
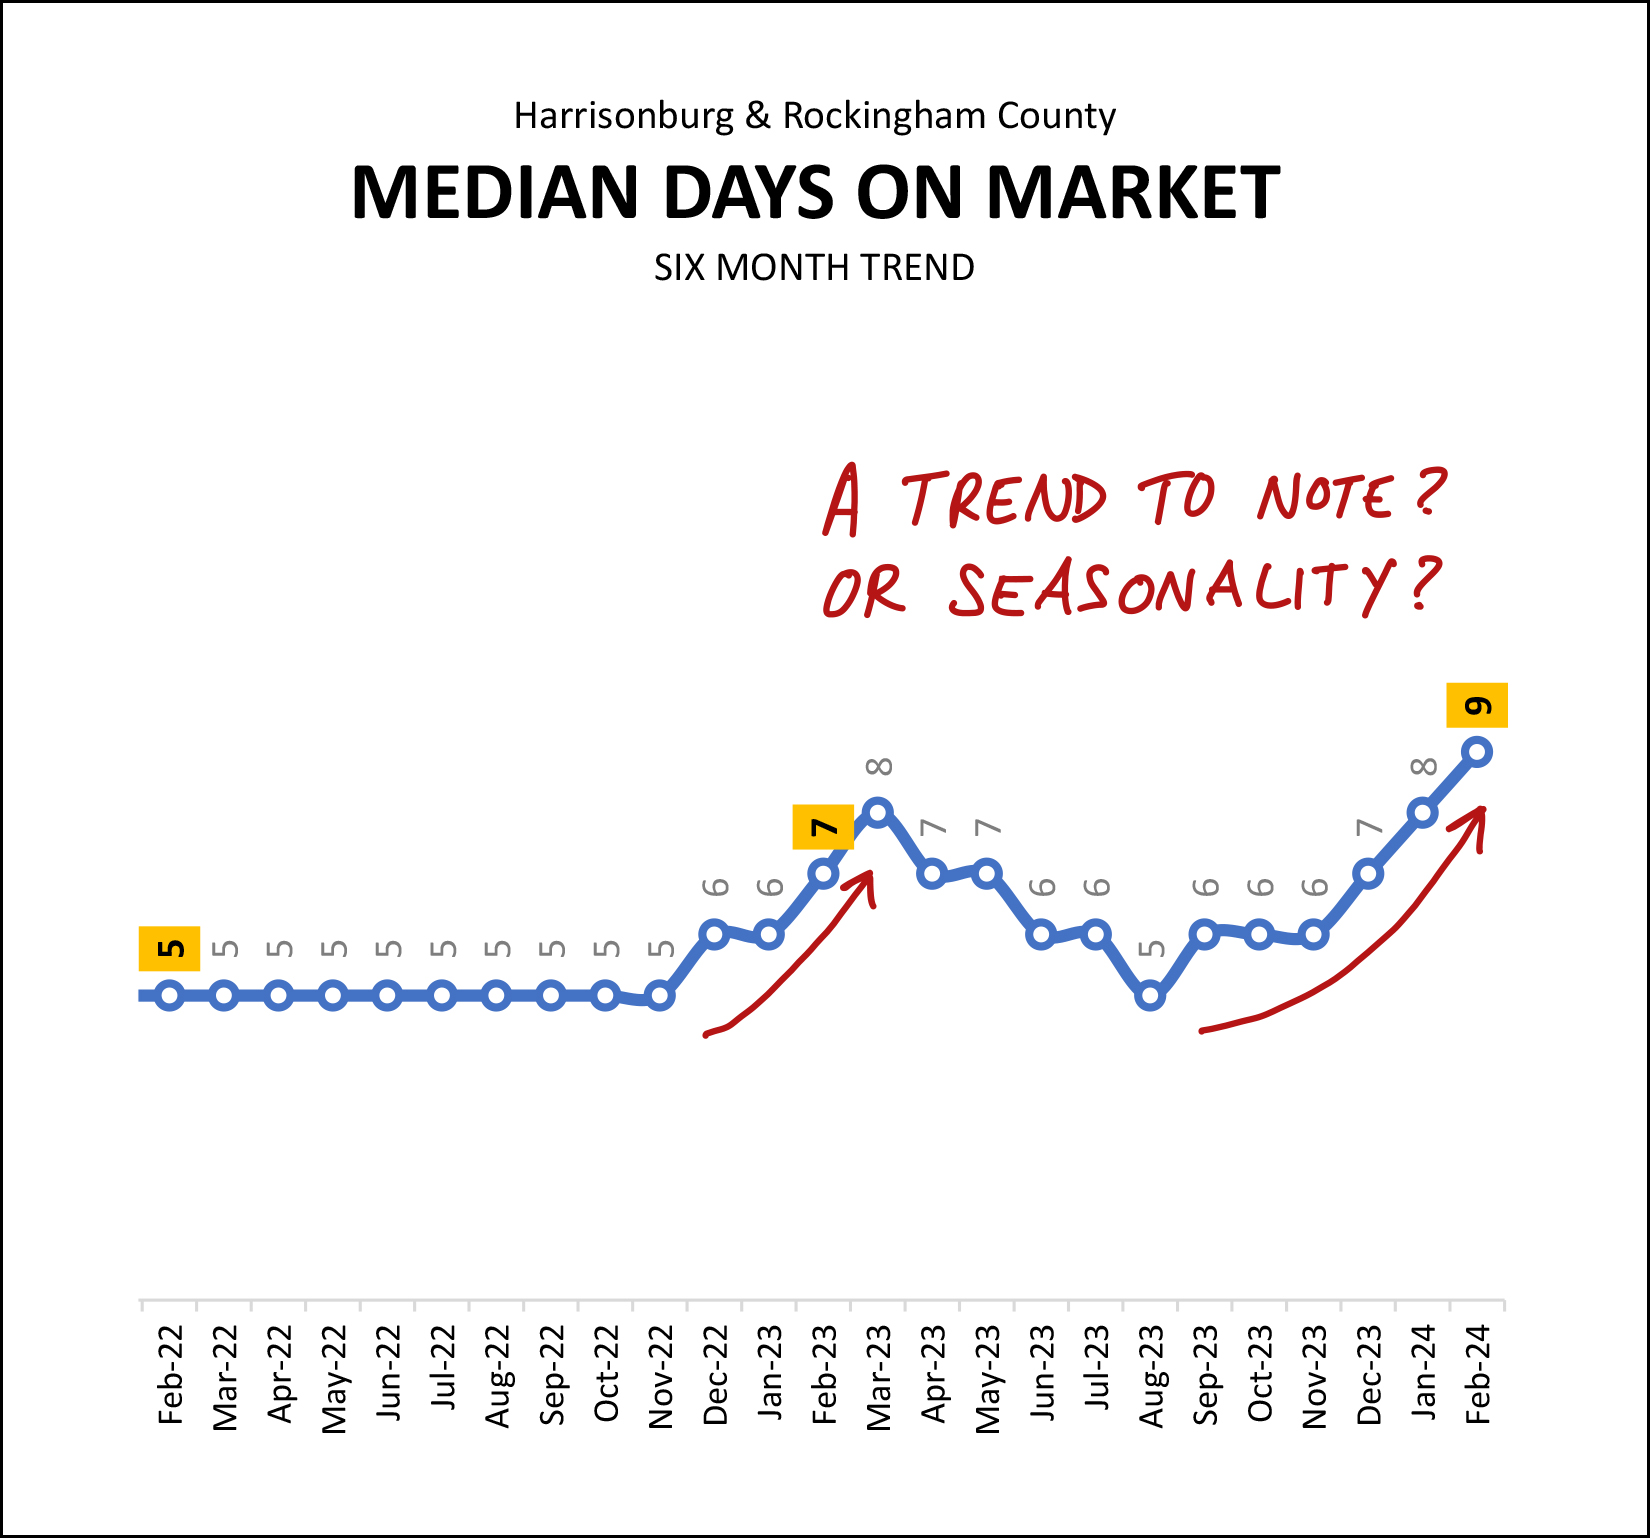
A few things can be said about the graph above...
[1] We are no longer in the era of homes going under contract at record speeds (median of 5 days) month after month after month after month. That's just not where we are right now.
[2] The increase in the median days on market over the past six months might be a sign of a trend -- or it might merely be seasonality. The market might be slowing down (as far as how quickly buyers are contracting to buy homes) or we might start to see this metric increase each winter and then decline again in the spring and summer. The last time we saw the median days on market increase to 7 days (instead of 5) was last winter (Feb 2023) and we saw it again this winter. Let's see if this metric starts to decline again over the next few months.
Finally, mortgage interest rates...
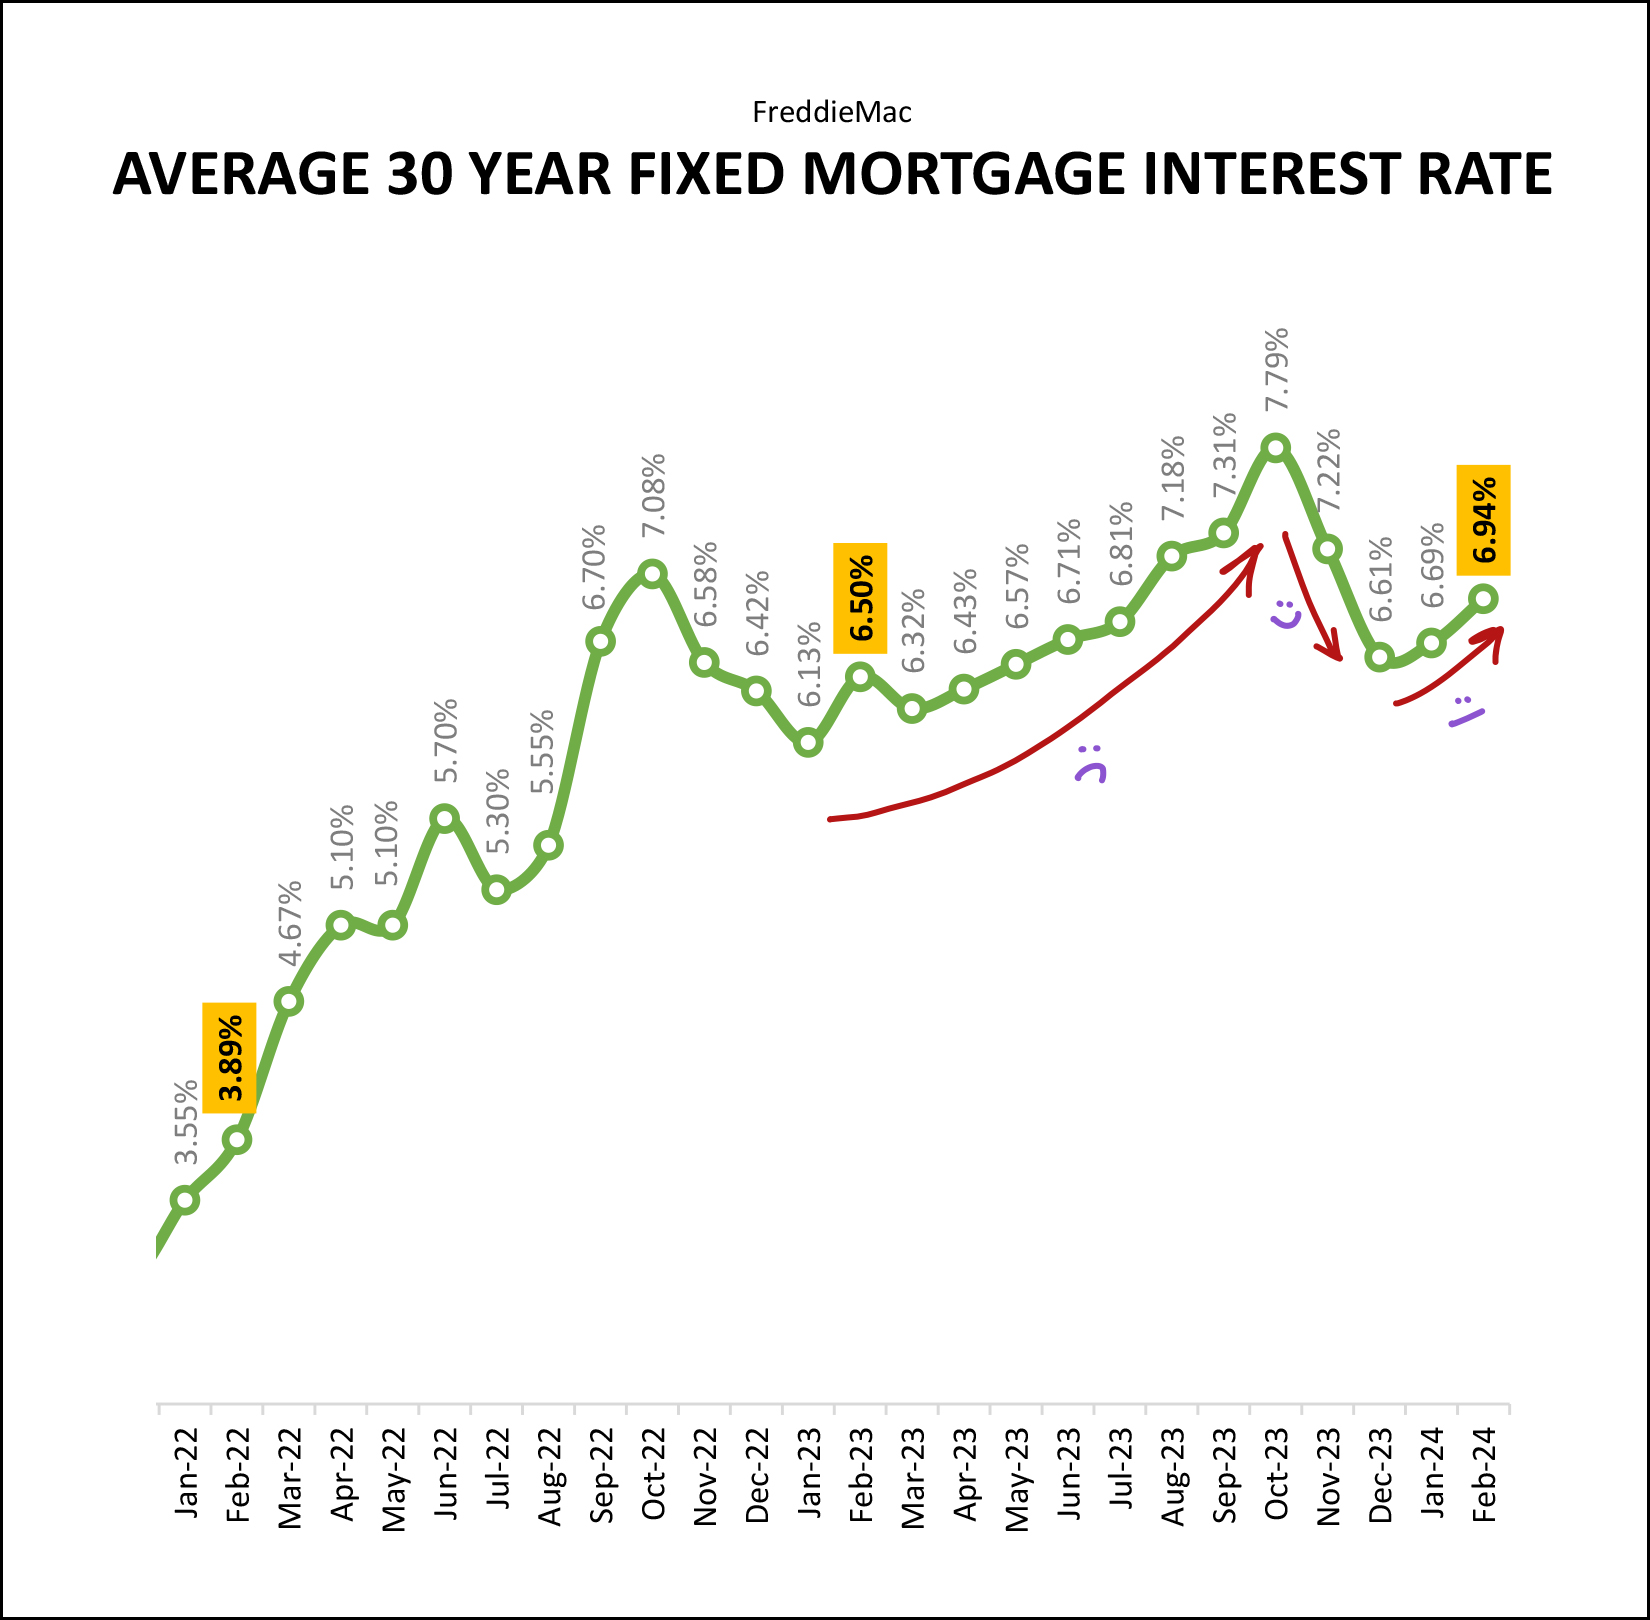
What a range of emotions home buyers have felt over the past year and a half...
Mortgage interest rates steadily rose from 6.13% in January 2023 to 7.79% in October 2023. Ugh.
But then rates fell for several months from 7.79% in October 2023 down to 6.61% in December 2023. Yay.
And then... they crept back upward for each of the past two months to 6.94% where they closed out at the end of February.
I suspect we will continue to see mortgage interest rates between 6.5% and 7% for much of 2024 -- though perhaps they'll get down closer to 6% by the middle to end of the year.
And that, folks, brings us to the end of this month's overview of trends in our local housing market. If you want more (there's more) you can check out an even fuller set of charts and graphs here.
Otherwise, let's get ready for SPRING!
Home buyers - you will likely see more homes listed for sale over the next few months, hopefully resulting in more and better options for just the right house for you to pursue. Touch base with your lender for an updated preapproval letter if you haven't talked to them recently, and get ready to go see new listings right away when they hit the market.
Home sellers - you will likely still find a solid group of interested buyers for your home - depending on your price range and location, and even more importantly, depending on how well you prepare your home, how appropriately you price it, and how thoroughly and professionally we market it.
If you are thinking about selling your current home, or finding a home to buy this spring, I'd be happy to help you understand the market and work to accomplish your goals of selling or buying. Touch base anytime so we can set up a time to chat by phone or in person.
You can contact me most easily at 540-578-0102 (call/text) or by email here.
Happy Pi Day, soon. Happy Spring, soon.
