Inventory
| Newer Posts | Older Posts |
Low Inventory Levels Not (yet?) Affecting Pace of Home Sales |
|
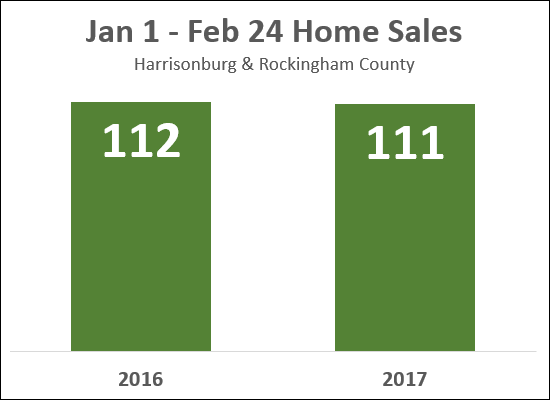 Home sales have increased 15% over the past year -- while at the same time, inventory levels have dropped 31%. This has left me with at least some lingering concerns about whether extraordinarily low inventory levels could limit the pace of home sales in 2017. So far, my concerns are unfounded. As shown above, when examining January 1 through February 24 home sales, there has not been a noticeable change in the pace of home sales. Stay tuned to see how these dynamics continue to adjust as we progress through the year. | |
January Inventory vs. Past Year of Home Sales |
|
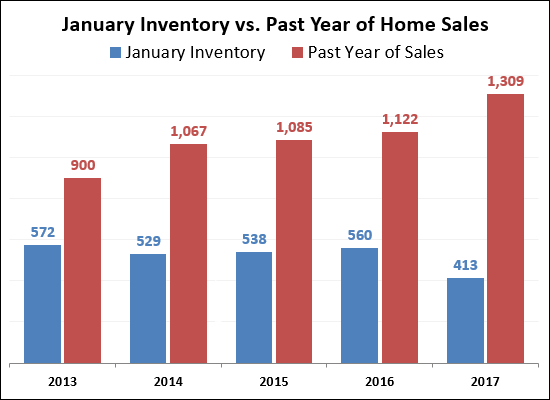 For the past four years (2013, 2014, 2015, 2016) and even some before that, we started off the year with enough homes actively listed for sale to last us for right around six months -- or a bit longer. This balance (a six month supply of housing inventory) is considered by many analysts to be an indicator of a balanced housing market. Well, this year (2017) is quite a bit different. Inventory dropped 26% over the past year, and sales rose 17%. As you would, thus, expect - we're starting off the year in a slightly different spot, as shown above. This year, the amount of homes actively listed for sale (413) will only last us 3.8 months based on last year's pace of sales -- which is quite a bit different than the balance we have seen at the start of the year for the past four years. So -- this year will be interesting. Will sales decline because there aren't enough homes for buyers to consider? Will prices rise as many buyers fight over a small number of listings? Will we see just as many home sales last year, but with an even lower "days on market" as each new listing gets snapped right up by a buyer? Stay tuned! | |
Which price range of homes have been hit the hardest with reduced inventory levels? |
|
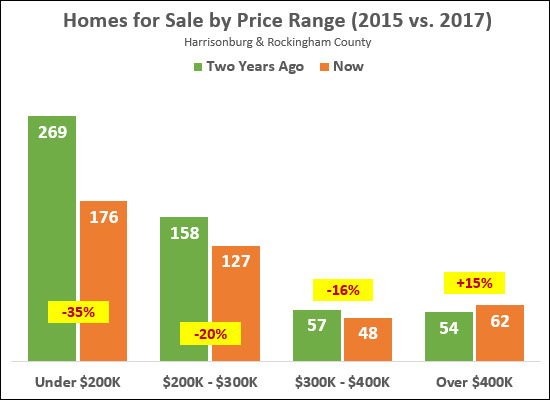 As shown above -- all price ranges have not been affected in the same way with inventory changes over the past two years. The most affordable price range (under $200K) has been the hardest hit -- with a 35% decline in the number of homes for sale. Part of this is an inventory issue (homes not being on the market) but part of it is also an appreciation issue. Homes have increased in value over the past two years, pushing some under $200K homes up into the $200K-$300K price range. We are also seeing declines in the $200K-$300K price range (-20%) and the $300K-$400K price range (-16%). In fact, the only segment of the market where we have seen an increase in the number of homes for sale is in the $400K+ market. In 2017, I believe that the under $200K buyers will have the most challenging time finding a home that works well for them. You can find out more about the Harrisonburg and Rockingham County real estate market by visiting....  And here are two handy references to prepare yourself to buy or sell a home.... | |
New home sales are increasing, but is it happening fast enough? |
|
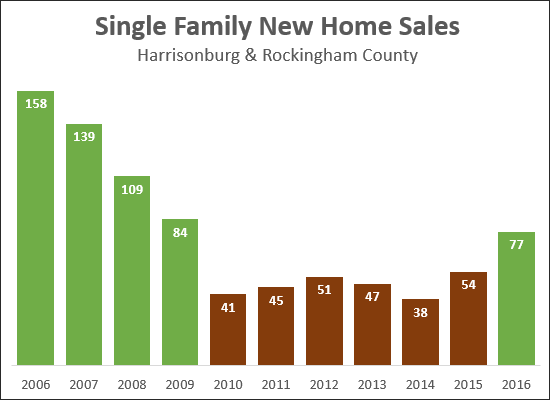 After six years of rather stagnant new home sales (41-54 per year) between 2010 and 2015, we are finally starting to see more new home sales in 2016. The graph above shows the number of new single family homes are sold through the MLS for each of the past 10 years. As you can see, we may get close to returning to 2009 sales levels depending on how many closings take place this December. Beyond being excited that these sales are increasing, I am also wondering if they are increasing "fast enough" relative to the inventory shortages we are experiencing. The pace of home sales is increasing, the inventory of homes available for sale is decreasing. One of the only ways for our market to meet this increasing demand for homes is for more home builders to start building spec homes again. I am hopeful we will see more (reasonably priced) spec homes being built in Harrisonburg and Rockingham County during 2017. You can find out more about the Harrisonburg and Rockingham County real estate market by visiting....  | |
Inventory Declines 38% YOY Under $200K |
|
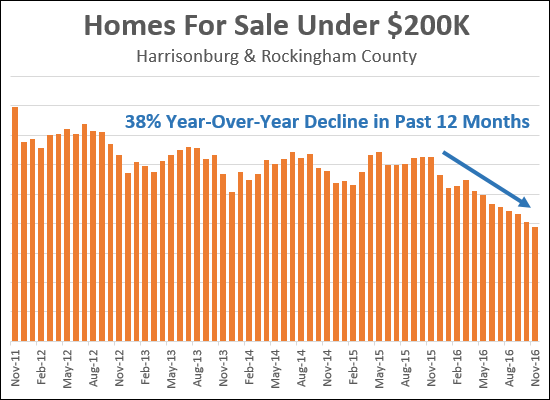 We have established that there aren't many homes for sale right now, but the under $200K market has seen some of the largest changes in inventory levels. As shown above, the 194 homes for sale under $200K right now marks a 38% decline over the 314 homes that were sale at this same time one year ago. I think we need to see some further new construction under $200K (and in some other price ranges) to help with these low inventory levels. Re-sale homes alone are not going to cure declining inventory levels. | |
Should You Take Your House Off the Market for Winter? |
|
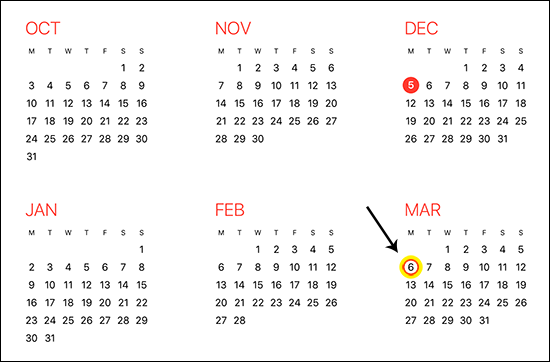 In some ways, NO, you should NOT take your house off the market -- because there is a historically LOW number of homes for sale right now. And yet, still, some folks will take their homes off the market for the winter. Our local MLS requires a house to be off the market for 90 days before the "Cumulative Days on Market" statistic resets. So, if you take your house off the market today, you could put it back on the market on the first Monday in March (March 6, 2017) and have that statistic reset. During these 90-ish days of being off the market, we will want to talk about price, condition and marketing....
| |
Fewer and Fewer Homes for Sale in Harrisonburg, Rockingham County |
|
 I am not kidding around when I tell my buyer clients that there have never been fewer options of homes to buy than RIGHT NOW! I have been tracking housing inventory since February 2008, and we have never (NEVER) seen inventory levels this low. There are currently only 468 homes for sale. Oh, and the pace of buying activity is increasing. Oh, and the population is increasing. I'd say that we have a shortage of housing supply -- and some further new construction is needed in this area! Find out more about the Harrisonburg and Rockingham County real estate market by visiting....  | |
44% Fewer Homes for Sale in Harrisonburg, Rockingham County |
|
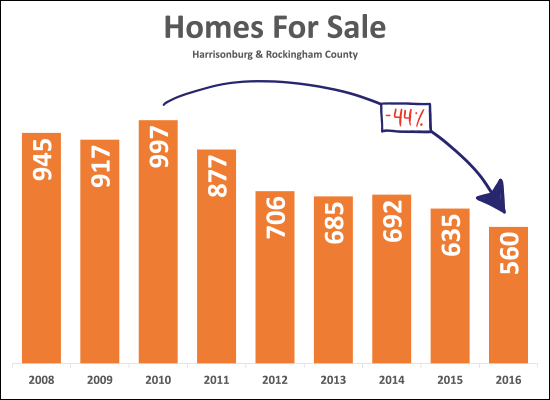 Buyers are finding fewer and fewer options of homes to purchase in Harrisonburg and Rockingham County as inventory levels continue to decline. The graph above shows the number of homes for sale in early September for each of the past eight years. There are 44% fewer homes for sale now as compared to at the peak of inventory levels in 2010. Even looking over the past year, there has been a 12% decline in inventory. These low inventory levels are frustrating buyers in many price ranges, giving them limited options of homes to purchase and SOMETIMES creating multiple offer situations. If you are getting ready to sell your home, it is important to understand the dynamic of how many other home sellers you will be competing against, so we will want to take a look at inventory levels in your particular segment of the market. | |
Market Balance By Price Range |
|
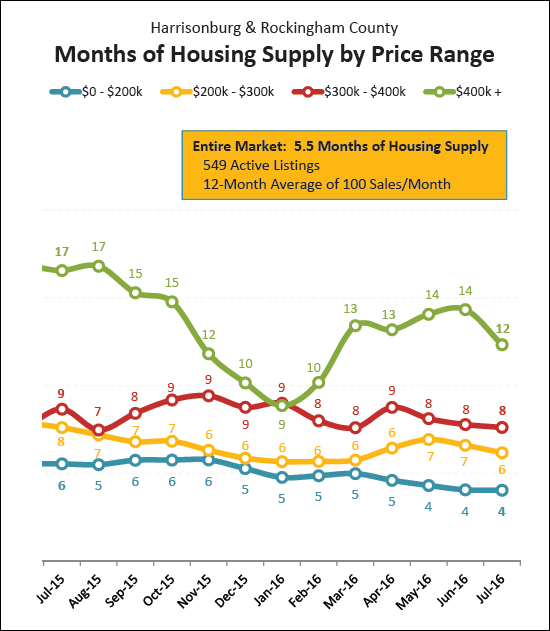 Many housing market analysts consider a six month supply of homes for sale to be an indication of a market that is balanced between buyers and sellers. As such, and based on the information presented above, it would seem safe to say that....
For even more analysis of our local housing market, check out.... | |
Buyers have fewer and fewer choices of homes to purchase these days |
|
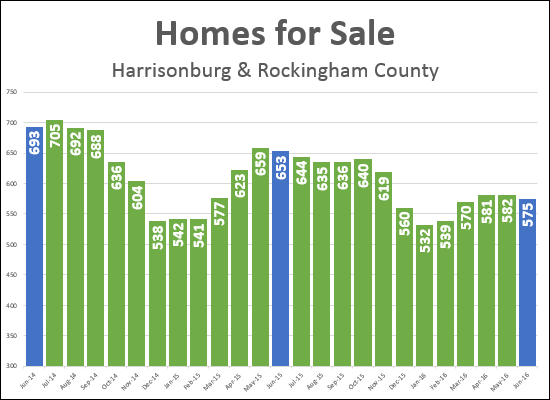 click here for a larger image Buyers have fewer and fewer homes to choose from these days. The blue bars above show that there were 693 homes for sale at this time two years ago -- 653 homes for sale at this time one year ago -- and only 575 homes for sale today! This decline in inventory has helped create a more balanced market -- but can also lead to a frustrating home search for many buyers, depending on their desired price range and location. | |
Buyers likely to have many more choices in coming months |
|
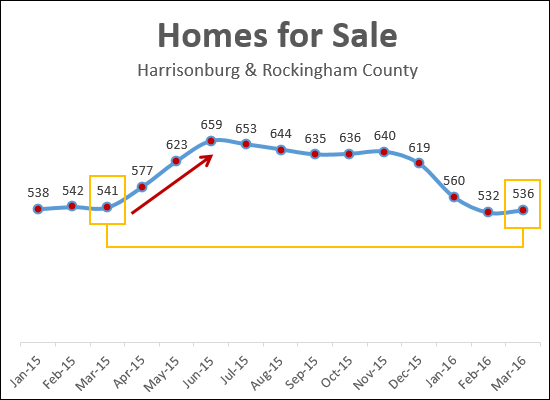 If this year is like last year (and just about every year, ever) buyers will have many more choices in coming months. As shown above, inventory levels are likely to steadily increase over the next three to their peak in June. If you are hoping to know about every new listing, as soon as it hits the market, check out NewListingsInHarrisonburg.com where you can sign up for email alerts for new listings. | |
January Inventory vs. Full Year Home Sales |
|
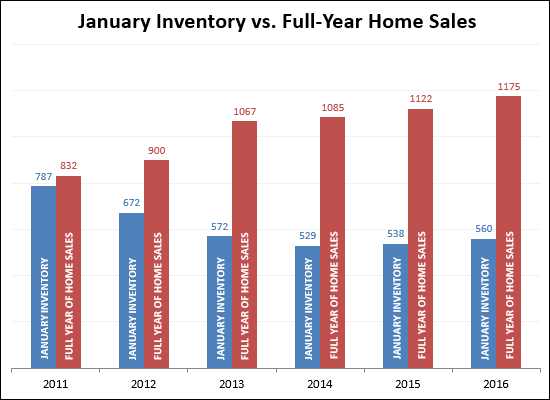 A few short years ago there were enough homes on the market in January to last us nearly an entire year. In January 2011, there were 787 homes on the market and only 832 buyers would go on to buy a home that year. Things have looked at bit different over the past few years, with lower (529-560) levels of inventory at the start of the year, and higher (1085-1175) home sales in the year that followed. ** Please note: The 2016 home sales shown in the graph above are a projection, not a promise. :) | |
Inventory levels are quite low, but it is quite normal |
|
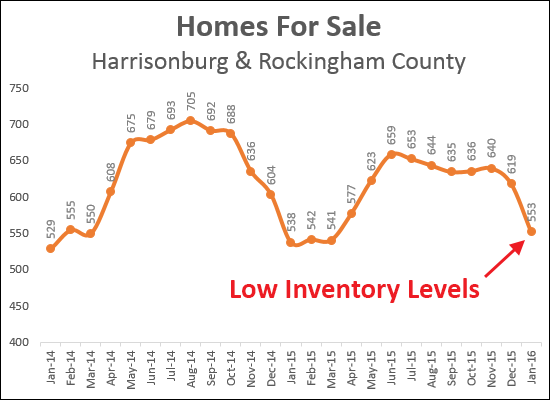 Inventory levels are quite low right now -- there are only 553 homes for sale -- but this is quite normal for this time of year. Several of my clients have recently commented on the very low number of new listings they have seen in the past month. Hopefully we'll see some soon, though last year inventory levels stayed quite low from January through March. | |
Buyers have fewer, and fewer, and fewer choices. |
|
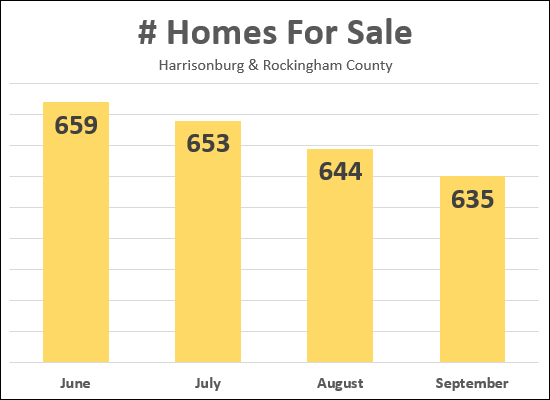 Despite my reminder that while summer is over, it is still not too late to get your house on the market, we continue to see inventory levels declining. This is typical -- not unusual at all -- but certainly frustrating for some Fall buyers who would love to have more homes to choose from not fewer. Inventory levels are likely to continue to decline through the end of the year, and are not likely to see a measurable increase from their low Winter levels until we get to March or April. | |
Declines in housing inventory much more severe in City than County |
|
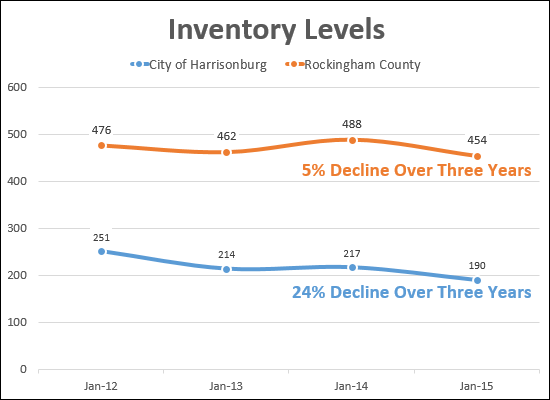 As Karl pointed out, the declines in inventory levels over the past few years have been more significant in the City than in the County. And as Charles pointed out, this could be a great time for someone to start building some spec homes. 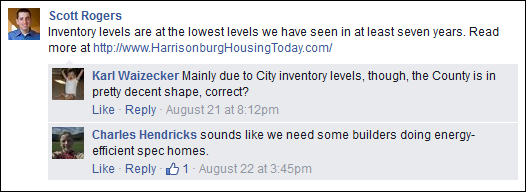 If you are a builder, and are considering building some spec homes, let's chat about what would work best in the current market -- and where you might build it. | |
Inventory levels are at the lowest levels we have seen in at least seven years |
|
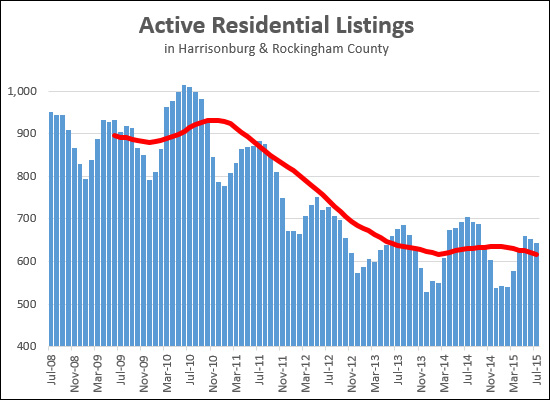 If you think there aren't many homes for sale, it's because there aren't many homes for sale. The graph above shows how inventory levels in our area have shifted downward over the past seven years. Looking at inventory levels at the start of each August, here's what we find....
Past years indicate that we will likely see inventory levels continue to decline over the next five to six months. | |
Inventory Levels Headed Down For The Winter |
|
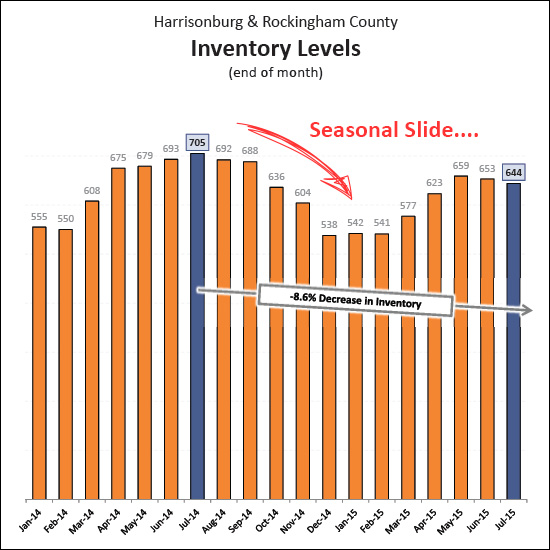 Wait... what?? Inventory levels are headed down... for the winter?? Yep, in some ways, we're already in that seasonal decline. Inventory levels have declined over the past 60 days, and are likely to continue to decline from now until next March based on seasonal trajectories of past years. Furthermore, there is an 8.6% year-over-year decline in inventory levels, further limiting the number of homes that are on the market. BUYERS: If you want to buy a home in the next three to six months, you likely have more options now than you will have in a month, and in another month, and the next after that. SELLERS: While we'll see fewer buyers in the Fall (and then the Winter) those buyers will have fewer and fewer buying options since inventory levels are declining. As such, the declining inventory levels work to your benefit -- giving you fewer sellers to compete with. | |
Does lingering snow keep housing inventory low? |
|
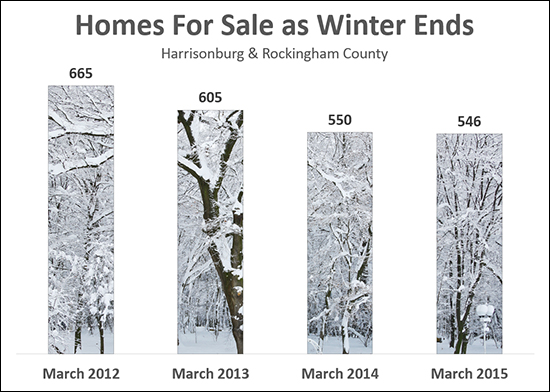 Have you heard? We might get another 6 inches of snow!?! I have met with a variety of homeowners over the past two weeks who are planning to put their houses on the market "this Spring" -- though the timing is coming into question, with this snow that just won't seem to melt. And....we're apparently going to get some more tomorrow. Which begs the question - are we seeing significantly lower inventory levels than we usually see at this time of year based on the snowfall? In short, not necessarily. Above, you'll see that current inventory levels (546 homes for sale) are just about the same spot they were a year ago. Though, you might recall that we also had a rather bitter winter last year -- so perhaps these 550/546 level is a depressed level compared to a normal level of around 600 - 650 based on 2012 and 2013? All I can say is that I'll be glad (as will my seller clients) when the snow has all come and gone, and the grass starts getting greener, and the flowers start to bloom. | |
Analysis of Current Listings (Active and Under Contract) |
|
Inventory levels are down 2.3% over this time last year. There are currently 671 active and under contract listings in Harrisonburg and Rockingham County. Let's take a closer look at the details of those homes for sale.... 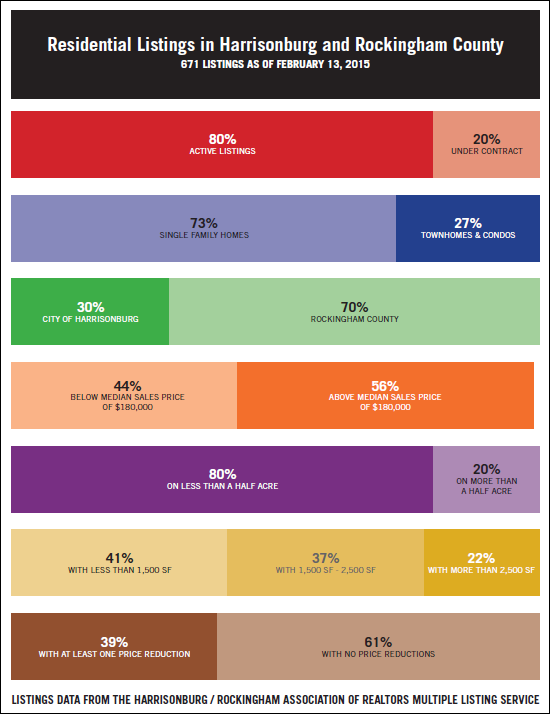 Search for New Listings in Harrisonburg and Rockingham County. Or, browse houses with recent price reductions. | |
What did buyers buy in January 2015? |
|
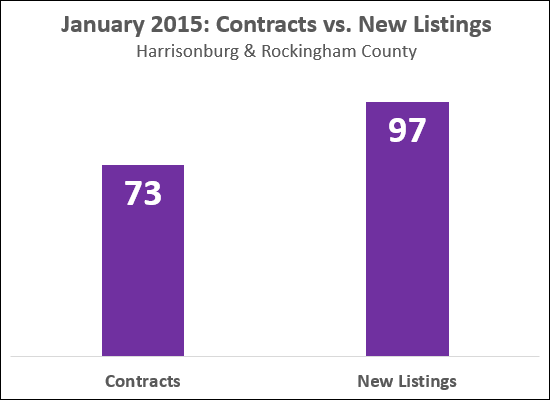 How did buyer activity and seller activity compare in January 2015?
And focusing in on those buyers, what exactly did they buy last month?
| |
| Newer Posts | Older Posts |
Scott Rogers
Funkhouser Real
Estate Group
540-578-0102
scott@funkhousergroup.com
Licensed in the
Commonwealth of Virginia
Home Search
Housing Market Report
Harrisonburg Townhouses
Walk Through This Home
Investment Properties
Harrisonburg Foreclosures
Property Transfers
New Listings


