| Newer Post | home | Older Post |
Visualizing Trends in Harrisonburg and Rockingham County Real Estate Sales Activity |
|
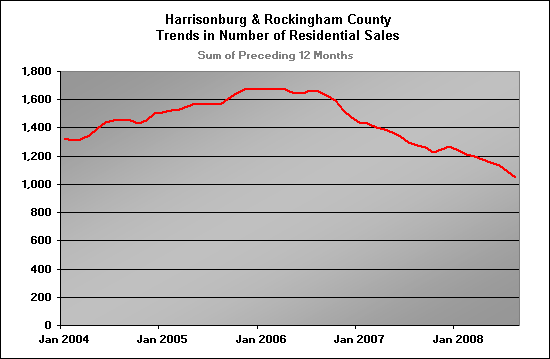
If you haven't figured it out yet, I thoroughly enjoy data analysis and creating graphs to visually communicate market trends. I frequently post a colorful historical trend graph showing month-by-month comparisons of sales activity for the past several years. But it's hard to understand the overall market via this graph. Thus, I created the graph below....  Click the graph (or here) for a printable PDF. This graph shows the overall trend in the number of real estate sales taking place in Harrisonburg and Rockingham County (per the HRAR MLS). Each data point is showing the sum total closings for the preceding 12 months. For example, the January 2004 value of 1,324 closings indicates that 1,324 closings took place between January 1, 2003 and December 31, 2003. This graph, therefore, can show us some big picture trends --- if we didn't already know or suspect what they are. Two notes from the statistician: 1. Since this graph is summing up 12 months of data for each data point, when activity starts picking up again, it may be many months before it reveals itself in this graph. 2. This graph is showing total sales activity (number of sales), and is not a reflection of changes in the market value of homes. Recent Articles:
| |
| Newer Post | home | Older Post |
Scott Rogers
Funkhouser Real
Estate Group
540-578-0102
scott@funkhousergroup.com
Licensed in the
Commonwealth of Virginia
Home Search
Housing Market Report
Harrisonburg Townhouses
Walk Through This Home
Investment Properties
Harrisonburg Foreclosures
Property Transfers
New Listings

