| Newer Post | home | Older Post |
Home sales increase in February, is our local market poised for a recovery? |
|
Click here to view/print a PDF of my real estate market report. Enjoy! 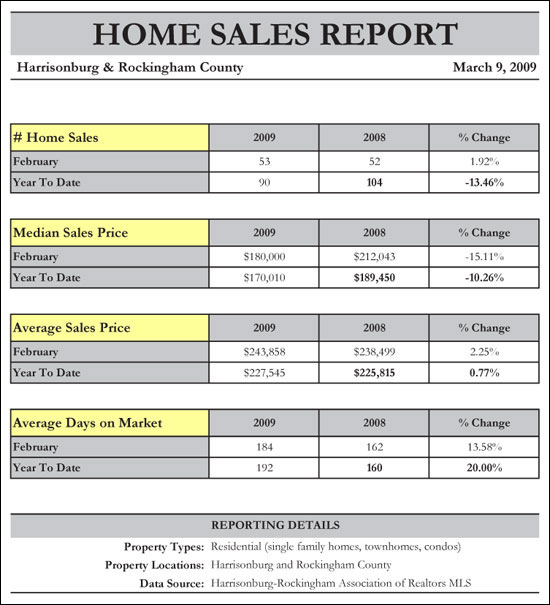 This month's home sales report (above) has several surprises, the first ofwhich is the increase in sales in February 2009 compared to February2008. Though only a modest increase, we have only seen this type ofincrease in sales (compared to the same month the prior year) 3 timesin the past 14 months. Median sales prices have fallen considerably when comparing Jan/Feb2009 with Jan/Feb 2008. This is, however, solely based on two monthsof data (a small sample size), and thus these figures may be affectedby the sales price distribution of the properties that have closed inthese two months. Somewhat contradictory to the median sales pricetrends, we see that average sales prices have increased when comparingJan/Feb 2008 to Jan/Feb 2009. Average Days on Market has increased somewhere between 14% and 20%during the past year, which is likely no surprise to sellers, many ofwhom have experienced a longer than typical length of time on themarket. 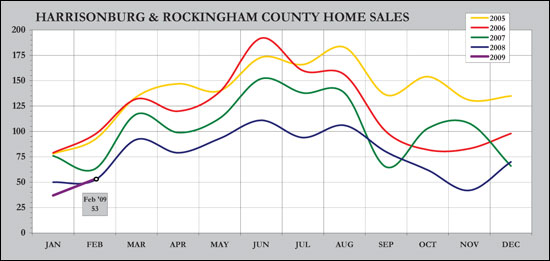 Home sales in February 2009 (53) were stronger than in February 2008 (52), perhaps suggesting that we may see 2009 turn into just as strong of a year as 2008. After several years of consecutive declines in real estate activity, February's sales figures should be an encouragement for homeowners --- perhaps the pace is finally increasing again in our local residential real estate market. 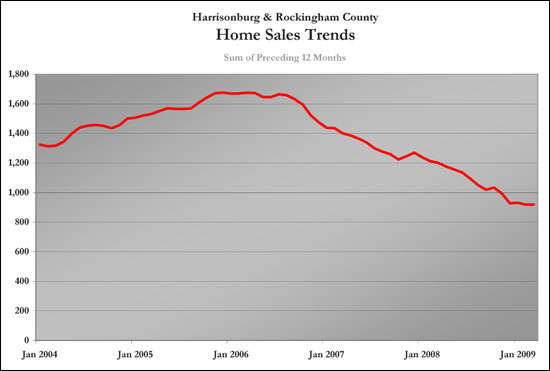 This graph shows a normalized trend of home sales by charting the ongoing sum of the preceding 12 months' sales. This normalized trend line is now showing a leveling off of home sales, perhaps indicative that the market is becoming more stable. 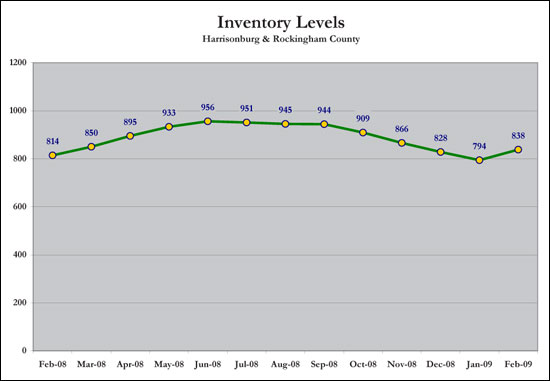 Likely as a result of the coming spring real estate market, inventory levels are now headed back up. If we continue to see an increase in the number of homes on the market, buyers will have even more negotiating power as we move forward. 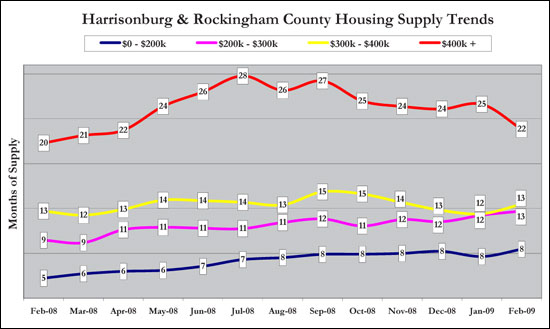 Supply levels in the $400,000+ price range dropped significantly (from 25 months to 22 months) --- due in large part to a significant increase in sales in this price range. We continue to see the healthiest supply levels in the lowest price ranges. 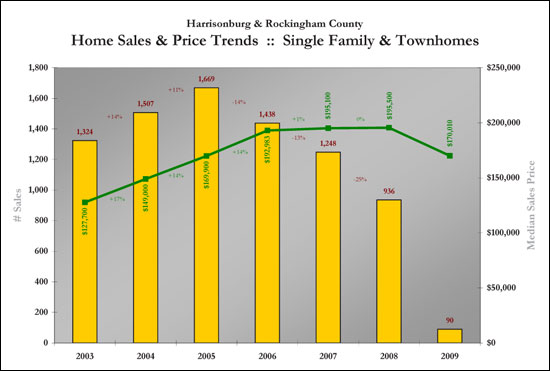 This graph captures all residential real estate activity as reflected in the Harrisonburg/Rockingham Multiple Listing Services. The pace of home has decreased significantly over the past four years, but home values have continued to stay level or increase slightly. 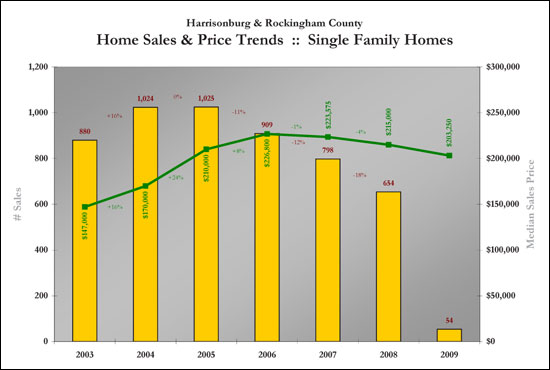 When we examine solely the single family home market we find a somewhat more significant decrease in median sales price (4% between 2007 and 2008), but we don't see as much of a drop off in the number of sales taking place. Of note, the record growth in median sales prices was 2004 when we saw a 24% increase. 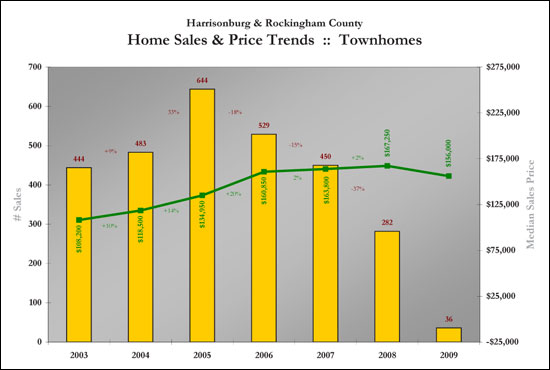 Sales in the townhouse market have drastically decreased, with a 37% decrease just between 2007 and 2008. Sales of townhouses are now down below even 2003 levels. The good news, however, is that the median sales price of townhouses continues to increase, with a 2% increase between 2007 and 2008. 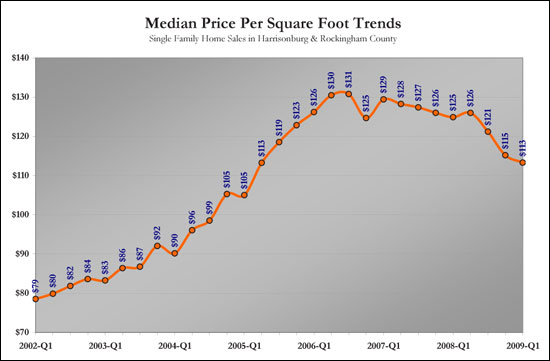 Examining the median price per square foot of sold single family homes in Harrisonburg and Rockingham County reveals an overall decline in home values (as defined by this metric). We are now at 2005 First Quarter prices per square foot, which is a decline of 14% since the peak in 2006. Recent Articles:
| |
| Newer Post | home | Older Post |
Scott Rogers
Funkhouser Real
Estate Group
540-578-0102
scott@funkhousergroup.com
Licensed in the
Commonwealth of Virginia
Home Search
Housing Market Report
Harrisonburg Townhouses
Walk Through This Home
Investment Properties
Harrisonburg Foreclosures
Property Transfers
New Listings

