Archive for June 2009
Listing Price --- It's All a Matter of Perspective |
|
 If you really think about it, the listing price of a house means ABSOLUTELY NOTHING --- regardless of what kind of a market we're in. Below are a few common conversations that explore this issue. BUYER: Well....this house is priced at $185,000 and we can't spend any more than $160,000 so we might as well not even go look at it. BUT WAIT: If the house is only worth $165,000 (and just happens to be priced at $185,000), then it would certainly be worthwhile looking at -- because when an offer comes in the owner might be reasonable about the actual value of the house. You need to know more than the asking price of the house --- you need to know what it's actually worth. BUYER: I really like this house, it's listed at $295,000 so perhaps we could offer $285,000? BUT WAIT: Don't base an offering price on the asking price! What if the house mentioned above was listed at $495,000 (and it was the same house) --- would you then offer around $480,000? The asking price is not necessarily an indication of market value, so take your cues from market values, not asking prices. BUYER: The house is listed at $225,000 and that seems like a good deal, but in this market, I'm not willing to pay any more than $215,000 for it. BUT WAIT: Really? What if the three most comparable properties in the city/county just sold for $250,000 --- and thus we are reasonable assured that the value is $250,000 (+/-) --- you'd really still only pay $215,000? SELLER: Let's list my house at $450,000 --- that's right about the price that all of my neighbors are asking for their houses. BUT WAIT: Regardless of whether the neighbors' houses are listed for $450,000 or $850,00, if they are selling for $350,000 then those sold houses should be the guide, not what is on the market now. These are just a few illustrations of the fact that the asking price of a house may mean absolutely nothing. Certainly there are times when the asking price is just at / above / below the market value (the price at which similar homes have recently sold) --- but that is not always the case. Beyond the asking price, you need to get comfortable with what the actual market value is of the houses you are considering. | |
If you're a first time home buyer, you'd better start looking more seriously now -- the clock is ticking! |
|
If, as a first time buyer, you close on your purchase of a home by November 30, 2009 you will receive an $8,000 tax credit on your 2009 taxes. That is to say that:
Most homes take 45 to 60 days to "close" -- in other words, it is usually 45 to 60 days after a house is under contract that the closing can take place. That means first time buyers ought to have their house under contract by September 30th in order to have time to close. And if you're planning to have a contract on a house before September 30th, NOW is the time to start looking. Lots of first time buyers are certainly in the market right now --- I'm working with quite a few, and I hear stories of many others as well who are buying --- but I believe there are quite a few other first time buyers who are still sitting on the bench. If you have questions about the $8,000 first time buyer credit, or if you're ready to start looking at properties, call (540-578-0102) or e-mail (scott@HarrisonburgHousingToday.com) me and we'll get started! | |
The real reasons why so much student housing is being built for JMU students... |
|
This past week the Daily News Record published an article about the new housing complexes being built to house JMU students. I believe the uninformed reader of the article would assume that there is a relatively good balance between students and housing --- but according to my calculations there is a significant oversupply of student housing for JMU students! Here are the numbers...
Tell Your Friends! Last week I was told of a (usually) well informed local business leader who was convinced that JMU will be growing to 30,000 and then 40,000 students within the next 5 - 10 years. This type of casual conversation will lead to an even wider sentiment that we need more student housing in Harrisonburg --- and this individual is often in conversation with student housing developers. I'm stepping down from my soap box now, but I hope that student housing developers, and those that advise them, will carefully study our market before continuing on a rampage of building college student housing! | |
A picture may be worth a thousand words, but perhaps a million are needed for a housing decision! |
|
Two weeks ago I showed some clients two houses in Massanutten. My clients had reviewed the photos (interior and exterior) of both homes online, and were quite a bit more excited about the second house. And yet --- when we went to see both homes they were somewhat surprised to discover that the first house was MUCH more attractive (generally speaking, and specifically to their interests). As it turns out --- beautiful photos can be taken of a less than attractive home to make it look moderately interesting and exciting. And yes, not so great photos can be taken of a beautiful home, making it seem mediocre and drab. What does this mean for you? BUYERS ought to consider going to visit homes that they have disqualified based on interior photos. Unless you are convinced that the photos are a true, accurate, fair representation of the extent and condition of the home's interior, you should go take a look! SELLERS ought to make sure that their home is presented in the best possible manner when it comes to exterior and interior photographs. I have found that a wide angle lens and an external flash unit can make an extraordinary difference in photo quality. | |
Which segment of our market is more stable? Expensive homes or starter homes? |
|
If you ask most people, you'll be told that starter homes are a much more stable segment of our market right now --- and that the higher end market is definitely doing much more poorly. As it turns out, both markets are performing well, depending on how we examine the issue. Starter homes are performing well! 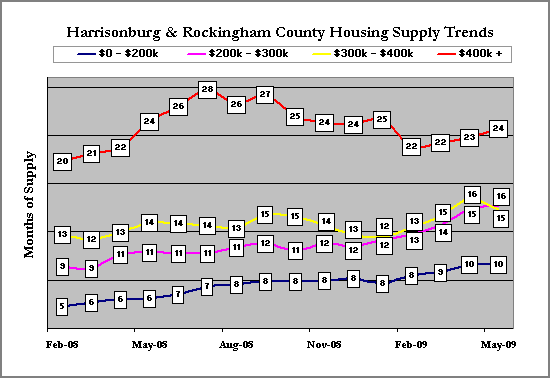 As you can see in the chart above, there is a much healthier supply of homes below $200,000 than in any other price range. Put a few other ways:
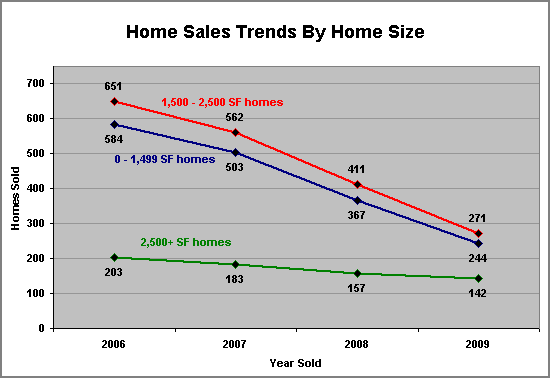 *** 2009 total sales figures are extrapolated from Jan 1 - June 15 data. Of note, the decline in home sales in our market has not affected all price/size ranges in the same way. Since prices change over time (homes shift into different price segments), I examined the change in pace of home sales by dividing our market into starter homes (0 - 1499 SF), mid-range homes (1500 - 2500 SF) and large homes (2500+ SF). You'll note that:
| |
East Wing of Urban Exchange Nearing Completion |
|
We're now less than four weeks away from the first residents moving into the brand new upscale condos in the East Wing of Urban Exchange located in downtown Harrisonburg. Click on the image below to view updated construction photos. 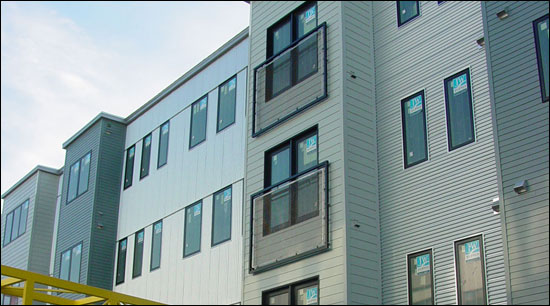 | |
May 2009 Harrisonburg & Rockingham County Real Estate Market Report |
|
View a video introduction to the May 2009 Real Estate Market Report: Read on for a full review of the state of the Harrisonburg and Rockingham County residential real estate market. Or....download the full report: May 2009 Harrisonburg & Rockingham County Real Estate Market Report 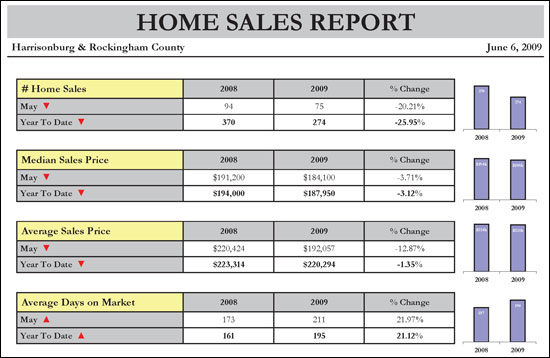 The four most commonly referenced measures of our local housing market (sales volume, median sales price, average sales price and average days on market) are all in worse shape in May 2009 than they were a year ago. However, the median sales price is likely the most meaningful of the measures, and it continues to show a decline of only 3% when comparing May 2008 to May 2009, or when comparing January-May 2008 to January-May 2009. 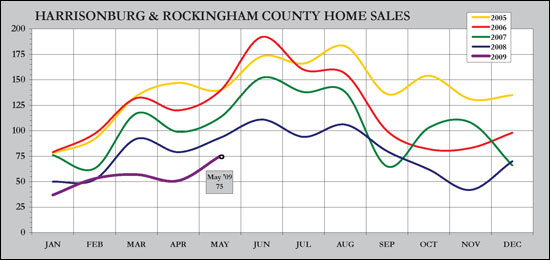 In this graph, we see that 2009 sales volume (purple line) is still hovering well below 2008 sales volume (blue line) --- but the gap closed slightly in May as compared to March and April. Perhaps we are seeing a normalizing trend, and sales volume in June, July and August of this year will be much closer to 2008 sales levels. Greater stability will return to our market when sales volume stops declining. 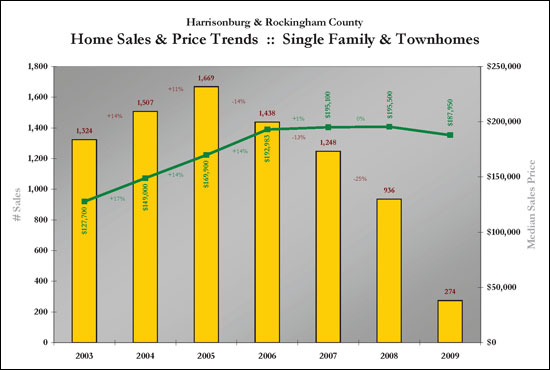 This graph captures all residential real estate activity as reflected in the Harrisonburg/Rockingham MLS. The 2009 year-to-date sales figures now include five months of sales data, and show only a slight decline in median sales prices. Of note, the median residential sales price has not significantly changed since 2006. 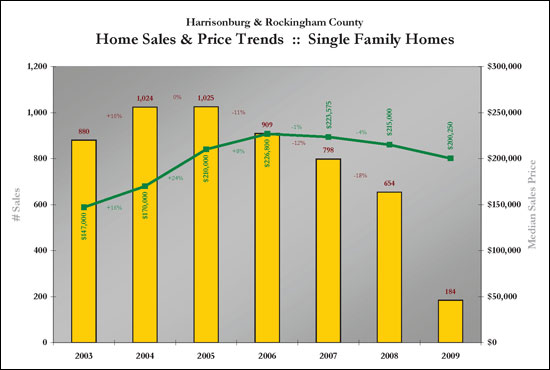 When examining only single family home sales in Harrisonburg and Rockingham County we see that the median sales price continues to decline at a relatively slow rate (1%, 4%, 7%) when comparing 2009 to 2008. Amidst these slight declines, the pace of sales (yellow bars) continues to decline drastically. 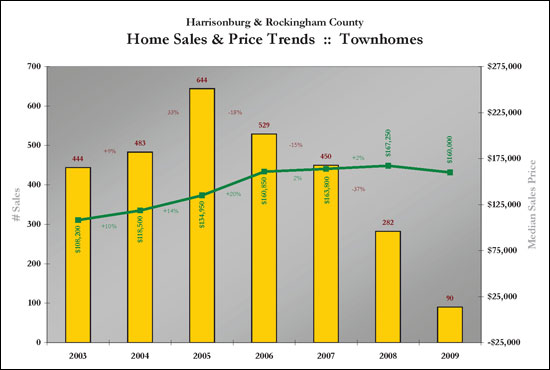 When examining only townhome sales in Harrisonburg and Rockingham County we note that while the sales volume has dropped dramatically since 2005 (-18%, -15%, -37%), the median sales price has gained during that time period (2005 vs. 2009) and has stayed steady between 2006 and 2009. 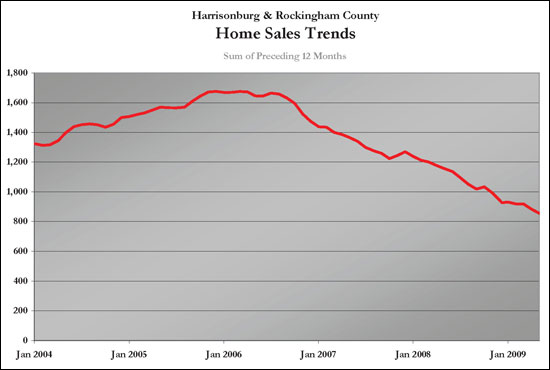 This graph shows a normalized trend of home sales by charting the ongoing sum of the preceding 12 months' sales. We continue to see a decline in this metric, and likely will until the pace of sales stops its decline. 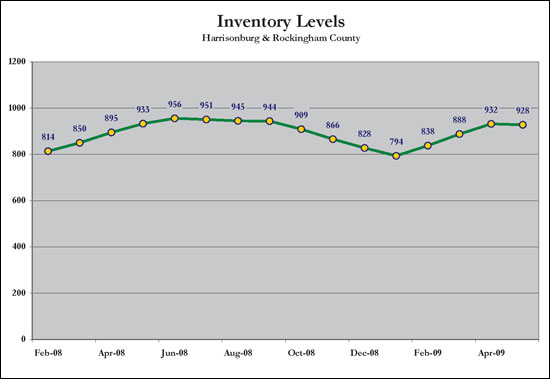 Of note, inventory declined slightly between the end of April and the end of May. This is great news for the overall health of our market, as it will reduce the high inventory levels and slowly start to balance out our market. This is a surprising trend for the early summer months! 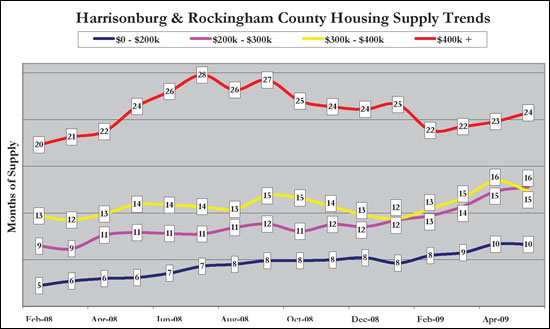 With inventory levels holding steady, the number of months of supply of homes in each price range noted above has stayed relatively steady. Of note, this is the first month that any of these trend lines have crossed, as can be noted between the $200k-$300k and $300k-$400k lines. 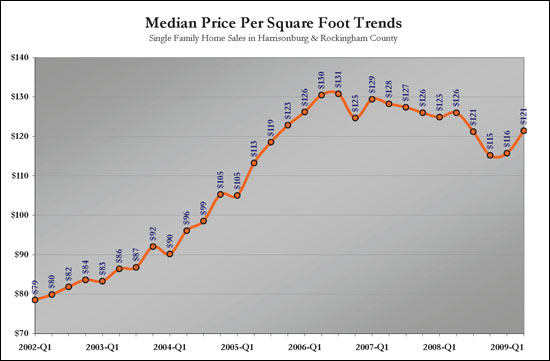 The median price per square foot of all single family homes sold since 2002 in Harrisonburg and Rockingham County shows that homes have started selling at a somewhat higher rate over the past several quarters when examining their cost per functional space. 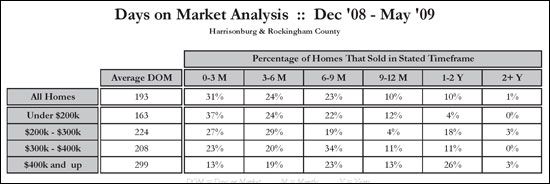 The chart above examines time on market for homes sold in Harrisonburg and Rockingham County during the past six months. Homes with the lowest price points are selling the quickest, and homes in the upper price ranges are taking the longest time to sell. For example, overall only 10% of homes took longer than 1 year to sell, but 26% of homes selling over $400,000 took longer than a year to sell. In contrast, only 13% of these homes over $400,000 sold in the first three months, while 37% of homes selling for less than $200,000 sold in the first three months of being on the market. 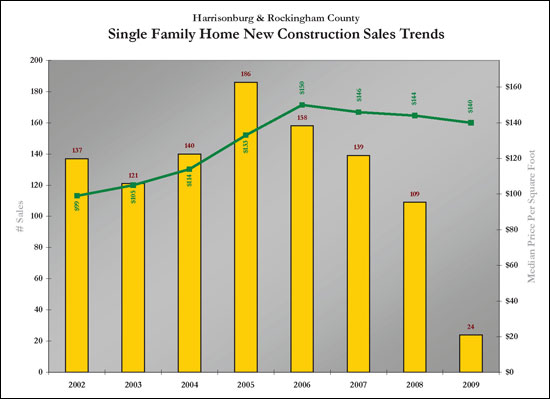 When examining only new single family homes in Harrisonburg and Rockingham County, we can see a steady decline since 2005 in the number of such homes that are selling (yellow bars) accompanied by a slow decrease in the median price per square foot since 2006 (green line). 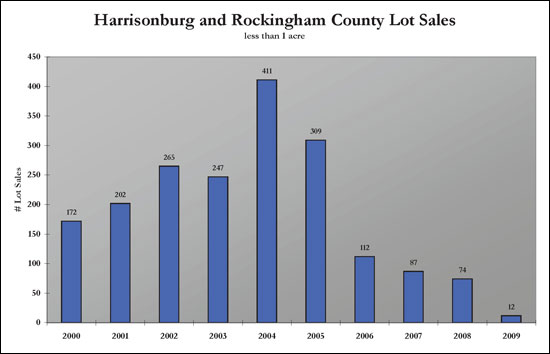 The graph above depicts the number of lots (less than 1 acre) selling in Harrisonburg and Rockingham County since 2000. The last several years have been unbelievably slow for lot sales, likely because many builders have been holding back on starting construction on new homes given the trends in the residential sales market. 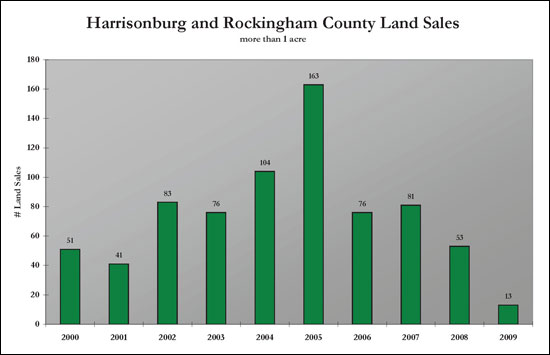 Land sales (tracts larger than 1 acre) have also markedly decreased since 2005, but aside from the spike of activity in 2005, the pace of these land sales remained relatively constant between 2002 and 2007. Last year, and the projected figures for this year show that there are very few buyers in the market for land at this time. Download the full report here: May 2009 Harrisonburg & Rockingham County Real Estate Market Report | |
New Construction Price Per Square Foot Trends in Harrisonburg and Rockingham County |
|
For some time I have been tracking price per square foot trends for all single family homes in Harrisonburg and Rockingham County. These appear in my monthly market report, and show a median price per square foot of $80/sf back in 2002, a high of $131/sf in 2006 and a current value of $123/sf. In talking to a potential developer last week, he inquired about price per square foot trends for new construction. This isn't an easy thing to calculate, for several reasons:
Below you will see the results, with a starting value of $99/sf in 2002, a high of $150/sf in 2006, and a current value of $140/sf. 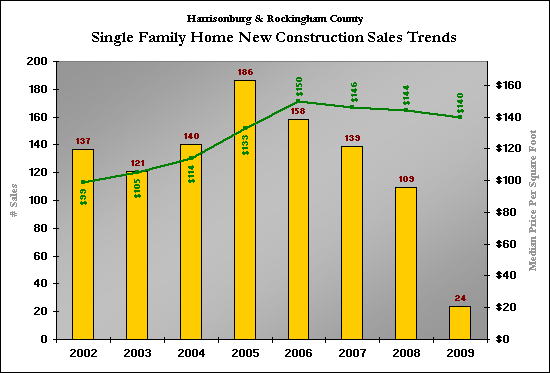 I also graphed the number of applicable home sales in each year since 2002 to put the market into perspective. Click here, or on the image above, for a clearer PDF version of this graph. Closing thoughts:
| |
Exploring Home Value Trends in Harrisonburg and Rockingham County (again) |
|
The questions continue:
I'll be issuing my May report in the new few days, but in the meantime I thought I'd explore the big value questions again from a few perspectives. Here's what I found: Median Homes Prices Decline When now examining January through May, we see a median home value of $215,000 (still) for 2008, but a median value of $205,000 for 2009. How did we drop $10k when comparing Jan-Apr 2009 and Jan-May 2009? Smaller and less expensive homes sold in May 2009 (avg = $197k, 1906sf) as opposed to during the first four months of 2009 (avg = $240k, 2048sf). So....despite Jan-May 2009 median home prices being down compared to the same months in 2008, perhaps it is because smaller (and less expensive) homes are selling? Larger Home Market Outpaces Smaller Home Market The data above suggests that perhaps median home values are declining because smaller homes are selling right now. Not so fast! During Jan-May 2008, 39% of homes that sold had 1500 or fewer square feet. This declined in 2009 to only 35% of homes sold during Jan-May 2009. During Jan-May 2008, 21% of homes that sold had 2500 or more square feet. This increased in 2009 to 26% of homes sold during Jan-May 2009. These are relatively small differences, and they may not be significantly, but they refute the hypothesis that median home prices are declining because smaller homes are selling. Are First Time Buyers Procrastinating? The data above is a bit surprising to me --- I suspected that we would see an increase in "starter homes" (often less than 1500 square feet) because of the financial incentives currently available for first time buyers. The combination of an $8,000 tax credit, plus historically low interest rates is predicted to bring lots of first time buyers into the market. These first time buyers don't seem to have shown up in large numbers so far, based on the slower sales in the most affordable price range. Price Per Square Foot Declines As one last look at home values, I thought I'd take a look at the average price per square foot of the single family homes sold in Harrisonburg and Rockingham County in Jan-May 2008 versus Jan-May 2009. Last year we saw an average price per square foot of $130 during this time frame, as compared to $118 per square foot this January through May. Making it Actionable To obey my own imperative, here are a few thoughts on how this might affect you and your real estate decisions:
A far more detailed analysis of our local real estate market will be available in the next few days. Until then, wrestle with the data points above, and let me know if you have any related revelations or hypotheses. | |
Actionable Statistics |
|
In a meeting last week with a potential client, I was asked a great question amidst showing off some of my recent market report: "You have very pretty charts and graphs, and it's great that you have this report, but so what?? Can these statistics actually help your clients make better decisions?" What a great point --- it's marvelous to have lots of interesting analysis of market data, presented in an easily comprehensible format --- but how do we transform it into something that actually helps my clients make better real estate decisions. Here were/are my responses:
And by all means, if you see data analysis or reporting on this blog that is not providing actionable information or statistics, call me out! I'd like to make them actionable for you! | |
Scott Rogers
Funkhouser Real
Estate Group
540-578-0102
scott@funkhousergroup.com
Licensed in the
Commonwealth of Virginia
Home Search
Housing Market Report
Harrisonburg Townhouses
Walk Through This Home
Investment Properties
Harrisonburg Foreclosures
Property Transfers
New Listings

