| Newer Post | home | Older Post |
May 2009 Harrisonburg & Rockingham County Real Estate Market Report |
|
View a video introduction to the May 2009 Real Estate Market Report: Read on for a full review of the state of the Harrisonburg and Rockingham County residential real estate market. Or....download the full report: May 2009 Harrisonburg & Rockingham County Real Estate Market Report 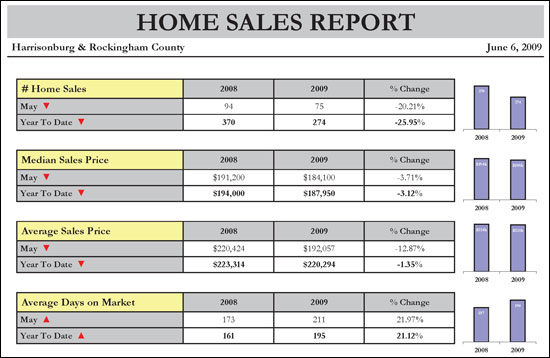 The four most commonly referenced measures of our local housing market (sales volume, median sales price, average sales price and average days on market) are all in worse shape in May 2009 than they were a year ago. However, the median sales price is likely the most meaningful of the measures, and it continues to show a decline of only 3% when comparing May 2008 to May 2009, or when comparing January-May 2008 to January-May 2009. 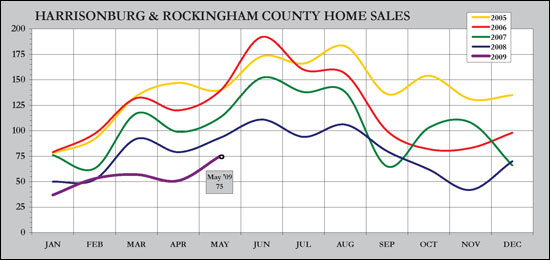 In this graph, we see that 2009 sales volume (purple line) is still hovering well below 2008 sales volume (blue line) --- but the gap closed slightly in May as compared to March and April. Perhaps we are seeing a normalizing trend, and sales volume in June, July and August of this year will be much closer to 2008 sales levels. Greater stability will return to our market when sales volume stops declining. 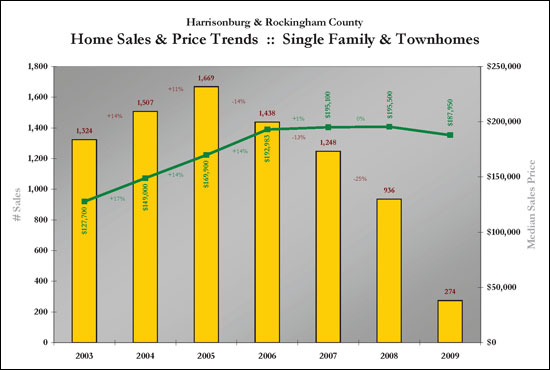 This graph captures all residential real estate activity as reflected in the Harrisonburg/Rockingham MLS. The 2009 year-to-date sales figures now include five months of sales data, and show only a slight decline in median sales prices. Of note, the median residential sales price has not significantly changed since 2006. 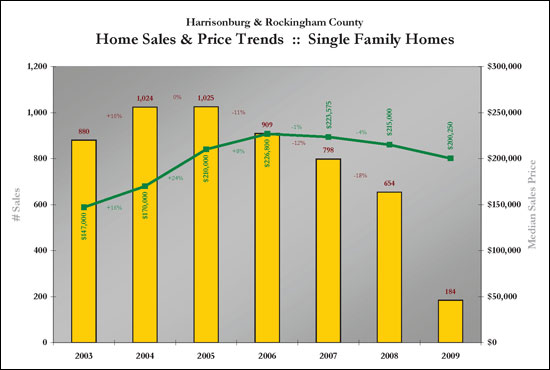 When examining only single family home sales in Harrisonburg and Rockingham County we see that the median sales price continues to decline at a relatively slow rate (1%, 4%, 7%) when comparing 2009 to 2008. Amidst these slight declines, the pace of sales (yellow bars) continues to decline drastically. 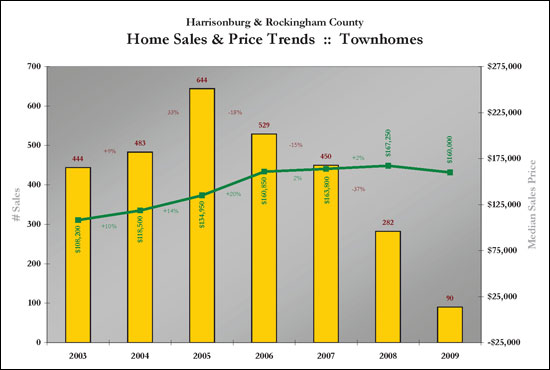 When examining only townhome sales in Harrisonburg and Rockingham County we note that while the sales volume has dropped dramatically since 2005 (-18%, -15%, -37%), the median sales price has gained during that time period (2005 vs. 2009) and has stayed steady between 2006 and 2009. 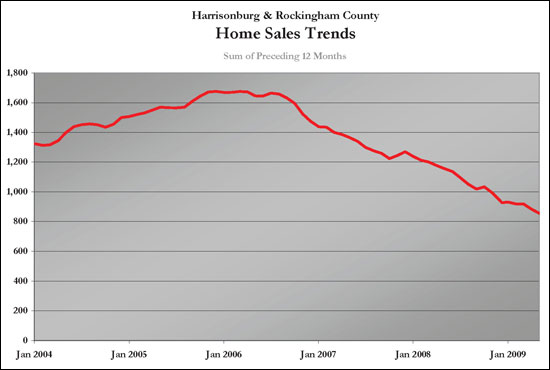 This graph shows a normalized trend of home sales by charting the ongoing sum of the preceding 12 months' sales. We continue to see a decline in this metric, and likely will until the pace of sales stops its decline. 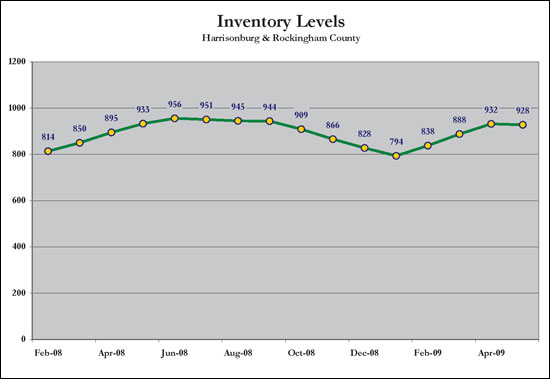 Of note, inventory declined slightly between the end of April and the end of May. This is great news for the overall health of our market, as it will reduce the high inventory levels and slowly start to balance out our market. This is a surprising trend for the early summer months! 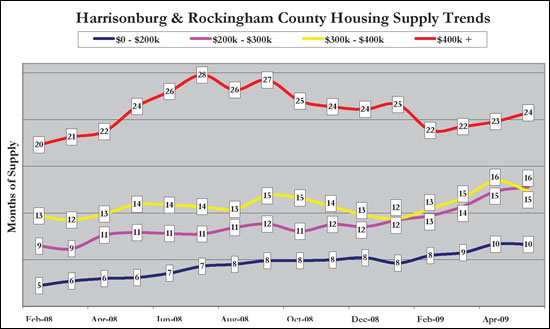 With inventory levels holding steady, the number of months of supply of homes in each price range noted above has stayed relatively steady. Of note, this is the first month that any of these trend lines have crossed, as can be noted between the $200k-$300k and $300k-$400k lines. 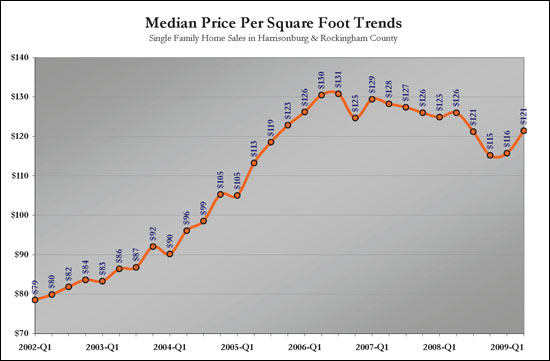 The median price per square foot of all single family homes sold since 2002 in Harrisonburg and Rockingham County shows that homes have started selling at a somewhat higher rate over the past several quarters when examining their cost per functional space. 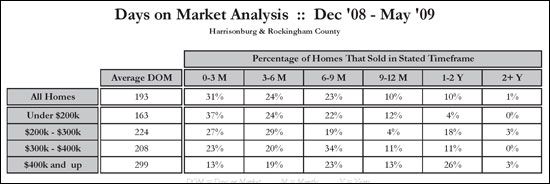 The chart above examines time on market for homes sold in Harrisonburg and Rockingham County during the past six months. Homes with the lowest price points are selling the quickest, and homes in the upper price ranges are taking the longest time to sell. For example, overall only 10% of homes took longer than 1 year to sell, but 26% of homes selling over $400,000 took longer than a year to sell. In contrast, only 13% of these homes over $400,000 sold in the first three months, while 37% of homes selling for less than $200,000 sold in the first three months of being on the market. 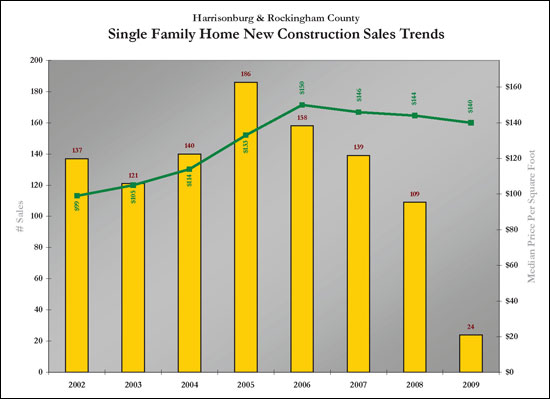 When examining only new single family homes in Harrisonburg and Rockingham County, we can see a steady decline since 2005 in the number of such homes that are selling (yellow bars) accompanied by a slow decrease in the median price per square foot since 2006 (green line). 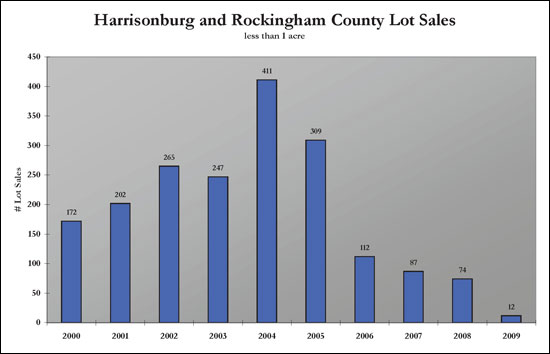 The graph above depicts the number of lots (less than 1 acre) selling in Harrisonburg and Rockingham County since 2000. The last several years have been unbelievably slow for lot sales, likely because many builders have been holding back on starting construction on new homes given the trends in the residential sales market. 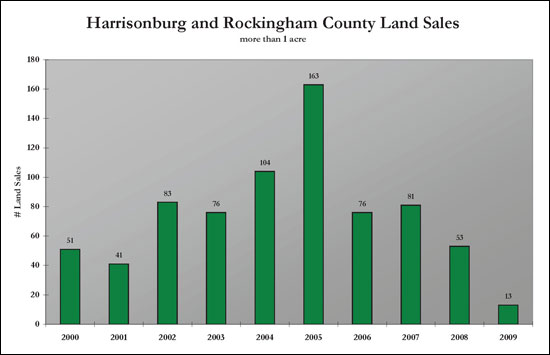 Land sales (tracts larger than 1 acre) have also markedly decreased since 2005, but aside from the spike of activity in 2005, the pace of these land sales remained relatively constant between 2002 and 2007. Last year, and the projected figures for this year show that there are very few buyers in the market for land at this time. Download the full report here: May 2009 Harrisonburg & Rockingham County Real Estate Market Report Recent Articles:
| |
| Newer Post | home | Older Post |
Scott Rogers
Funkhouser Real
Estate Group
540-578-0102
scott@funkhousergroup.com
Licensed in the
Commonwealth of Virginia
Home Search
Housing Market Report
Harrisonburg Townhouses
Walk Through This Home
Investment Properties
Harrisonburg Foreclosures
Property Transfers
New Listings

