| Newer Post | home | Older Post |
Positive Long Term Trends Over The Past Six+ Months |
|
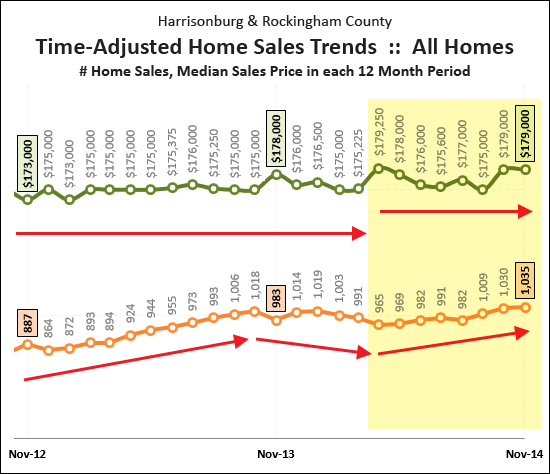
 There is a lot going on in the graph above.... This graph shows a rolling 12 months of the number of home sales in the Harrisonburg and Rockingham County area, as well as the median price of the homes that sold during these time frames. Each data point shows one year's worth of home sales, which eliminates the volatility of evaluating sales figures on a monthly basis. Of note, over the past six to eight months, we've seen two things happen.... 1. Median Prices jumped up from their usual $175K spot (where they've been for a few years) to levels closer to $178K or $179K. This is shown with the green line in the yellow shaded box. 2. The pace of home sales started increasing again, surpassing the 1,000 sales per year mark again, after having seen a decline in early 2014. This is shown with the orange line in the yellow shaded box. Both of these are long term trends that show sustained health and growth in our local real estate market. For even more analysis of our local housing market, check out my full December 2014 market report online, or by downloading the PDF.  Recent Articles:
| |
| Newer Post | home | Older Post |
Scott Rogers
Funkhouser Real
Estate Group
540-578-0102
scott@funkhousergroup.com
Licensed in the
Commonwealth of Virginia
Home Search
Housing Market Report
Harrisonburg Townhouses
Walk Through This Home
Investment Properties
Harrisonburg Foreclosures
Property Transfers
New Listings

