| Newer Post | home | Older Post |
More Homes are Selling, Faster, at Higher Prices in Harrisonburg, Rockingham County |
|
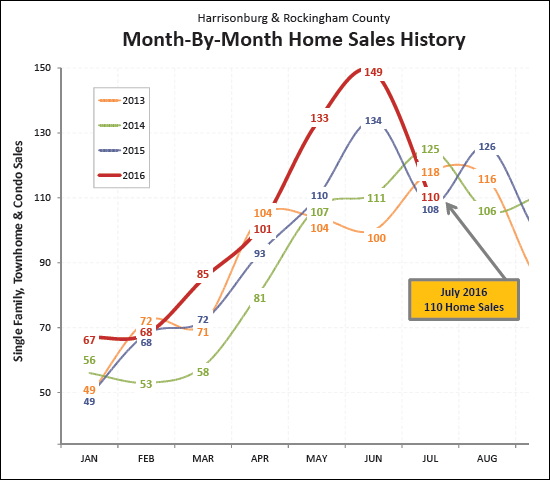
 Learn more about this month's Featured Property: 580 Spring Oaks Drive I just published my monthly report on the Harrisonburg and Rockingham County real estate market. Jump to the full online market report, watch the video overview below, download the PDF, or read on for highlights.... First, a video overview....  Now, let's take a look at the overall market performance in July.... 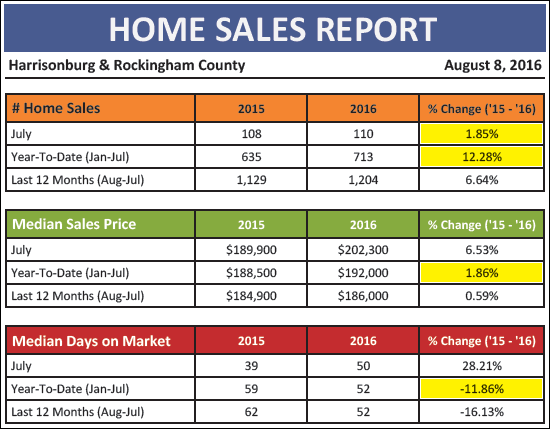 A few things jump out at me when looking at the chart above....
July could be seen as a disappointment in some ways. We didn't see sky high home sales, towering over all previous months of July. We only saw a tiny 1.85% increase in sales as compared to July 2015. But wait -- before we become too glum about the 110 home sales in July, let's not forget the record breaking months of sales that we saw in May and June! Just for fun, let's look at May through July home sales for the past few years....
So, yes, I think we can be satisfied with the 110 home sales we saw in July 2016 given the slightly larger context.
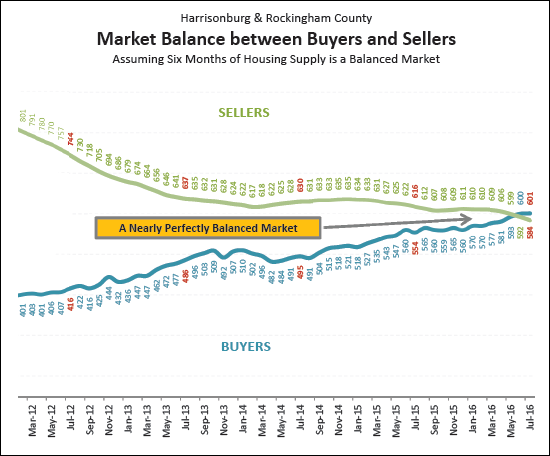
The graph above is somewhat complicated, but very important as to an understanding of our local housing market. The green "SELLERS" trajectory is showing the number of homeowners trying to sell their homes. The blue "BUYERS" trajectory shows the number of buyers closing on the purchase of homes in a six month period. This graph, therefor, is a good indication of overall market balance in our local housing market, as many housing market analysts consider a six month supply of homes for sale to be a sign of a market that is balanced between buyers and sellers. As shown above, after many years, we finally saw these trajectories cross last month. That is to say that there are now more buyers buying in a six month period than there are sellers selling. As such, if we've been approaching a balanced market for the past year, it is now definitely "in balance" -- even if that varies some from price range to price range.
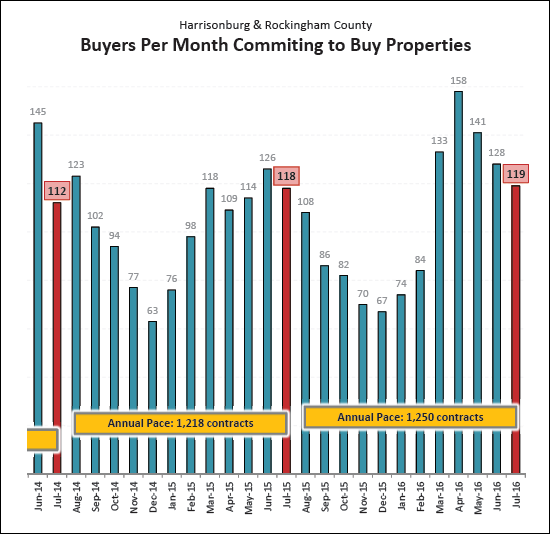
Taking a look at buyer activity in the form of signed contracts, we see that July was another relatively strong month with 119 contracts signed -- as compared to 118 last July. Put in a slightly larger context, we have seen an average of 136 contracts per month over the past five months -- as compared to an average of only 117 contracts per month during the same timeframe in 2015.
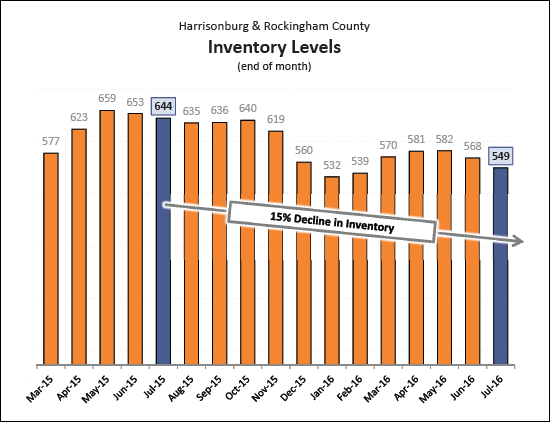
One of the ways that we have achieved the market balance illustrated above is by a reduction in the number of homes for sale. As the graph above indicates, we have seen a 15% decline in inventory levels over the past year. Thus, buyers a year ago had 644 homes to choose from -- and today can only choose from 549 properties. OK, let's cut off my ramblings about our local market there for now. There is a lot more more in my full real estate market report, but I'll let you explore that and read further on your own if you so choose. I'll continue to delve into the latest trends on HarrisonburgHousingToday.com over the next few days, but if you just can't wait, feel free to read the entire report online....
Recent Articles:
| |
| Newer Post | home | Older Post |
Scott Rogers
Funkhouser Real
Estate Group
540-578-0102
scott@funkhousergroup.com
Licensed in the
Commonwealth of Virginia
Home Search
Housing Market Report
Harrisonburg Townhouses
Walk Through This Home
Investment Properties
Harrisonburg Foreclosures
Property Transfers
New Listings

