| Newer Post | home | Older Post |
Is a balanced market always this fleeting? |
|
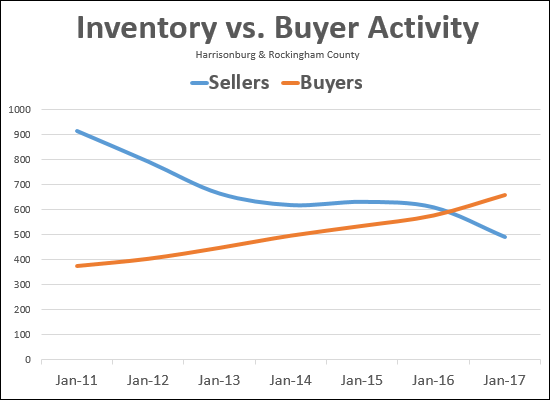
 The graph shown above is an illustration of changing inventory levels (blue line) and the number of buyers buying in a six month period (orange line). The point at which the two lines meet is when there was exactly six months of inventory of homes on the market for sale. All of the months prior to when the lines met are times when (to varying degrees) there were many more homes on the market (housing surplus) than there were buyers to buy them (low demand). All of the months after the point when the lines met are times when (to varying degrees) there have been far fewer homes on the market (housing shortage) than there are buyers to buy them (high demand). Perhaps what has surprised me the most in the past year is how quickly the balance seems to be swinging towards a seller's market (low supply, high demand) when I thought we might stay in a relatively balanced market (high supply, high demand or moderate supply, moderate demand) for some time. Recent Articles:
| |
| Newer Post | home | Older Post |
Scott Rogers
Funkhouser Real
Estate Group
540-578-0102
scott@funkhousergroup.com
Licensed in the
Commonwealth of Virginia
Home Search
Housing Market Report
Harrisonburg Townhouses
Walk Through This Home
Investment Properties
Harrisonburg Foreclosures
Property Transfers
New Listings

