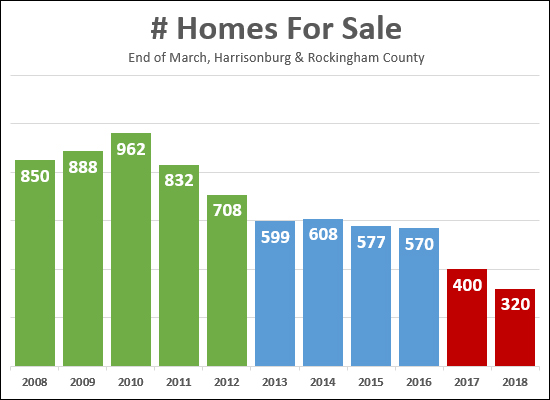
Just how historic are the current low housing inventory levels? Quite historic, it seems. The graph above shows the inventory level at this time of year (end of March) for each of the past 11 years.
As you can see, we have been seeing steady declines since 2010 -- though things were relatively steady with around 600 homes for sale between 2013 and 2016. Last year, however, we saw a 33% decline -- and this year we have seen another 20% decline.
Low inventory levels leads to homes selling much more quickly, and buyers often having a more difficult time securing a home to purchase. Stay tuned to see whether we start to see increases in inventory levels as we continue through the Spring and Summer.
Read more about our local housing market at
HarrisonburgHousingMarket.com.
Recent Articles:


