Archive for January 2019
What Would It Take For New Construction (For Sale) Housing To Be Built, At Scale, In or Around Harrisonburg |
|
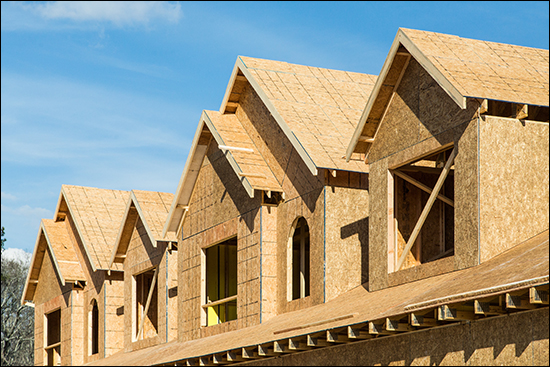 As you may have heard -- the market is hot -- sales are stead, inventory levels are declining and homes are selling more and more quickly. Perhaps, just perhaps, we need some new homes to be built to add to the supply side of the equation? So -- after all that -- what would it take for us to see more new construction (for sale) housing in and around Harrisonburg? 1. More highly motivated sellers of development land. 2. Fewer student housing, rental housing and mixed use developers. You see, there are parcels of land for sale in and around Harrisonburg right now -- or parcels of land that could be purchased where a builder could build homes and buyers could buy those homes and everyone would live happily ever after. But -- most sellers of development land aren't overly motivated to sell quickly AND they are convinced that their land should be valued as if it is being sold to a student housing, rental housing or mixed use developer. And, so long as there are student housing, rental housing or mixed use developers willing to buy land at a high price/acre AND/OR as long as owners of development land are willing to hold out for that high price/acre -- then land is not likely to be sold to developers or builders at a price/acre that would allow them to build homes for buyers to buy. I think it is important that our local housing stock increase over the next five years with more options for buyers (especially first -- or second -- time buyers) to make Harrisonburg their home. But right now, we seem to be at a bit of a stalemate -- sellers of development land don't want to sell their land at prices that would allow a builder/developer to build homes for sale -- and builders/developers don't want to pay (can't pay) overly high prices/acre and still deliver a product to the market at a price that a buyer would be able to afford. | |
What To Do If Someone Knocks On Your Front Door When Your House Is Listed For Sale |
|
 So, let's say that your house is listed for sale, and one day when you're at home, someone knocks on the front door -- and then -- they ask you if they can take a quick look inside. What to do, what to do!?! First off, this does not happen very frequently -- so don't worry that you'll have people constantly coming up to your door when your house is listed for sale. Most buyers will contact their Realtor or your Realtor to request a showing. Secondly, if you don't feel comfortable having a stranger walk through your house just because you have a for sale sign in your yard and that gave them the boldness to request it, then kindly ask that they call their Realtor or your Realtor to schedule a showing. But --- if you're comfortable with walking them through the home (and if I am your Realtor -- because I'm not trying to give you different advice than your Realtor if you are working with someone other than me) then feel free to do so. More often than not, they won't end up being the buyer for your home -- but allowing a prospective buyer to see the interior of your house while they are excited about the exterior, location and/or neighborhood -- is, generally, a good thing! So - don't dread the (probably very infrequent) knock - but just be sure to do what you're comfortable with in that moment. | |
Changes in Housing Inventory Levels By Price Range |
|
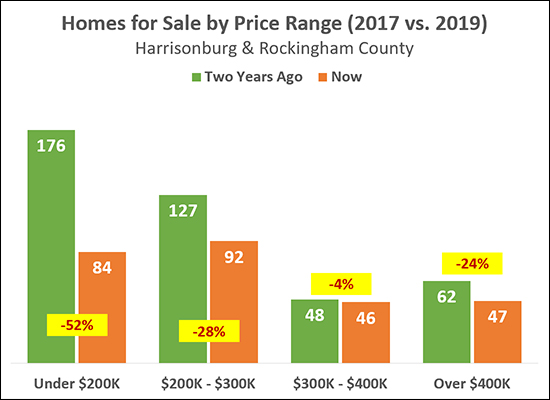 Not all price ranges are created equally, it seems. The hardest hit price range, perhaps unsurprisingly, is the under $200K price range -- where we have seen a 52% decline in the number of homes for sale over the past two years. Of note -- part of the problem here is increasing home values -- which prices some homes out of the "under $200K" price range. Regardless, though, buyers looking to stay under $200K for their home purchase are having an ever more difficult time doing so. The $200K - $300K market also had a sizable (28%) decline in the number of homes actively listed for sale as compared to two years ago. The $300K - $400K inventory levels stayed relatively level and the "over $400K" market saw a decline in the number of homes for sale, though this would certainly impact a much smaller number of buyers. Depending on the price range (and location, property type, condition, size, age) you are shopping in, you are bound to find something slightly different as to the current inventory levels and recent trends in those levels. | |
Home Sales Accelerating Faster In City Over Past Five Years |
|
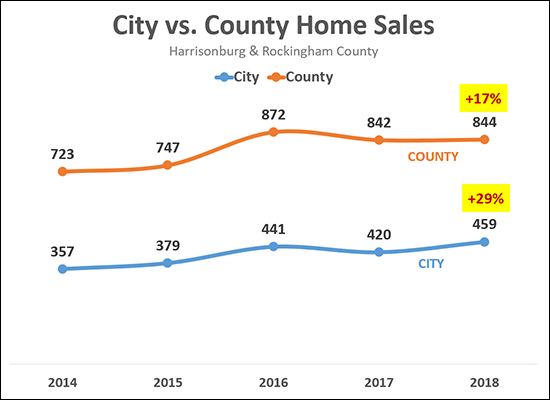 Now, for the annual showdown between the City of Harrisonburg and Rockingham County, though first noting that:
There are any number of factors that affect whether buyers end up buying in the City or County, including what type of property they are seeking, how much land they desires, school systems, employer locations, and much more. | |
How Much Did City Single Family Homes Increase in Value in 2018? |
|
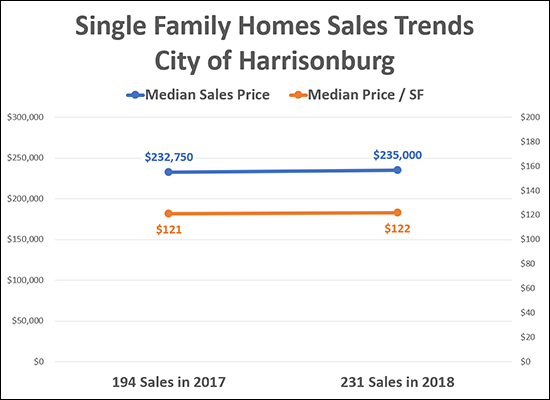 If you own a single family home in the City of Harrisonburg, you might be wondering how much your home's value increased (or decreased) over the past year. 194 single family detached homes sold in the City of Harrisonburg in 2017 with a median sales price of $232,750 and a median price/SF of $121. 231 single family detached homes sold in the City of Harrisonburg in 2018 with a median sales price of $235,000 and a median price/SF of $122. The increase in median sales price from $232,750 to $235,000 is a 0.97% increase. The increase in median price per square foot from $121 to $122 is a 0.83% increase. So, if we round up (just by a bit) then based on changes in both the median sales price and the median price per SF, it seems that single family homes in the City of Harrisonburg increased in value by 1% in 2018. | |
Who Is Winning In The Local Real Estate Market? |
|
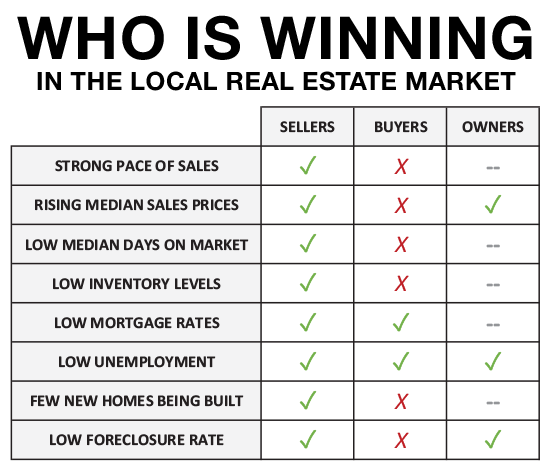 Sellers are winning - rather universally. Every market metric works in their favor. Hooray if you get to be a seller in the current market! Buyers are losing - in all but a few categories. Certainly, buyers are happy to have low mortgage interest rates (cheap money) and low unemployment (you need a job to buy a house) but otherwise, all market metrics are working against buyers. Homeowners are winning - but are indifferent to most of what is going on in the market. Homeowners are certainly happy that home prices are increasing, that folks have jobs, and that not many people are losing their homes to foreclosure. As to all of the other market shenanigans - they are rather indifferent. So, again, a great time to be a seller. And if you have to be a seller AND a buyer -- perhaps it will be a wash. You'll benefit as a seller and struggle as a buyer. Welcome to the Seller's Market of 2019! | |
Perhaps The $225K Median Sales Price Is More Sustainable This Time |
|
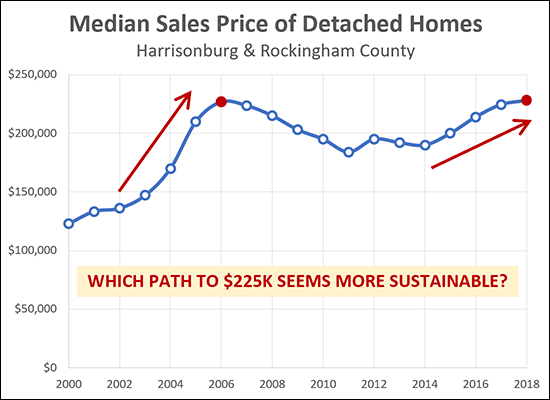 The median sales price of detached homes (single family homes) cleared $225K in 2018! Oh, but wait, this happened before, didn't it? Yes, actually, we saw a median sales price of $226,800 in 2006 -- and then in the five years that followed, the median sales price slid downward to $184,000. So, are we more likely to stay north of $225K this time around? I think we are, and here's why...
Only time will tell whether these $225K+ median sales prices can stick around in Harrisonburg and Rockingham County this time around -- but the broader contextual data suggests that it is more likely this time than last. | |
30 Year Fixed Mortgage Rates Dropped Half Percentage Over Past Two Months |
|
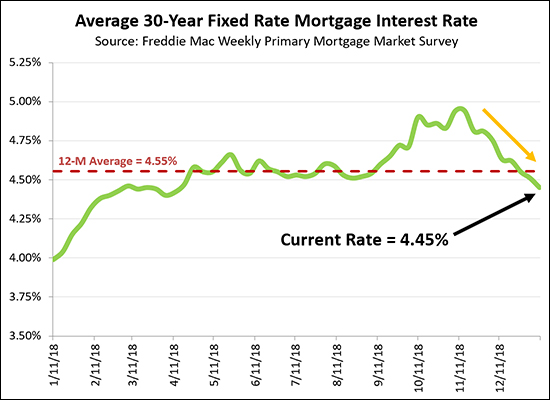 Mortgage interest rates have, indeed, steadily declined over the past two months -- from 4.94% down to 4.45%. That is a half of a percentage point, which is a large decline given the range of mortgage rates we're seeing today. So -- now we're back to where we were for much of 2018 -- or at least April through September. Today's buyers will luck out with a low housing payment compared to what they would have expected two months ago -- IF (this is a big if) they can actually find something to buy in this low inventory environment. Where do rates go from here? It's anyone's guess. This recent drop gives me hope that we could spend all of 2019 under 5%. We shall see! | |
Did The Local Housing Market Slow At The End Of 2018? |
|
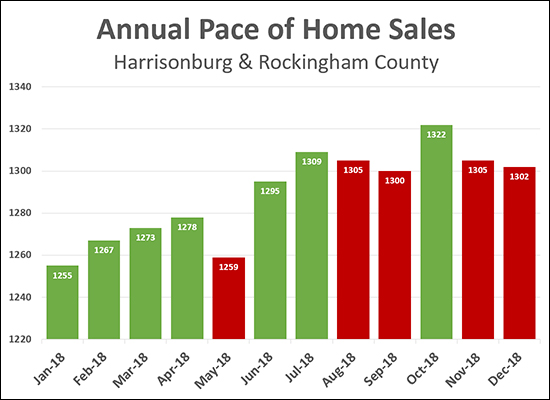 Oh my heavens! Take a look at the graph above! DID the local housing market slow at the end of 2018??? I am going to lean towards: sort of, maybe a bit, but not much. The graph above...
So -- if you like the high stress graph above that unintentionally uses Christmas colors, and might make you feel unsettled about the changing tide of the local home sales market -- then stick with that one and close your email/browser. If you want an alternate perspective on the same data, keep reading... 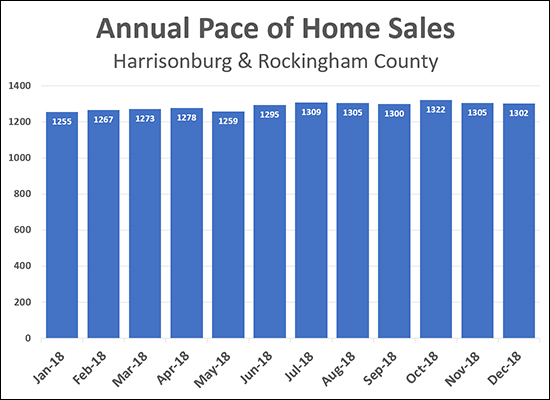 This graph (above) shows the same data as the first graph -- but by taking the Y axis all the way down to zero we get a better sense of the fact that the slight declines in the annualized pace of homes sales in the second half of 2018 were just that -- slight. So -- is the sky falling? Are home sales declining? Did we peak in mid-2018? Well, maybe, but I don't think we can conclude that definitely or with much conviction at this point. The overall downward adjustments were rather small compared to the total number of homes selling on an annual basis. Stay tuned, then, for 2019 -- eventually we'll be able to draw some more conclusions about what actually happened in 2018! :-) | |
Do Lower Housing Inventory Levels Matter In Our Local Market? |
|
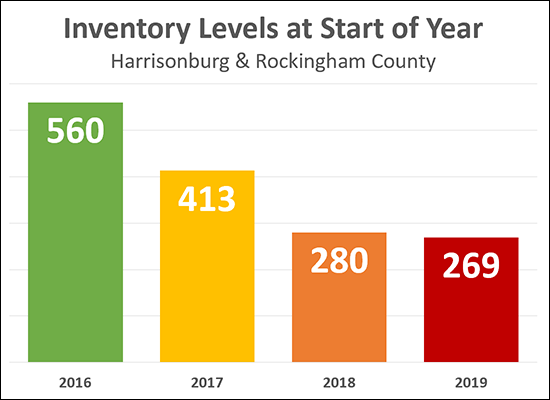 Inventory levels have fallen rather consistently over the past several years:
And yet -- somehow -- buyers were able to buy pretty much the same number of homes for each of the past three years:
So -- what gives? How does this work? Does it matter that inventory levels are much lower now than they have been over the past few years? Let's ignore, for the moment, any homes that come on the market and never sell and are taken back of the market. If we do so, then the information above might mean: 2016 = 1166 New Listings? Starting the year with 560 homes for sale, and selling 1313 during the year, and ending the year with 413 homes on the market would mean that around 1166 owners listed their homes for sale in 2016. (560 + 1166 - 1313 = 413) 2017 = 1128 New Listings? Starting the year with 413 homes for sale, and selling 1261 during the year, and ending the year with 280 homes on the market would mean that around 1128 owners listed their homes for sale in 2017. (413 + 1128 - 1261 = 280) 2018 = 1291 New Listings? Starting the year with 280 homes for sale, and selling 1302 during the year, and ending the year with 269 homes on the market would mean that around 1291 owners listed their homes for sale in 2018. (280 + x - 1302 = 269) So -- after all that -- Lower inventory levels at the beginning of the year (560 to 413 to 280) and during the year did not seem to affect the number of buyers who were able to find homes to buy. Sales stayed consistent-ish over the past three years despite these declining inventory levels. But -- Lower inventory levels make it less fun to be a buyer. Buyers have fewer choices at any given time and they will often have competition from other buyers when the home of their dream comes on the market. Lower inventory levels make the market move faster. With fewer options to choose from, buyers must be ready to act quickly. We saw this with a reduction in the median days on market over the past several years from 52 days to 33 days to 25 days. So, yes, lower housing inventory levels do matter -- mostly to buyers. Sellers are, usually, quite delighted to have lower inventory levels when they are ready to sell. Sellers will have less competition, and more likely to sell more quickly and negotiate less. | |
Harrisonburg Year End Housing Market Report Shows Increases in Sales and Prices |
|
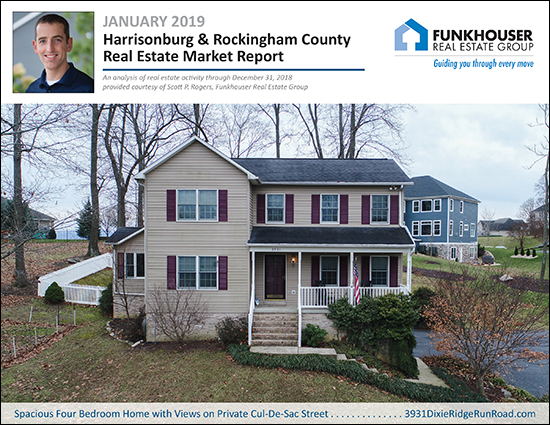 Happy Cold and Snowy January - and Happy New Year! Before we look back at a summary of our local real estate market in 2018, take a few minutes to explore the featured home pictured above, a spacious four bedroom home with views on a private cul-de-sac street at 3931DixieRidgeRunRoad.com. As per the norm, you can find a PDF of my full market report here. And now, let's take a thorough look at the overall performance of our local housing market in 2018... 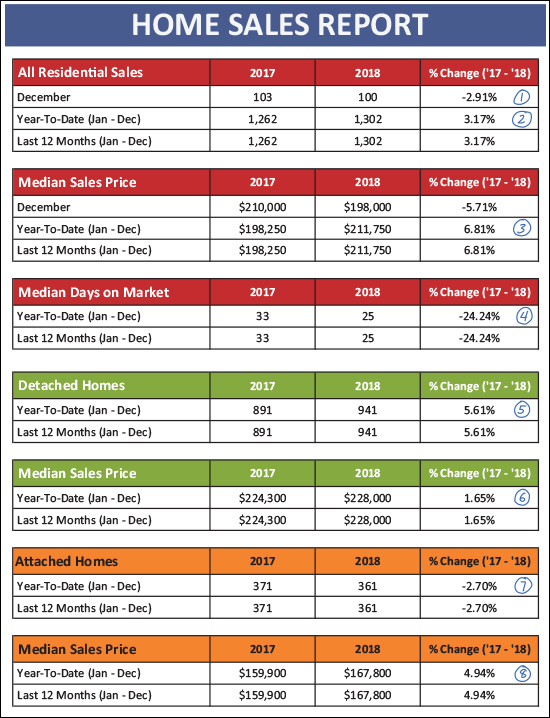 Overall, 2018 was a great year for the local housing market. Here are some key takeaways from December and the full year of 2018...
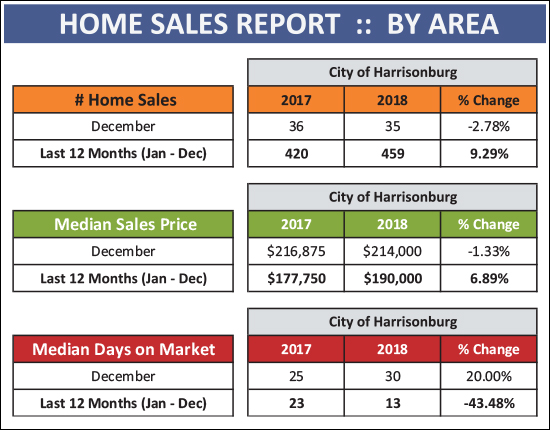 The City of Harrisonburg has been a particularly interesting market over the past year, as detailed above. Home sales increased 9.29% between 2017 and 2018, accompanied by a 6.89% increase in the median sales price (up to $190K) and home sold with a median days on the market of only 13 days! Homes went under contract quickly in the City of Harrisonburg last year -- and that seems likely to continue into 2019 given continued high buyer demand and low inventory levels. 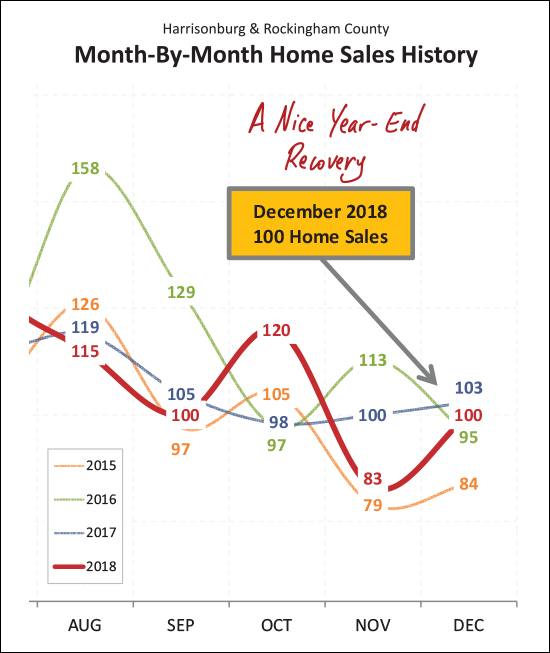 Home sales have bounced back and forth (up and down) over the past few months in Harrisonburg and Rockingham County. August, September and November were low to average as compared to the same month in previous years -- but October was a new high (120) and sales bounced back in December to a high-ish pace which helped round out an overall strong year of sales. 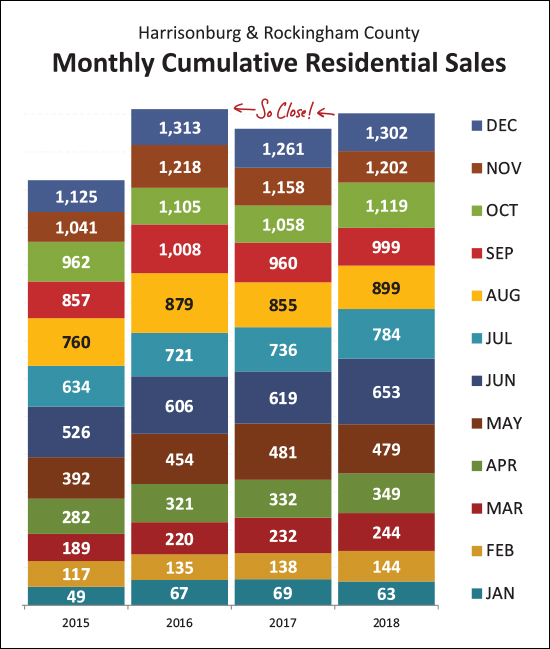 Just another look at the pace of home sales, above, for those (like me) who prefer pretty data visualizations. We came so (so) close to matching the 1,313 sales seen in 2016. And yes, we bounced back from the slight dip we saw in 2017. What, then, might be in store for 2019? Another 1,300+ year of home sales? I think so -- but we shall see! 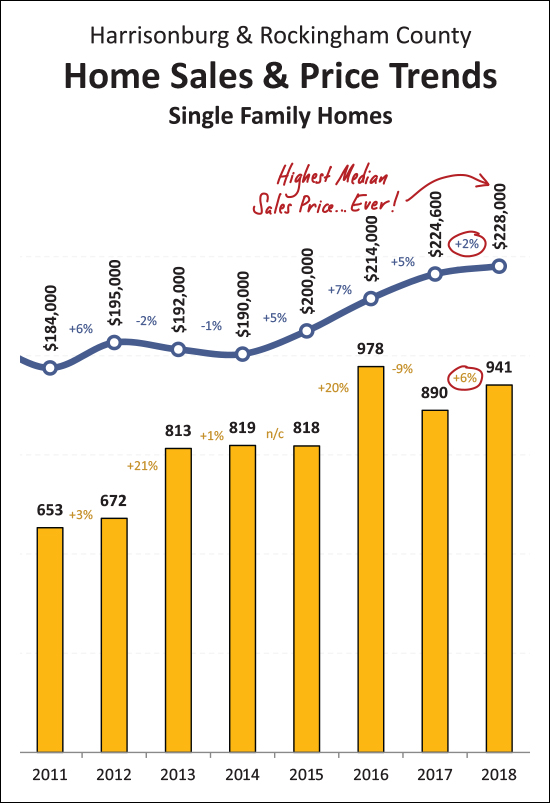 OK - a few IMPORTANT things to note here. Despite the fact that the overall median sales price for residential properties increased 7% in 2018 -- I don't believe home values increased 7%. Much of the 7% increase in the overall median sales price was a result of a larger number of (higher priced) detached homes selling in 2018 (as compared to 2017) and a smaller number of (lower priced) attached homes selling. This graph (above) then becomes important, as it shows the trend for detached homes only -- which is often a better indicator of changes in market value. You'll note that we saw a 6% increase in the pace of detached home sales and a 2% increase in the median value. So -- if you own a detached home in Harrisonburg and Rockingham County, it is likely that the value of that home increased 2% over the past year. Oh -- and I should point out that last year's median sales price of $228,000 for detached homes is THE HIGHEST median sales price we have ever seen on an annual basis in this market. 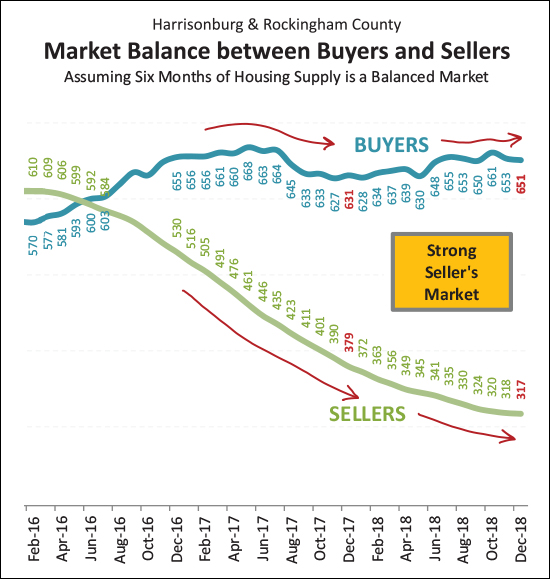 As shown above, we have seen a steady stream of buyers in the market over the past two years -- fluctuating from 620-ish to 660-ish in a six month period. Unfortunately for those buyers, however, they have had an smaller and smaller number of homes from which to choose. The number of sellers in the market -- as measured by inventory levels on a monthly basis -- has steadily decreased over the past two years. These two trends have combined to create an increasingly strong seller's market in Harrisonburg and Rockinhgham County. 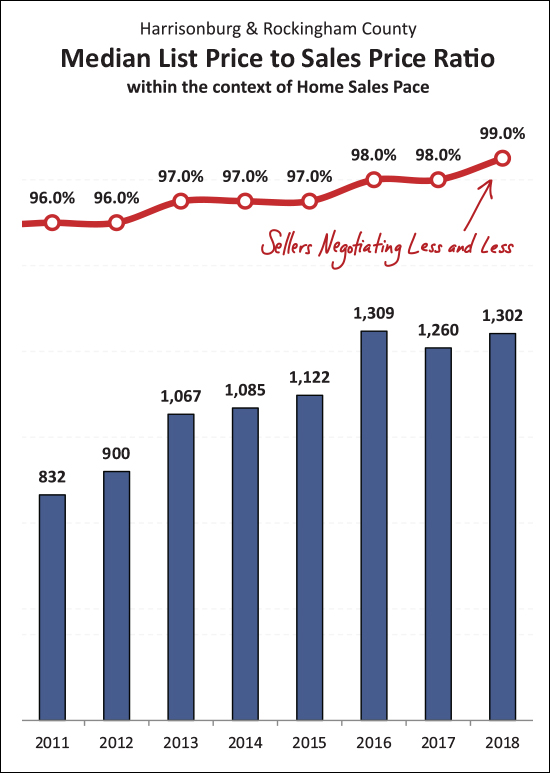 OK - this one is interesting - and I believe it is a sign of a healthy-ish real estate market. As shown via variety of graphs above, home sales are up, inventory is down, days on market is down -- and yet, the median sales price seems to have only increased by 2%. So - the strong seller's market has not (thank goodness!) resulted in irrational, unreasonable, unsustainable increases in sales prices. That said, sellers are negotiating less and less (as shown directly above) from their last list price. I say "last" list price because some sellers don't start with the best list price out of the gate, and have to reduce their list price. But in the end, sellers are negotiating less (around 1%) than they have in any recent year. 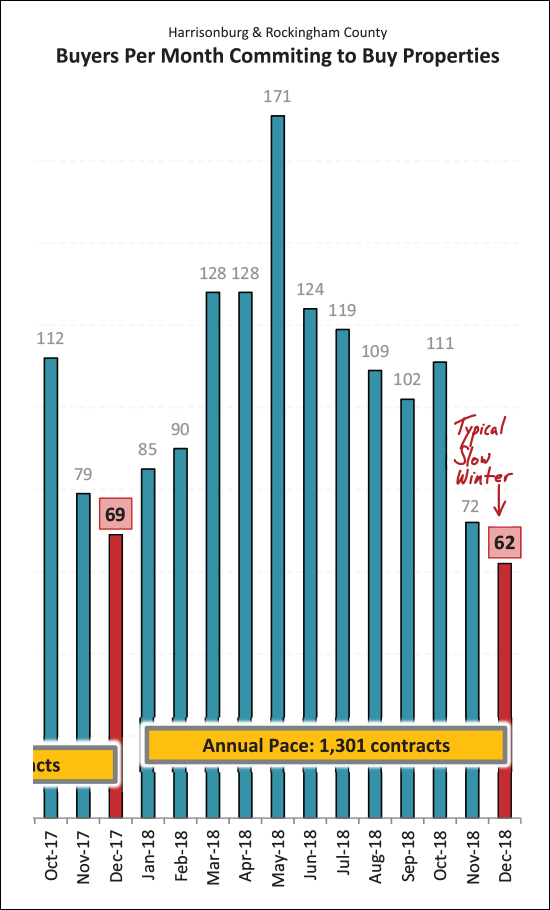 For the purposes of at least a small sneak peak ahead -- we saw only a small number of contracts (62) in December -- which is to be expected in this first month of Winter. We're likely to see a small number of contracts in January and February as well, if past years are any indicator, before home sales (contracts) start to pop again in March. 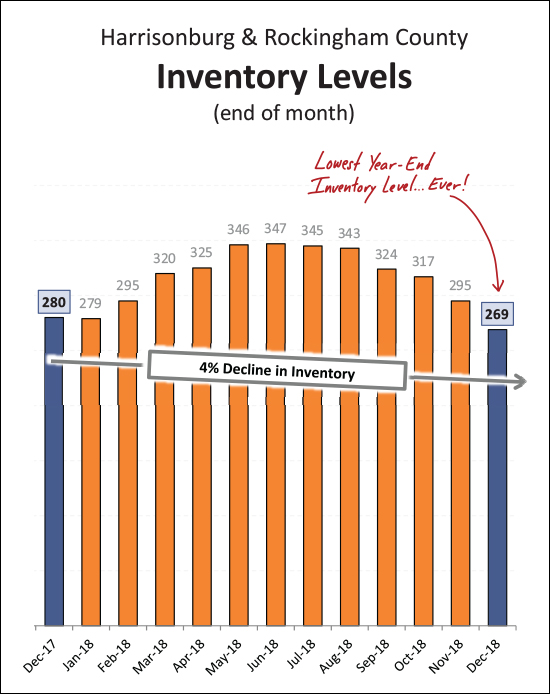 And there (above) are those low inventory levels I was referencing. In fact, the 269 properties currently listed for sale in Harrisonburg and Rockingham County is THE LOWEST inventory level we have ever seen in this area. So -- perhaps the small-ish (4%) year-over-year decline is an indication that we're getting about as low as we possibly can/could/will in this market. 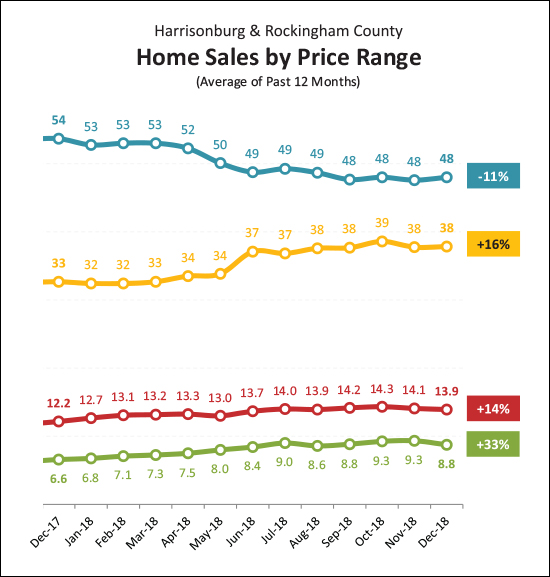 As one might expected, different price ranges are performing differently in our local market. The pace of home sales in the "under $200K" market continues to decline -- likely a result of properties appreciating out of this price range. We saw a sizable increase (+16%, +14%) in the middle market segments of $200K-$300K and $300K-$400K, and the largest increase in the $400K+ price range where home sales have increased 33% over the past year. 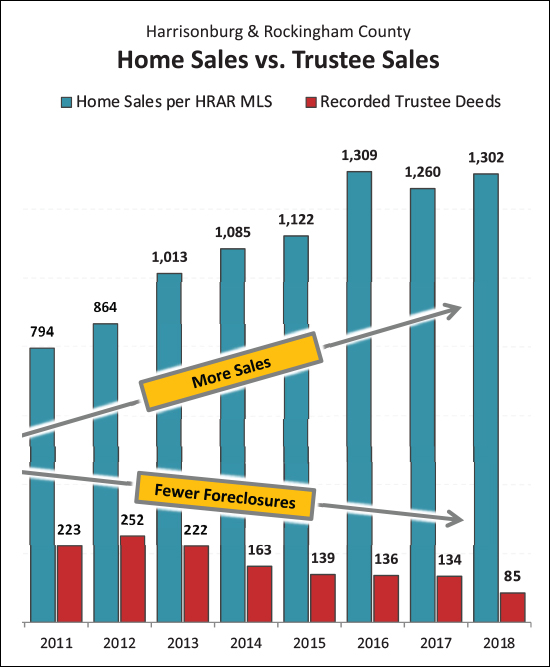 Another sign of health in our local real estate market is the ever declining number of foreclosures taking place. As shown above, there were only 85 foreclosures in Harrisonburg and Rockingham County last year -- a 37% year-over-year decline. 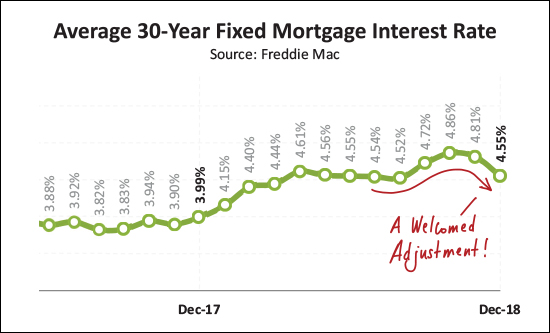 One last note -- we have seen a decline over the past few months in the average mortgage rate, which is exciting for buyers currently signing contracts to buy homes. We spent all of 2018 above 4% and we seemed to be quickly climbing towards 5% between August and October -- but the last few months of the year we saw things turn around and we are back closer to (or even below in some cases) 4.5%. OK - that wraps up my year-end overview of the state of our local housing market. I went into a bit more detail than usual this month -- though there is still PLENTY more in my full market report. You can download a PDF of the entire report here. And finally, a few quick links for you if you are thinking of buying or selling soon -- SELLERS -- even though it is a seller's market in just about every price ranges right now, you must still focus on price, condition and marketing. For further reading on buying or selling in this area, check out.... | |
When Will Home Buying Activity Ramp Up in 2019? |
|
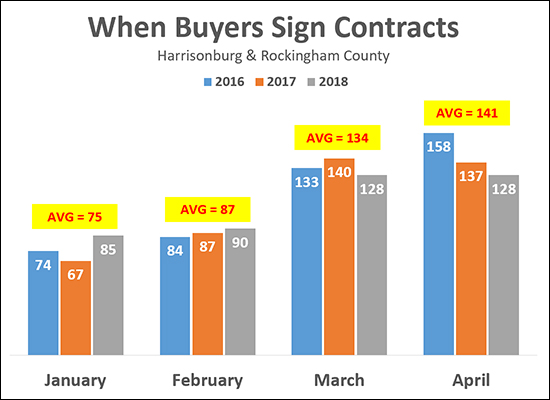 It should be no surprise that buying activity (contracts being signed) slows down over the Winter. As shown above -- an average of 75 buyers sign contracts in January, which then increases a bit, to 87, in February, and then makes an even larger jump in March to an average of 134/month. So, we're going to say the March is when we first seem a big jump in buyer activity. For that reason, many sellers wait until March (or even April) to put their homes on the market -- though the Spring market brings more competition from other sellers in addition to meaning that we'll start to see more buyers. Of note -- so far there have been 19 contracts signed in 2019 -- so still a ways to go to get to that average of 75 in January. | |
Would Be City Townhouse Buyers Finding Few Options |
|
Some time ago, I created a website (HarrisonburgTownhouses.com) for exploring townhouse communities in and around Harrisonburg, Virginia. This allows you to explore sales trends, value trends, see recent sales, current listings, etc. So -- feel free to explore the website -- but don't expect to find many townhouses listed for sale. If you were a buyer looking to buy a townhouse, built in the past 10 years, you'd have some difficulty. Current inventory (as of 1/8/2019) includes:
So - as excited as a first time buyer might be to purchase a townhouse in the City of Harrisonburg - they will find that they have very (!!) limited options right now. | |
When Are You Least Likely To Sell Your Home? |
|
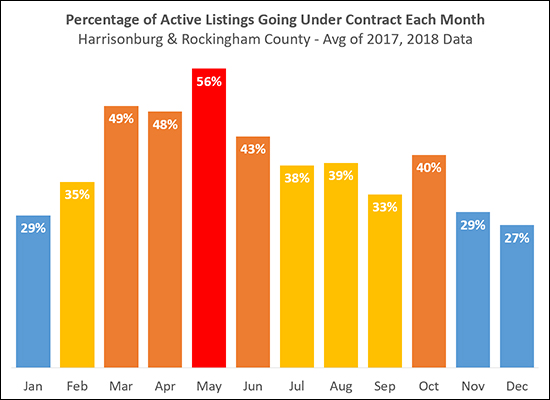 OK - these numbers are a bit abstract, but still interesting, in my opinion. The graph above is NOT showing a distribution of when buyers are buying homes. The likelihood of selling your home in a given month, per the graph above, is calculated by dividing the number of houses listed for sale at the start of each month by the number of houses that then go under contract that month. So -- if 300 houses are listed for sale at the start of the month, and 150 houses go under contract that month, you had a 50% chance of your house selling. This is somewhat inaccurate (we'll call it abstract, instead) because other houses do come on the market during that month. But still - by calculating the likelihood of selling in the same way each month we get a relatively reasonable comparative analysis of the likelihood of selling in any given month of the year. As should come as no surprise, you are most likely to sell your home in March, April, May or June -- or October! The months when you are least likely to sell your home are November, December and January -- and good news -- two of those months are already behind us! | |
My Predictions for the 2019 Real Estate Market |
|
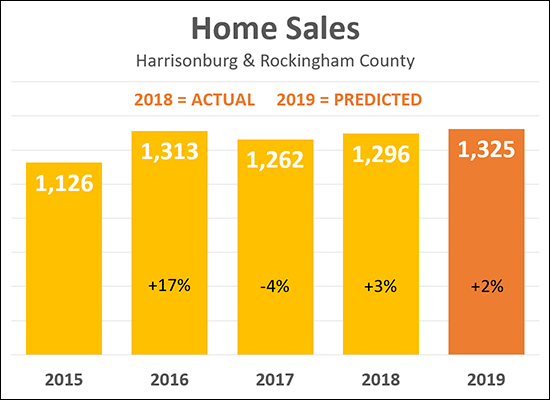 As is my annual tradition, I am making some predictions about what we'll see in the Harrisonburg and Rockingham County real estate market in 2019. As you'll note above, I am predicting that we will see 1,325 home sales this year - which is simultaneously a bold and conservative prediction. :-) If we see 1,325 home sales, it will be the HIGHEST number of home sales seen any time in the past year. But yet, those 1,325 home sales would only be a 2% increase over the pace of home sales in 2018 -- which would be the smallest annual increase in the pace of home sales seen over the past few years. I think we will still see relatively low inventory levels this year, but yet buyers will still find enough homes that match their criteria to allow for this increase in home sales. With a growing local population, a steady local economy and relatively low mortgage interest rates, it seems likely that we'll see a continuation of slow annual increases in the pace of home sales. And how about those prices? 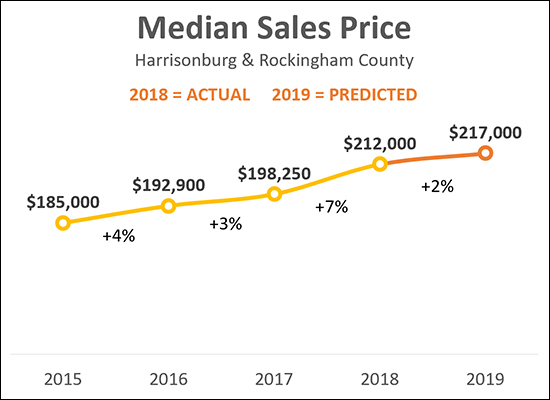 Above, you'll note that I am predicting that the median sales price in Harrisonburg and Rockingham County will increase 2% to $217,000 in 2019. Going with bold and conservative again -- this is a bold prediction, in that it be the highest median sales price ever seen in this area -- but at the same time is only a small increase in median price over last year, and a much smaller increase than seen between 2016 and 2017. Keep in mind (I know I've said it a lot lately) that the 7% increase in the median sales price in 2018 was not necessarily an actual 7% increase in home values -- but rather a shift towards more (higher priced) single family homes selling and fewer (lower priced) townhomes, duplexes and condos selling -- resulting in 7% increase in the median sales price of the combination of those two property categories. OK - enough about my predictions --what about for you? Email me (scott@HarrisonburgHousingToday.com) and let me know where you think our local market will go in 2019. And keep up with all the market data between now and next January by signing up to receive my monthly housing market report by email if you are not already receiving it. | |
Comparing My 2018 Housing Market Predictions To Reality |
|
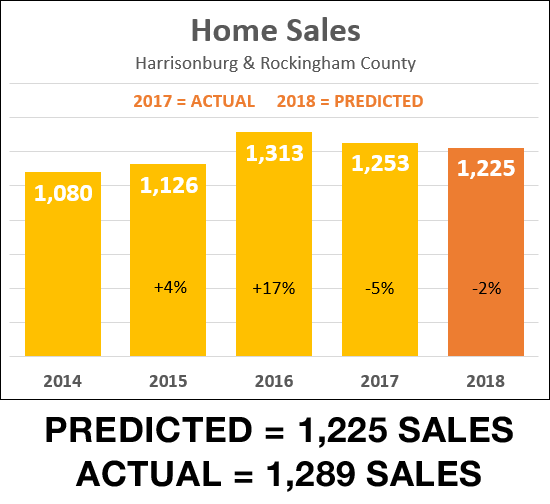 As shown above, I was a bit too conservative in predicting 2018 home sales. After we saw a 5% decline in the pace of home sales between 2016 and 2017 I was predicting we'd see another (smaller) decline of 2% between 2017 and 2018. As it turns out, we actually saw almost a 3% *increase* between 2017 and 2018. Even though we had low inventory levels all year long, buyers still found homes to buy -- which created a slight increase in the pace of sales, and a further decline in "days on market" in 2018. 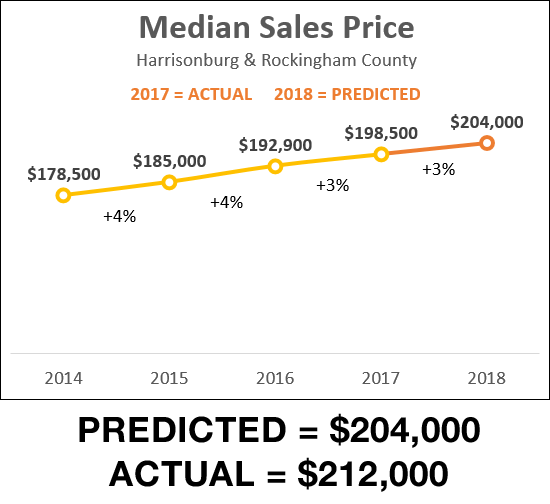 And -- I was a bit too conservative on the change in median sales price as well! After a 3% increase between 2016 and 2017 I was predicting another 3% increase between 2017 and 2018. But no, we actually saw almost a 7% increase between 2017 and 2018 up to $212,000. Please note, again, that this 7% increase in the median sales price might be (almost certainly is?) the result of a change in the mix of what (detached vs. attached) as opposed to all values actually increasing by 7%. Read more here. Stay tuned for some predictions for 2019 in the coming days! | |
Home Sales Rise By (at least) 2% in 2018 |
|
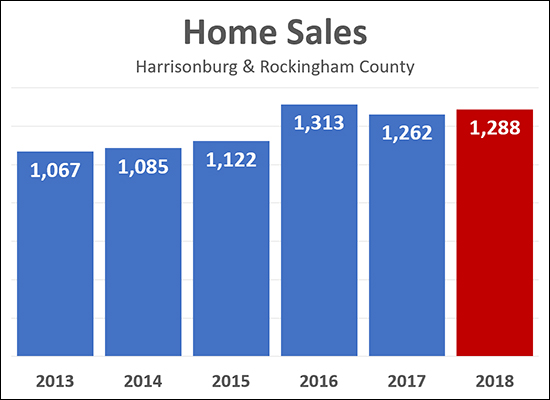 All home sales have not yet been reported but it is seems that we will see around a 2% increase in the pace of home sales in Harrisonburg and Rockingham County between 2017 and 2018. With 1,288 home sales recorded in the MLS thus far for last year, we may see that figure rise a bit more over the next few days, but not by much. This is a slight increase compared to last year -- though still a slight decline as compared to the high seen in 2016...
Stay tuned for my full market report in the next week or so, as well as predictions for the 2019 housing market. Oh, and HAPPY NEW YEAR! | |
Scott Rogers
Funkhouser Real
Estate Group
540-578-0102
scott@funkhousergroup.com
Licensed in the
Commonwealth of Virginia
Home Search
Housing Market Report
Harrisonburg Townhouses
Walk Through This Home
Investment Properties
Harrisonburg Foreclosures
Property Transfers
New Listings

