| Newer Post | home | Older Post |
Did The Local Housing Market Slow At The End Of 2018? |
|
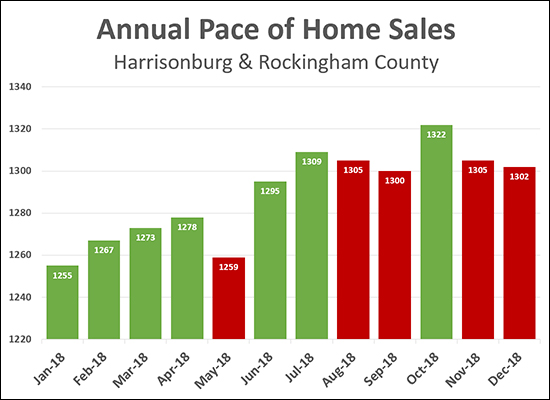
 Oh my heavens! Take a look at the graph above! DID the local housing market slow at the end of 2018??? I am going to lean towards: sort of, maybe a bit, but not much. The graph above...
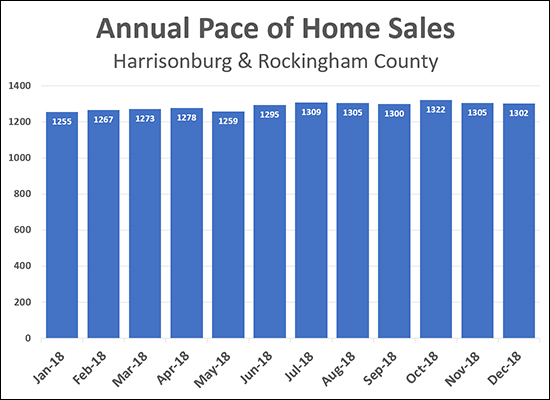
So -- if you like the high stress graph above that unintentionally uses Christmas colors, and might make you feel unsettled about the changing tide of the local home sales market -- then stick with that one and close your email/browser. If you want an alternate perspective on the same data, keep reading...  This graph (above) shows the same data as the first graph -- but by taking the Y axis all the way down to zero we get a better sense of the fact that the slight declines in the annualized pace of homes sales in the second half of 2018 were just that -- slight. So -- is the sky falling? Are home sales declining? Did we peak in mid-2018? Well, maybe, but I don't think we can conclude that definitely or with much conviction at this point. The overall downward adjustments were rather small compared to the total number of homes selling on an annual basis. Stay tuned, then, for 2019 -- eventually we'll be able to draw some more conclusions about what actually happened in 2018! :-) Recent Articles:
| |
| Newer Post | home | Older Post |
Scott Rogers
Funkhouser Real
Estate Group
540-578-0102
scott@funkhousergroup.com
Licensed in the
Commonwealth of Virginia
Home Search
Housing Market Report
Harrisonburg Townhouses
Walk Through This Home
Investment Properties
Harrisonburg Foreclosures
Property Transfers
New Listings

