| Newer Post | home | Older Post |
Local Real Estate Market Holds Steady in January 2019 |
|
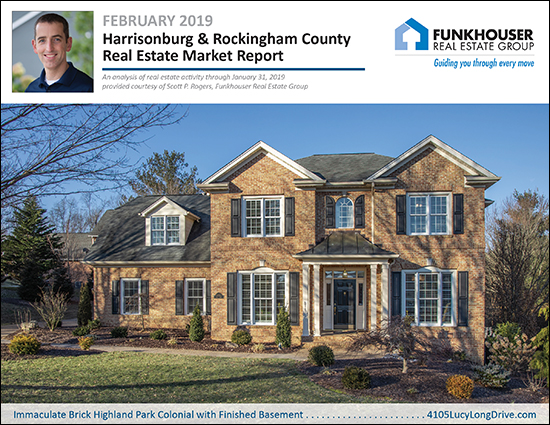 I hope you are finding time to enjoy this one sunny day this week - amidst clouds, rain and snow the rest of the week. Perhaps the bright news in this update on the real estate market will buoy your spirits when the clouds return tomorrow. :-) But before we dive into the data, be sure to check out the home pictured above, an immaculate brick Colonial in Highland Park, by visiting 4105LucyLongDrive.com. Oh, and as per my usual habits, you can skip right to a PDF download of the full market report here, or read on for my color commentary... 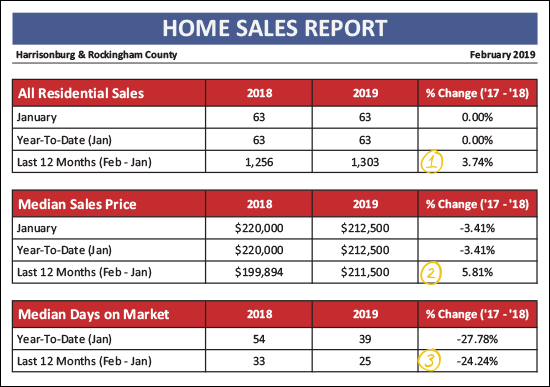 OK - starting off with an evaluation of the market as a whole, the chart above shows us that the exact same number of buyers (63) bought in January 2019 as bought in January 2018. Thus, it was the slowest month of the year - but exactly as slow as things started last year. (1) When we look at a longer timeframe (Feb 2018 - Jan 2019) we see that 1,303 buyers bought homes in Harrisonburg and Rockingham County -- which marks a 3.74% increase in buyer activity as compared to the previous year. (2) The median sales price of the homes that have sold in the past 12 months was $211,500 -- which is 5.81% higher than the median sales price during the prior year. So, perhaps prices are on the rise. Or, perhaps different homes are selling. Read on for more on this. (3) Homes are selling quickly -- QUICKLY! -- with a median "days on market" of 25 days over the past year, a 24% drop from 33 days the prior year. Now, let's break things down between detached homes and attached homes. Attached homes are townhouses, duplexes and condos... 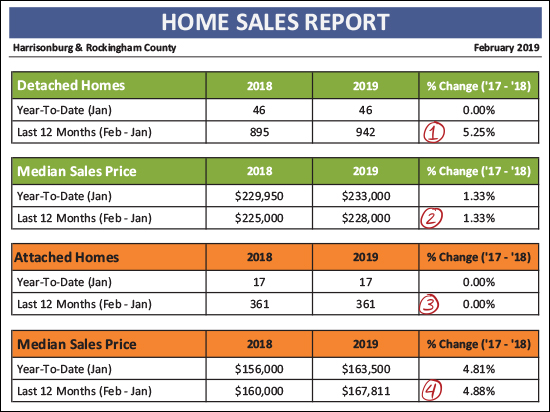 There is a good bit to soak in here, on the chart above, as well. (1) The 942 buyers who bought detached homes over the past 12 months contributed to 5.25% more buyer activity -- for this type of property -- as compared to the previous 12 months. (2) The median sales price of those 942 detached homes was $228,000 -- a whole (not actually that exciting) 1.33% higher than the $225,000 value one year prior. (3) Talk about consistency -- 361 buyers bought attached homes (townhomes, duplexes and condos) in the past 12 months -- exactly the same number as during the previous 12 months. (4) The median sales price of those 361 attached homes was $167,811 -- a full 4.88% higher than the $160,000 value one year prior. 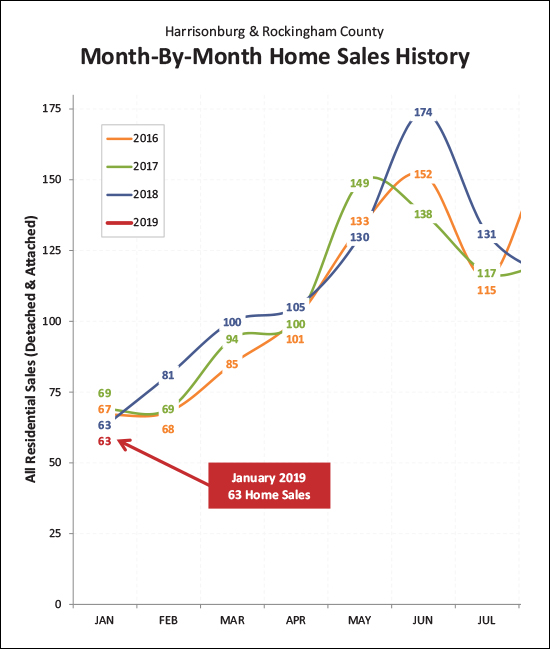 There it is, folks, the start of something great -- maybe? While it's true that January is the slooooowest month of the year for home sales AND this past January was the sloooooowest January seen in the past few years -- it is also true that last year was a near record breaking year of home sales, and we also started out with only 63 home sales in January 2018. So -- stay tuned -- perhaps this will be another vibrant year of sales activity for the local real estate market. 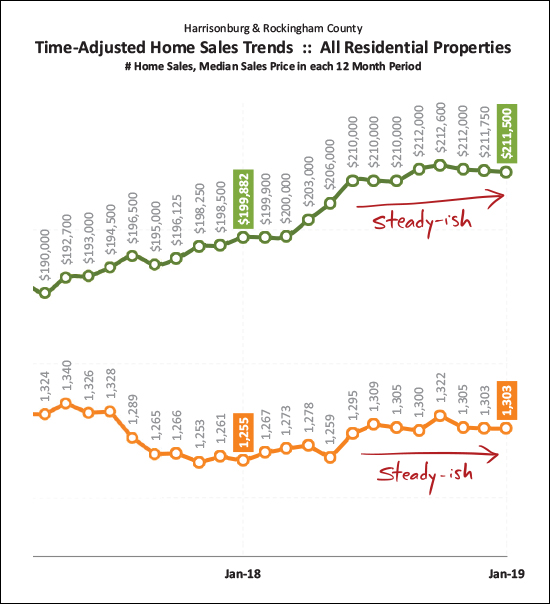 Staying steady - that's all I wish for our real estate market sometimes. The graph above shows a rolling 12 month value for the median sales price and the number of home sales taking place in our local market. You'll note that homes have been selling at a pace of around 1300-ish homes per year for the past six or so months -- and we've been hovering around the $210K-$212K mark for median sales prices. Staying steady-ish isn't too bad. I'd be happy with a 0% - 2% increase in the pace of home sales and a 2% - 3% increase in the price of home sales this year. We'll have to wait a few more months to get a better sense of if that is where we're headed. 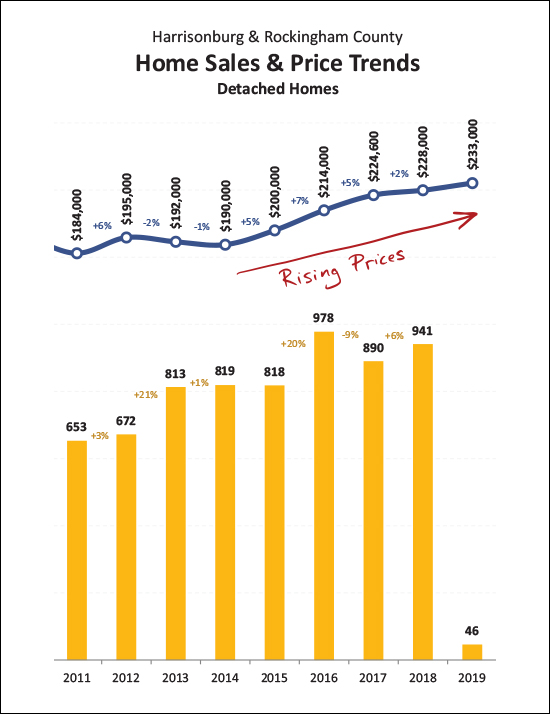 If asked, I think home values have risen by 2% over the past year, and the graph above is why I'm sticking to that number. If you look at all home sales in the area (attached and detached) you'll come up with a higher increase in the median sales price -- but I believe the change in the median sales price of detached homes is the best indicator of trends in market value -- and there was a 2% increase in the median sales price of detached homes between 2017 and 2018. Stay tuned to see how we fare in 2019 as more data keeps coming in. 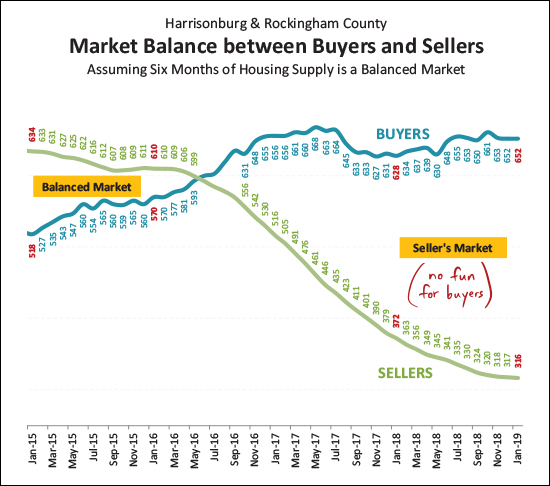 It's a great time to be a seller! As shown above, while the number of buyers in the market has stayed relatively consistent over the past (almost) two years, the number of homes on the market at any given point has continued to decline steadily. As such, this has become more and more of a seller's market. Homes are selling quickly and thus buyers must be ready to pounce on the home of their dreams when it is listed for sale. More on this at the bottom of this note. 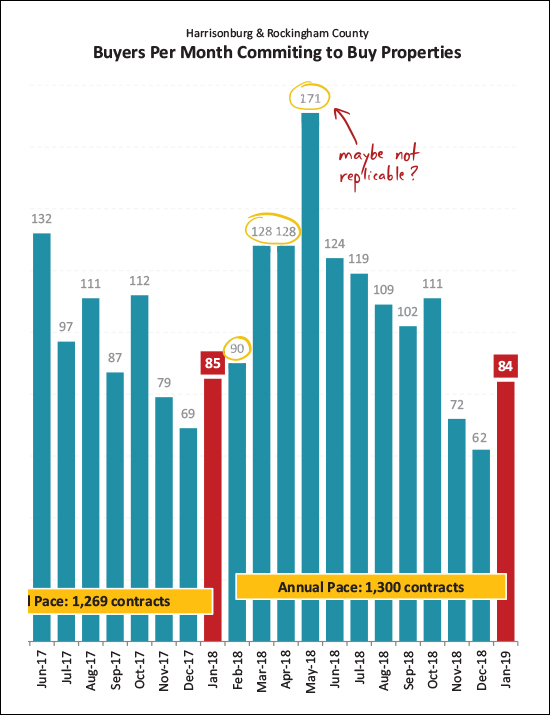 On this graph it might be most interesting to look backwards in order to look forwards. After a predictable mid-80's month of contract activity in January, it seems likely (based on history) that we'll see around that many buyers sign contracts to buy homes in February. But after that, look out! Buyer activity usually starts in earnest in March and April, where you'll see a 45% (ish) increase in buyer activity between Jan/Feb and Mar/Apr. The big question this year would be whether we really will / could have anywhere near as stellar of a month as we had last May for contract activity. Maybe not?? 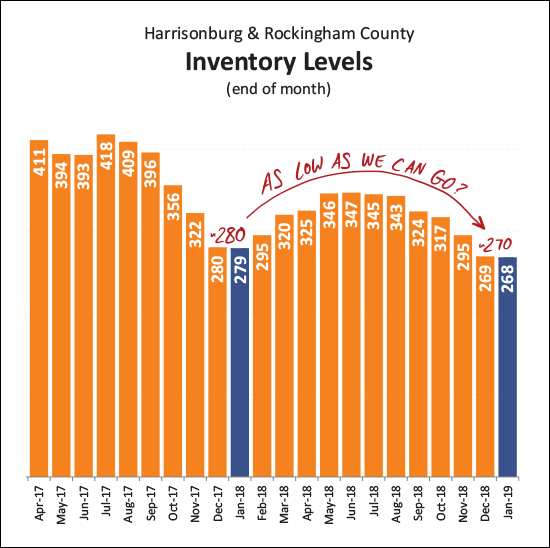 It is quite possible that inventory levels have dropped just about as far as they can possibly go. Over the past year we saw a seasonal rise and fall back to a just-below-300 inventory level as we started out January and February. It seems likely we'll get back up to a 340-350 level in the summer months, but absent a large new construction development starting in the area, it seems unlikely we'll get back up to 400 homes for sale at any given point in 2019. 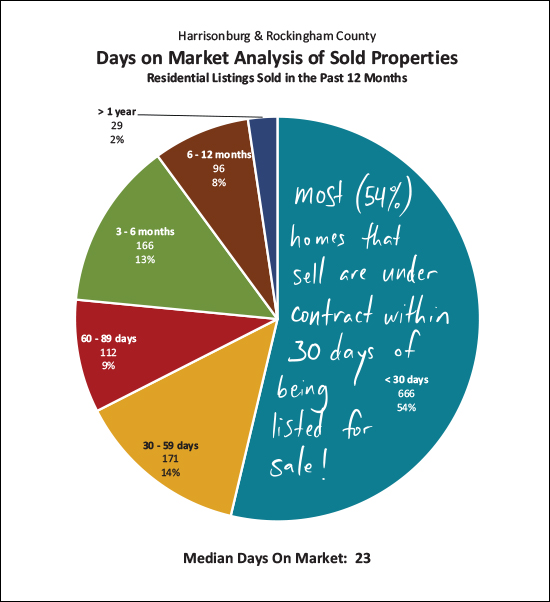 I said it earlier, but I'll repeat it. Homes are selling quickly! OK -- not all homes -- don't get overly distressed if your home is not under contract within 30 days of being listed for sale -- but quite a few (54%) of the homes that do sell are indeed under contract within 30 days of being listed for sale. If your home is not, let's talk about why, and what we might need to do to get it under contract within the next 30 - 60 days. 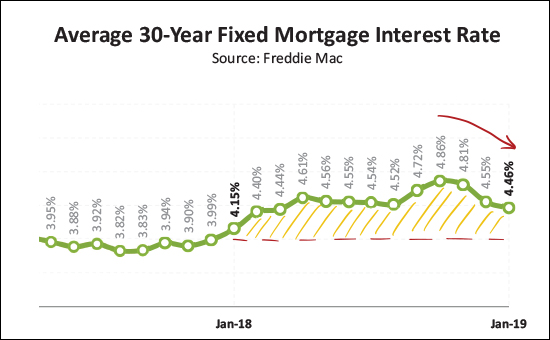 Refreshingly, after staying above 4% all year long in 2018 - and rising as high as 4.86% in October - they finally started to decline again and have continued to do so over the past few months. We're not back (barely) under 4.5% which is a nice relief for buyers in the near term. I'll pause there now, and commend any of you voracious readers of market updates who made it this far. :-) Read even more (!!) in the full PDF here, or feel free to shoot me an email with your thoughts, perspectives or questions on the market. And finally, a few quick links for you if you are thinking of buying or selling soon -- SELLERS -- even though it is a seller's market in just about every price ranges right now, you must still focus on price, condition and marketing. For further reading on buying or selling in this area, check out.... Recent Articles:
| |
| Newer Post | home | Older Post |
Scott Rogers
Funkhouser Real
Estate Group
540-578-0102
scott@funkhousergroup.com
Licensed in the
Commonwealth of Virginia
Home Search
Housing Market Report
Harrisonburg Townhouses
Walk Through This Home
Investment Properties
Harrisonburg Foreclosures
Property Transfers
New Listings

