| Newer Post | home | Older Post |
Home Sales Slow In February But Contract Activity Increasing |
|
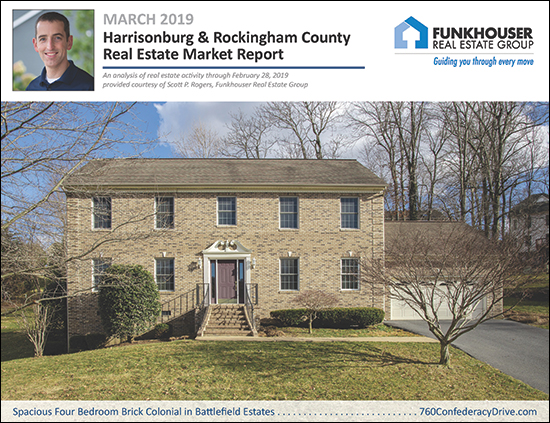 Happy Spring! Yesterday's warm sunny afternoon was a welcome reprieve from our recent frigid temperatures - and it looks like we'll have continued warm-ish (or at least not frozen) days this week as well. And how about that local real estate market? Is it heating up as well? Breaking out of the winter doldrums? Well, maybe not quite - though technically this report only covers real estate activity through the end of February, so maybe we'll have to wait one more month for some more exciting news. But buckle up, and let's flip through the latest local real estate news to catch up on where things have been and where we're likely headed. Oh - but two quick notes, first:
And now, here we go... 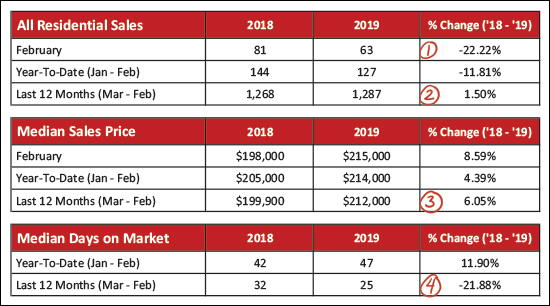 As seen above...
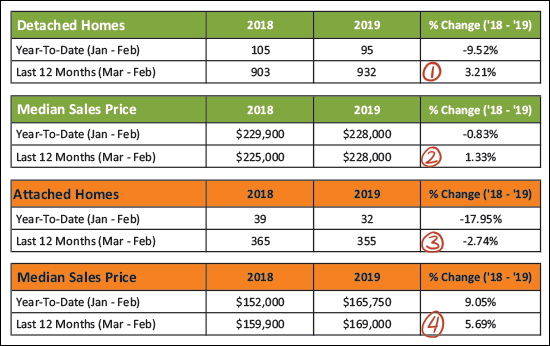 OK - lots going on above - this is where I break things down between detached homes (green) and attached homes (orange) -- where "attached" homes are townhouses, duplexes and condos.
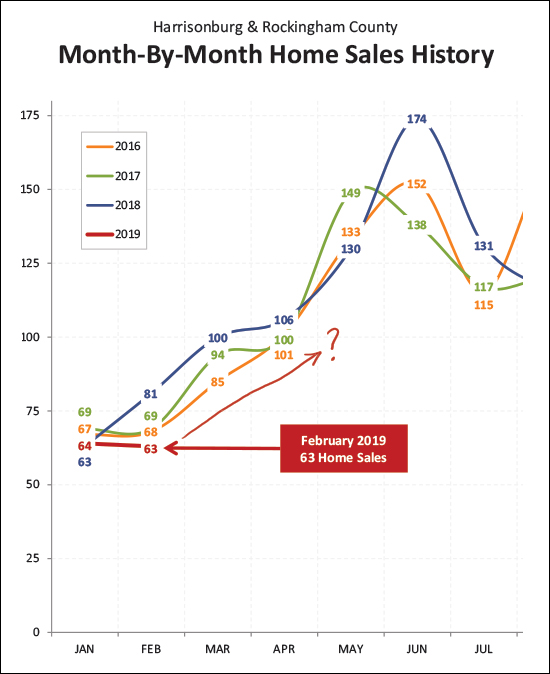 The red line above shows the sales trajectory for 2019 -- January sales (64) were right in the middle of the pack as January goes -- but February sales (63) were much slower (lower) than last year (81) though not too far off of the prior two years (68, 69). So - where in the world do we go from here? Do we see a relatively disappointing March with only 80 home sales (lowest since prior to 2016) or do things bounce back up to 95 or 100 home sales? Time will tell - but thus far the market performance has not been overwhelming in 2019 when it comes to the number of homes that are selling. 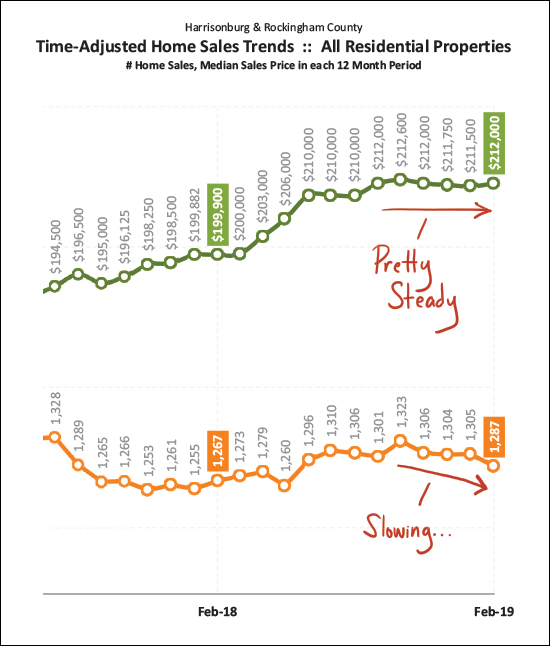 Now, looking beyond the month-to-month trends -- this graph (above) looks at a rolling 12 month timeframe to even out some of the ebbs and flows of market activity. The top (green) line shows that median sales prices have been relatively steady for the past six months -- hovering between $210K and $213K. The bottom (orange) line shows that the annual pace of home sales has actually been slowing in recent months. If home sales keep slowing down, eventually that could have an impact on sales prices, but for now they are holding steady. It is also certainly possible that the slowdown in home sales has more to do with a lack of available inventory than it does with any decrease in buyer interest. 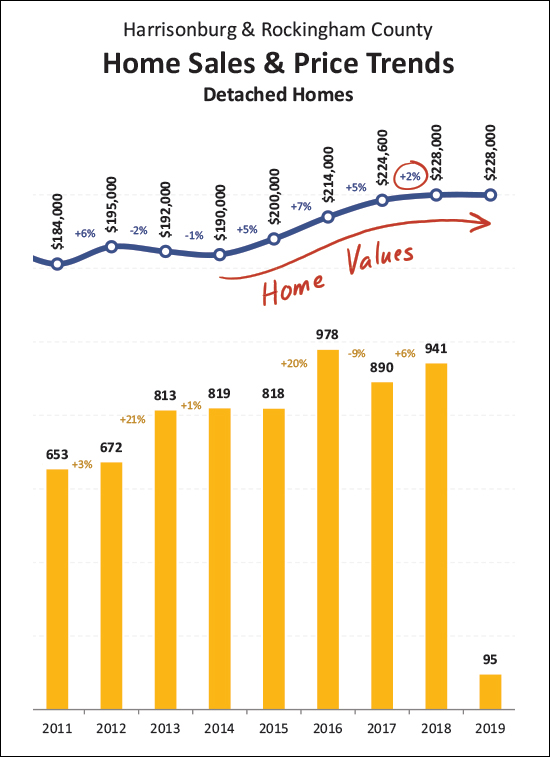 Here (above) is another pretty graph to show the increasing home values in Harrisonburg and Rockingham County over the past few years. Though - curb the boundless enthusiasm for a moment - the annual increase was only 2% in 2018, down from 5%, 7% and 5% the prior three years. So -- 2019 will be a telling year -- will values hold steady, or increase slightly, or decline slightly? Stay tuned -- it's early yet. 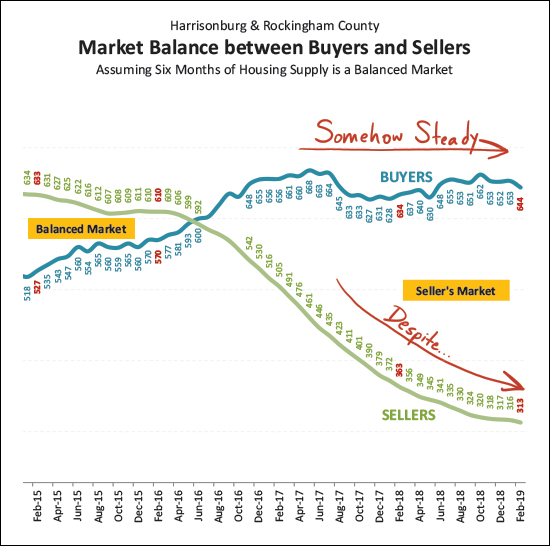 And this (above) might be the missing piece of the puzzle. Buyer activity (blue line) is somehow staying steady-ish (except dipping a bit over the past few months) despite the quickly falling inventory levels (green line) over the past three (four!) years. I've said it recently but I'll say it again - it can be a fun time to be a seller right now - but it's not so fun to be a buyer. You'll be choosing from an ever smaller number of available properties, and potentially competing with ever more buyers. 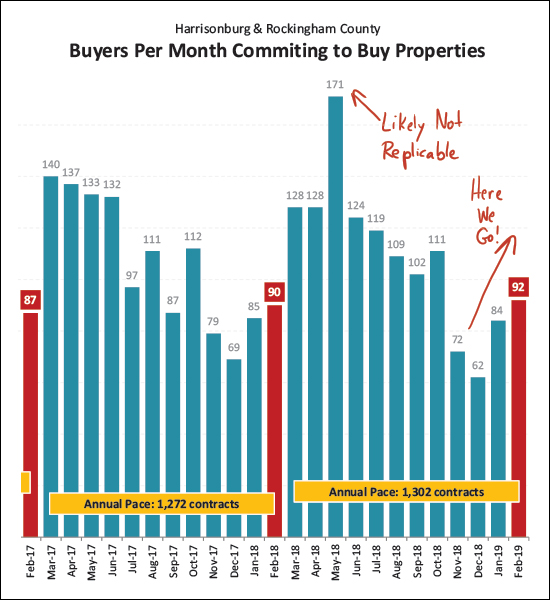 Here's one graph of optimism as it relates to the next few months -- contract activity is on the rise with 92 contracts signed in February 2019, up from 90 last February and 87 the February before that. So - we will likely see a solid month of sales activity in March, and hopefully in April if we have another strong month of contracts in March. But, just to prepare you pretty early here -- I think it is HIGHLY unlikely that we'll see a month with 171 contracts like we saw last May. 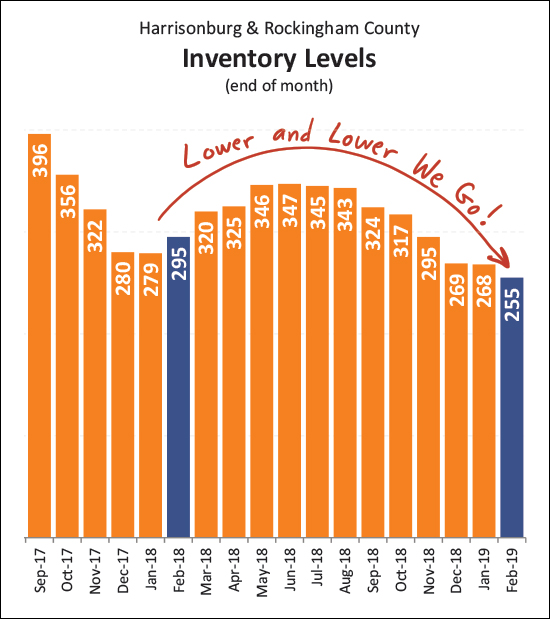 And here is a visualization of those inventory woes I was describing earlier. The number of homes for sale has been creeping ever lower, hitting yet another new low at the end of February with only 255 homes for sale. Hopefully, maybe, possibly, we'll see that start to drift upwards as we get into March, April and May?? 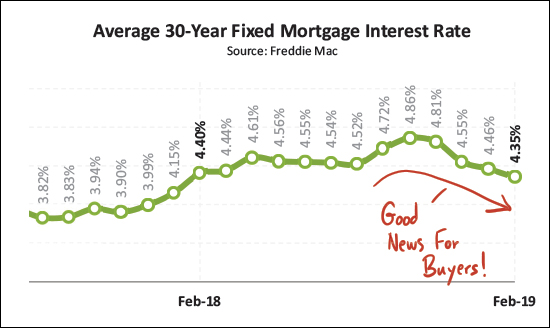 If buyers have anything (anything!?) to be glad about -- it's that their mortgage rate will likely be lower now than it would have been a few months ago. After average rates drifted all the way up to 4.86% -- and seemed to be ready to get back to 5% -- they started floating back down to their current average of 4.35%. If buyer activity increases over the next few months, they'll be enjoying more affordable financing of their home purchase. OK - admittedly - that was a lot. Kudos to any of you who made it all the way to the bottom of this commentary. Many trends stay relatively similar from month to month but it's always good to take a fresh look to give us a context to help make informed real estate decisions moving forward. If you're thinking of buying or selling soon... SELLERS -- even though it is a seller's market in just about every price ranges right now, you must still focus on price, condition and marketing. For further reading on buying or selling in this area, check out.... Recent Articles:
| |
| Newer Post | home | Older Post |
Scott Rogers
Funkhouser Real
Estate Group
540-578-0102
scott@funkhousergroup.com
Licensed in the
Commonwealth of Virginia
Home Search
Housing Market Report
Harrisonburg Townhouses
Walk Through This Home
Investment Properties
Harrisonburg Foreclosures
Property Transfers
New Listings

