| Newer Post | home | Older Post |
Harrisonburg Area Home Sales Remain Strong in 2020 Despite Slower February |
|
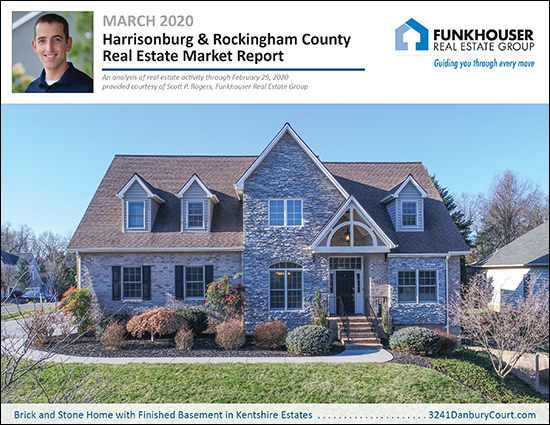 This month's featured home (shown above) is located in Kentshire Estates and you can find out much more about it out by visiting 3241DanburyCourt.com. OK. Now. Let's set the stage... Home sales slowed and prices fell in February 2020. Ahhh! Is the sky falling? Before you lump this news in with the rise of the coronavirus and the decline of the stock market -- remember two things...
So, there we go. Read on to better understand both short and long term trends in our local housing market -- but don't let a few less-than-exciting short term trends make you think our local housing market is (necessarily) experiencing anything as dramatic as what you're hearing about in the (health and economic) news of the week. Moving out from my drawn out intro -- here's the PDF of the entire report -- and let's dive in... 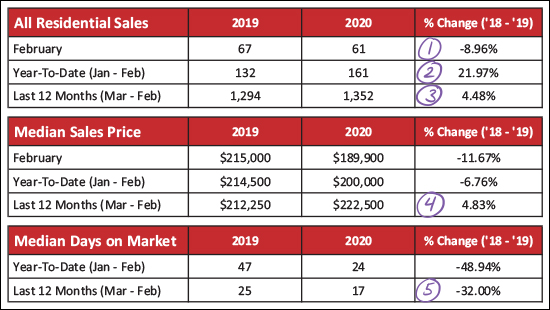 Lots to see and think about above...
This next graph could - again - scare you, given the sort of crazy news we're hearing about all day long this week... 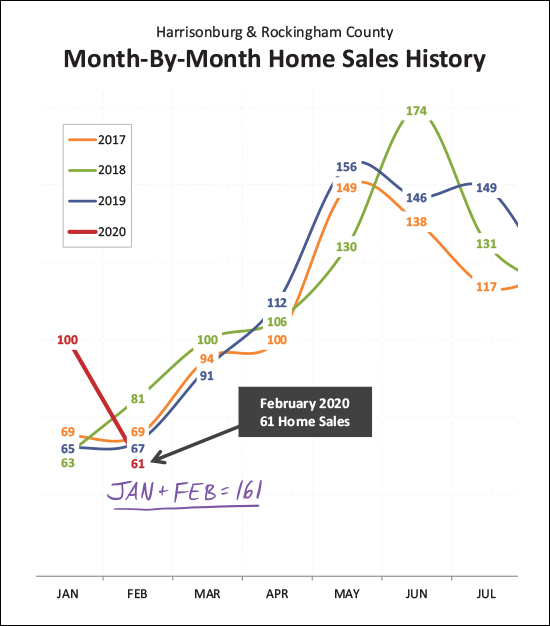 January 2020 was the strongest January we've ever seen -- and it was followed by one of the slower months of February in recent years. Again, should we panic? That red line is going nearly straight down! Here's my take on it -- any given month can be abnormally strong and any given month can be abnormally weak -- perhaps January was overly strong and February was overly weak. I come to this conclusion by looking at January and February sales combined, and am noting that the 161 sales in these two combined months is much higher than the same two months during the previous three years. So -- this isn't a message of "don't worry about that slow, slow February - everything is going to be just fine - trust me" -- it's more of a message of "the market still seems to be quite strong despite a slightly odd (slow) February." And now, we might be done with the nail biting portions of this monthly update on our local housing market, because most of the remainder of these graphs focus on the big picture and the long term trends... 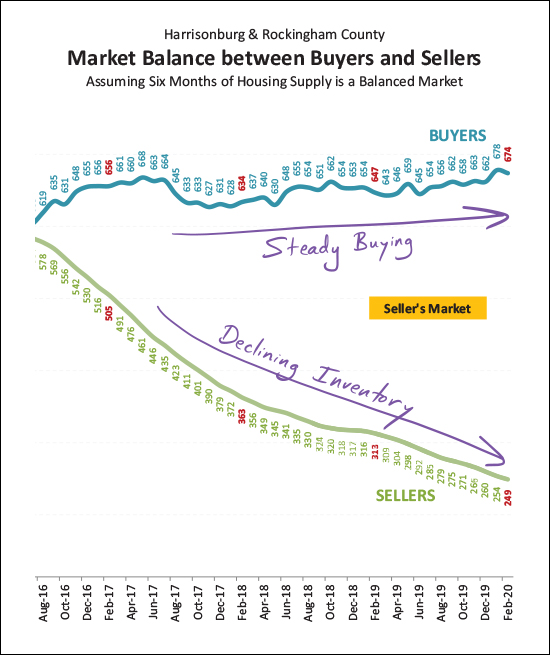 As shown above, buyers have been steadily buying homes at a slightly (just slightly) faster pace for each of the past few years -- but they have been choosing from a smaller and smaller pool of homes for sale at any given time. This has created a strong "seller's market" where many homes are seeing a flurry of showings when they first come on the market and sometimes are seeing multiple offers. 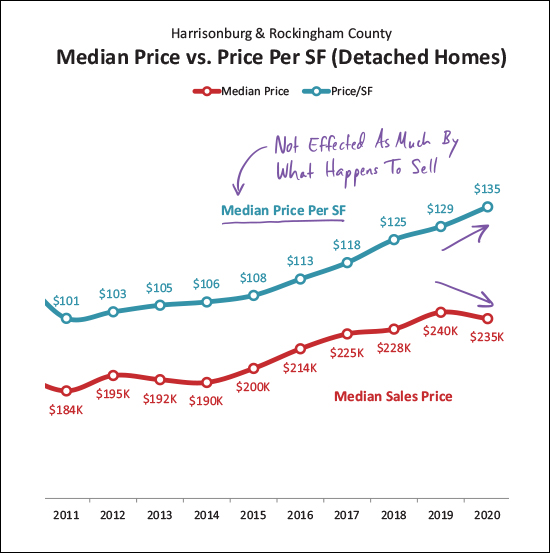 I don't usually include the graph above in this monthly re-cap, but I thought it was helpful this month. The median sales price has declined slightly between 2019 and 2020 (looking only at January and February 2020, of course) but you will note that the median price per square foot has increased during that same timeframe. This is a good indicator that the downward shift in sales prices is likely a change in what is happening to sell, more so than a change in home values. If more smaller homes are selling thus far in 2020 (as compared to all of 2019) then the median sales price would decline while the median price per square foot increases. 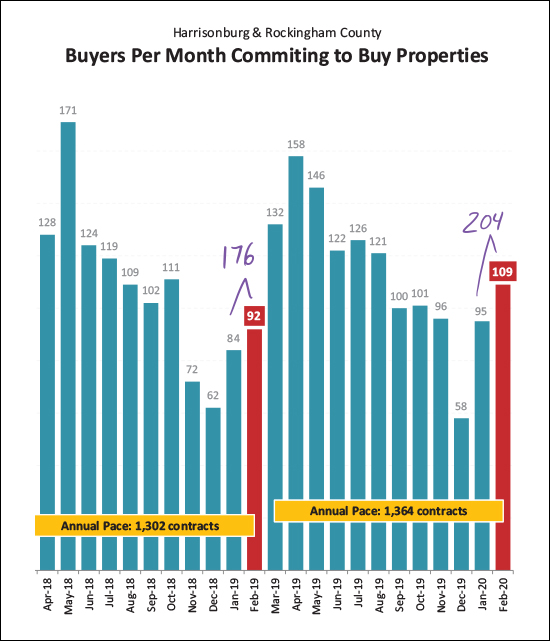 Another important distinction to make when thinking about short term market trends -- changes in the pace of closed sales are not a good measure of current buyer behavior, they just show how many buyers were (or were not) signing contracts 30 to 60 days ago. So, the fact that there have been 204 contracts signed this January and February -- compared to only 176 last January and February -- is likely a good indicator that we will see (closed) home sales bounce back up again in March and April. 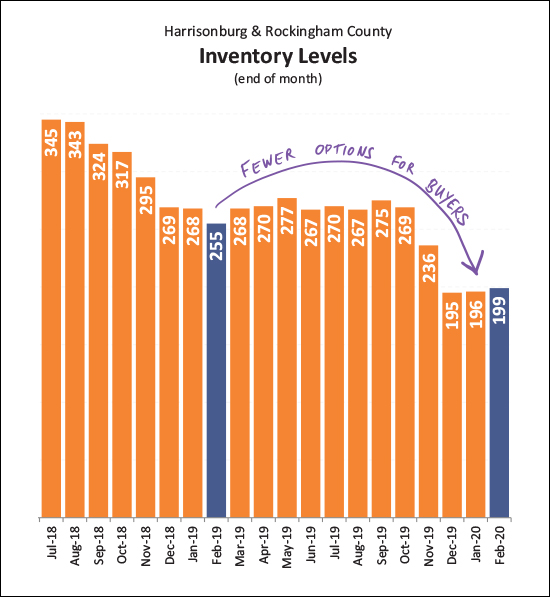 One of the main story lines of the past few years has been fewer and fewer choices for buyers in the market -- and this has continued into 2020. The number of homes on the market at any given time continues to fall -- and has now been (slightly) below 200 for three months in a row. This makes it a thrilling time to sell (many showings, sometimes multiple offers) but makes it a nerve-racking, frustrating time to (try to) buy a home. 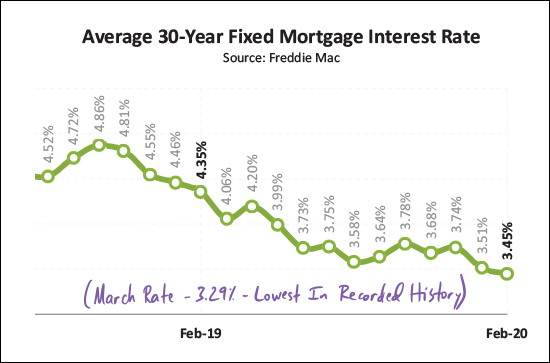 OK -- if there is one trend in this report that is definitely and 100%, completely, and fully related to the coronavirus, this (above) is the one. The Federal Reserve cut its benchmark interest rate by half a percentage on March 3 to try to combat any adverse economic effects of the coronavirus. That March 3rd rate cut isn't shown above, since my graph only goes through the end of February, but it caused the already low average rate of 3.45% to dip even lower, down to the current level of 3.29%, which is the lowest average mortgage rate that we have ever seen for a 30 year fixed rate mortgage. OK, alright, we made our way through the data for the month. There is much more, of course, in the full PDF of my market report. As we continue to learn more about the coronavirus I hope that you and your family and friends remain well. I don't expect that we'll see drastic ramifications of the coronavirus on our local real estate market because I believe people will still need housing, and people will still have jobs - but we will all have to closely monitor how things develop from here. My advice from last month still applies... If you're planning to sell your home in 2020 -- let's chat SOON about the best timing for doing so, what you should do to prepare your home for the market, and of course, we'll want to start by analyzing your segment of the market. As always -- shoot me an email if you have follow up questions or if you want to chat about your plans to buy or sell. Recent Articles:
| |
| Newer Post | home | Older Post |
Scott Rogers
Funkhouser Real
Estate Group
540-578-0102
scott@funkhousergroup.com
Licensed in the
Commonwealth of Virginia
Home Search
Housing Market Report
Harrisonburg Townhouses
Walk Through This Home
Investment Properties
Harrisonburg Foreclosures
Property Transfers
New Listings

