| Newer Post | home | Older Post |
Local Home Prices Still Rising Despite Slightly Fewer Home Sales |
|
 Happy Monday Morning! We're nearly halfway through the year now, and it has been a year like no other when it comes to our local real estate market and in so many other ways. Read on for an overview of our local housing market, or click here to download a 28-page PDF with all of the latest local housing market trends. But before we dive into the data, take a few minutes to check out this custom-built cedar log home on 2.81 acres one mile from Sentara RMH by visiting 3193TaylorSpringLane.com. Now, on to the data... 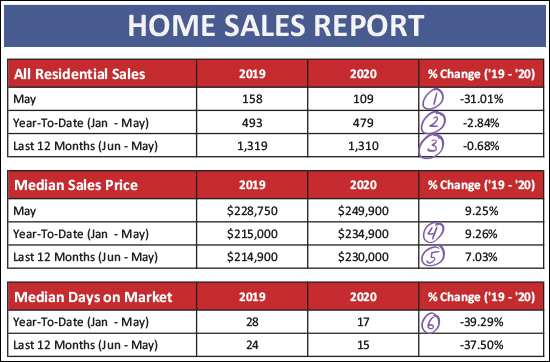 So much to point out here as this has been anything but a "normal" year...
OK - that was a lot of words to absorb - let's get to more visuals and fewer words. Relax and sip your coffee as you scroll through the following trends - knowing you'll be smarter, even if a bit more confused, by the time you get to the bottom of this overview... 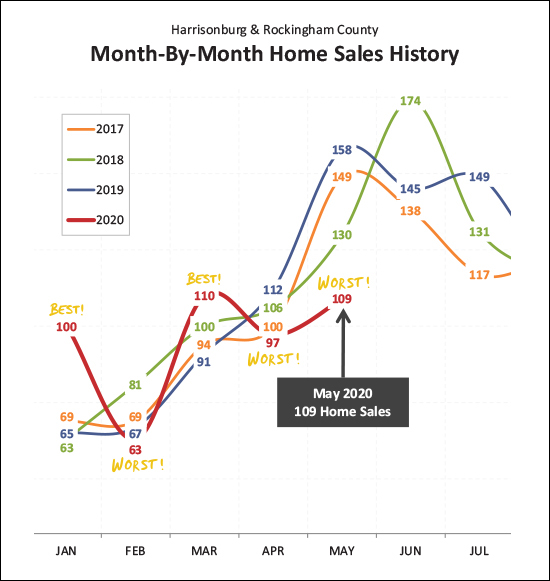 This has been a year of bests and worsts! Home sales were on fire in January and March (best months ever) and were dreadfully slow in February, April and May (worst months ever) - leaving no clear indication of whether we should be extraordinarily excited or depressed about 2020. Maybe we are experiencing this same dichotomy as we think about other aspects of 2020 as well!? :-) But when viewing these bests and worsts piled on top of each other... 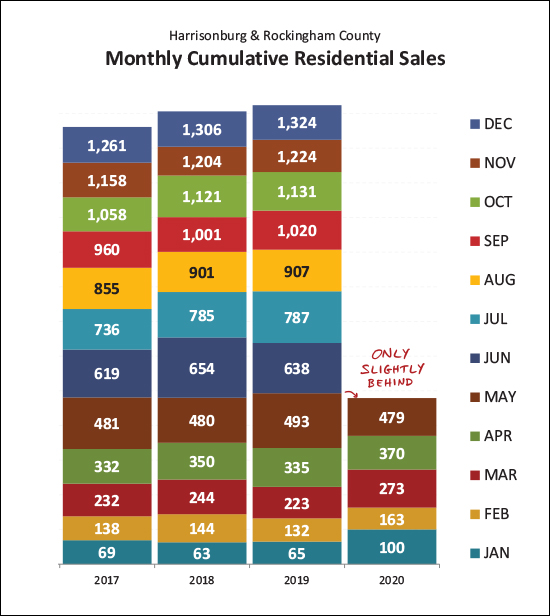 The positive impact of the strong months (Jan/Mar) have almost entirely made up for drag of the slow months (Feb/Apr/May) bringing our year-to-date total of home sales up to 479 -- only slightly behind where we were a year ago. But even if those year-to-date numbers are rosy, the most recent two months of slower sales do impact the longer-term trajectory... 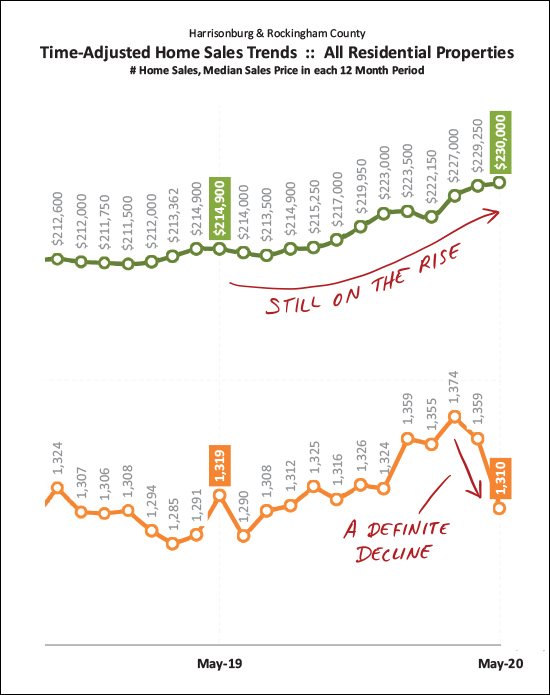 We can get excited about the top graph above -- in green -- as the median sales price is definitely still on the rise. The bottom graph (above, in orange) does show that the annual pace of buyer activity is starting to decline based on slower than normal sales in April and May. We may yet see this bounce back up depending on how June and July and August go, so stay tuned... And speaking of how future sales will go -- we ought to take a look at contract activity... 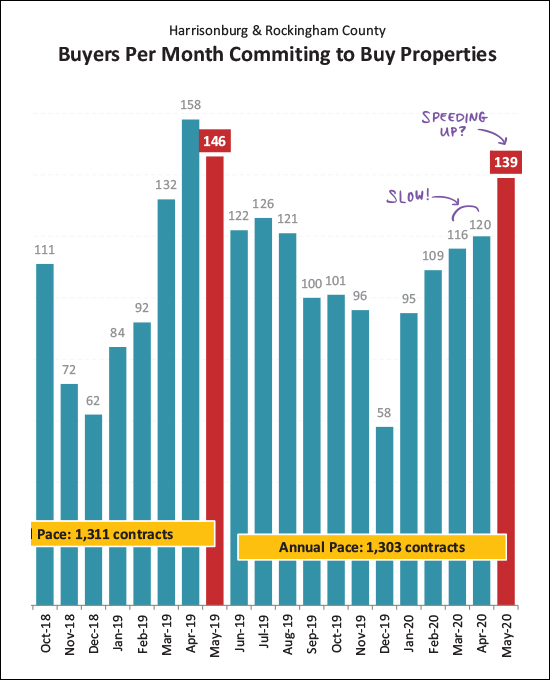 Contract activity is (clearly) a leading indicator for closed sales. Above you'll note that March and April of 2020 (116, 120) were much slower than last year (132,158) but we did see an increase in May contract activity. If we continue to see another increase in contract activity in June, then perhaps the surge of contracts being signed will just have been later in 2020 than in most other years. And if you're wondering why contract activity has been lower than usual, here is one reason for it... 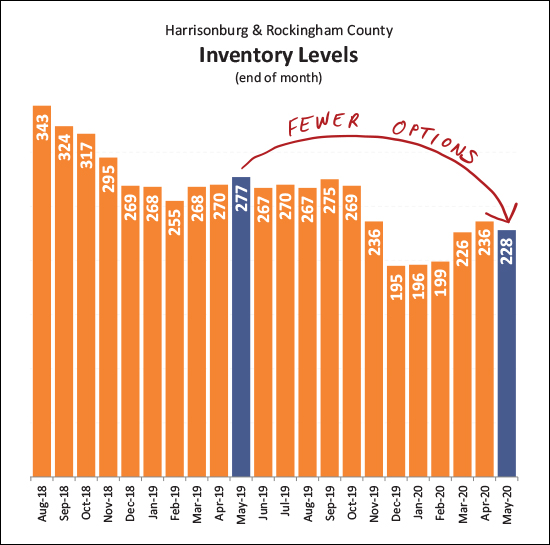 Inventory levels (the number of homes on the market for sale at any given point in time) continue to decline. As such, buyers are finding fewer (and fewer) options of homes to buy. This has been a steady trend (lower inventory levels) over the past few years and the fact that inventory levels are still dropping tells me that slower sales is a result of fewer sellers selling more than a result of fewer buyers buying. The speed at which homes sell also reinforces that conclusion... 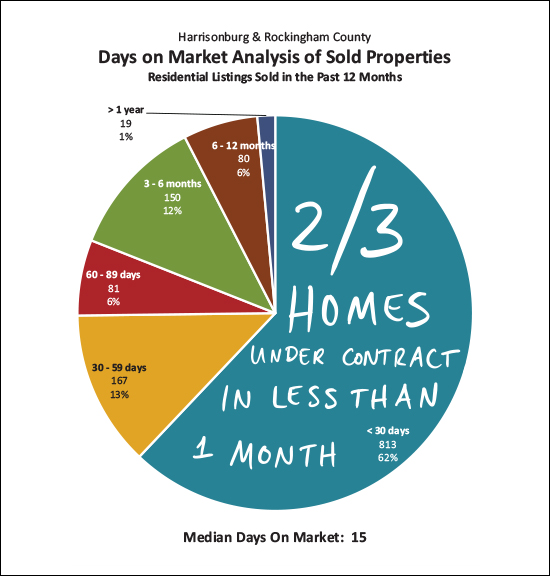 As shown above, two out of three homes are under contract within one month of hitting the market for sale. Beyond that, the median days on market for all homes that have sold in the past year -- was 15 days! So, there are fewer homes for sale at any given time, and homes are selling more quickly than ever -- indicating that buyers are still out there ready to buy -- we just need some sellers ready and willing to sell! And finally, some big picture economic indicators that are great and awful... 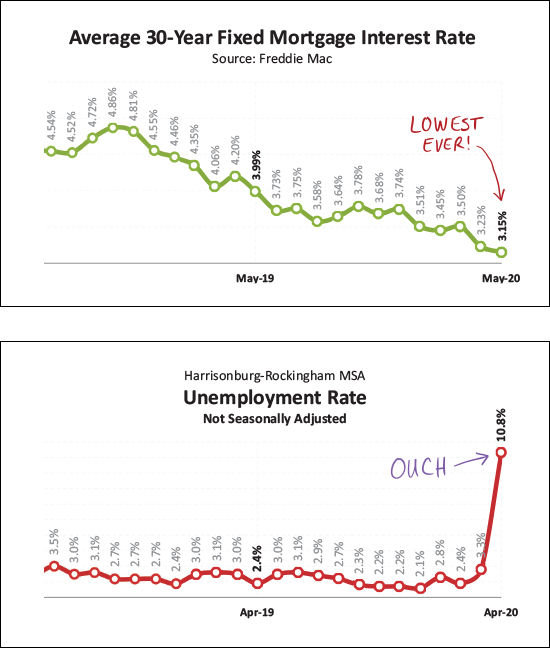 We are experiencing the lowest mortgage interest rates -- ever! Several of my buyer clients have locked in 30 year fixed mortgage interest rates below 3% (paying a point) but even without paying a point, the average rate at the end of May was only 3.15%! Yet at the same time, the unemployment rate (which had been trending lower and lower and lower) shot up from 2 point something up to 10.8% in April. This is likely at least somewhat temporary - and seems to affect folks renting homes more than those buying homes - but it is still not a great indicator of the health of our local economy. I'll be following this trajectory close over the next few months. OK - that brings your Monday morning snapshot of our local housing market to a close. And yes, I'll forgive you if you didn't get around to reading this until some other time than Monday morning. A few quick out takeaways...
If you're thinking about buying soon, or selling soon, let me know if you'd like to chat more specifically about your situation and goals. I'd be happy to help you with our potential purchase or sale. You can reach me most easily at scott@HarrisonburgHousingToday.com or by calling/texting me at 540-578-0102. Have a great week! Recent Articles:
| |
| Newer Post | home | Older Post |
Scott Rogers
Funkhouser Real
Estate Group
540-578-0102
scott@funkhousergroup.com
Licensed in the
Commonwealth of Virginia
Home Search
Housing Market Report
Harrisonburg Townhouses
Walk Through This Home
Investment Properties
Harrisonburg Foreclosures
Property Transfers
New Listings

