Archive for January 2021
Just Off The Mark. The Value Of Looking At Homes A Bit Beyond Your Typical Search Parameters |
|
 If you're looking for a four bedroom home, it might be worthwhile to look at a few homes with three bedrooms. If you plan to buy a home under $300K, it might be worthwhile to look at a few homes priced between $300K and $325K. If you prefer homes built in the past 20 years, it might be worthwhile to view some homes that are 21 - 30 years old. If you know you need 2400 SF, it might be worthwhile to walk through some homes that are 2200 - 2399 SF. If you only want to live 10 minutes from where you work, it might be worthwhile to look at a few homes that are 15 minutes from your job. Sometimes buyers draw firm lines around what will and won't work for them. This is fine, but there is definitely value in walking through some homes that are close to but not within those parameters. Here's why...
So -- loosen up your parameters a bit and look at some houses that are close to what you're looking for but not quite right on the money. | |
When Should I Start Looking For A Home To Buy If My Lease Ends This Summer? |
|
 If you have a lease ending this summer and you are thinking about buying a home instead of renewing that lease, you might think you have PLENTY of time before you need to start looking for a home to purchase. You might actually want to start looking for that new home sooner than you think. Let's imagine that your lease ends June 30th. Here's one potential timeline...
A few details worth mentioning...
Finally, one thing that is not noted above is how this might all play out related to your monthly housing payments...
As you can see, above, in this scenario (closing on home purchase on May 31, lease ends June 30) you would not have any months where you would need to both make a rent payment and a mortgage payment. So -- if your lease ends this summer, and you are looking to buy, you might want to get started on the buying side of things sooner rather than later! | |
Office Building, 77 Apartments and 93,600 SF of Storage Units Proposed Amidst Residential Developments, Church, Rescue Squad and Hospital in Rockingham County |
|
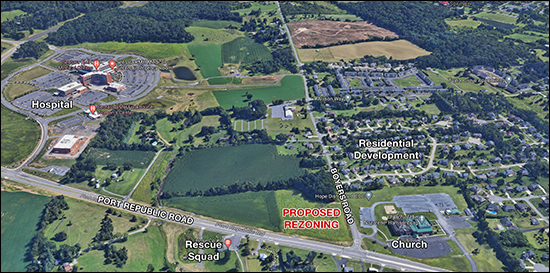 View a larger version of the map here. In what would seem to be a bit of a controversial proposed rezoning, Baum Investments LLC is proposing the rezoning of a 5.69 acre parcel at the corner of Port Republic Road and Boyers Road. The property is currently undeveloped, but Baum Investments would like to develop it to include...
As noted in the headline above, and on the map above, these proposed uses would be amidst residential developments, a church, the rescue squad and the hospital campus. You'll find the rezoning packet here. The County approved an Urban Development Area Plan (UDAP) for this area in late 2019 though it is not clear whether this rezoning request align with the County's vision for the area. The above referenced UDAP shows as example of mixed use and townhomes as a good potential fit for this property. Sometimes "mixed use" means a mix of commercial space and residential space -- but the UDAP document describes "mixed use" as developments that include "public amenities such as event and recreation space and fine dining." So, you tell me -- do the proposed uses (office building, apartments, storage units) fall within the scope of how the County thinks a parcel in this general location should be developed (townhomes, event space, recreation space, fine dining)? Am I reading the County's vision document too narrowly? Should we understand their vision document to mean that any sort of commercial use is fine within areas where they show potential mixed use? The Rockingham County Planning Commission meets on February 2nd to discuss this proposed rezoning. If you have comments about this proposed rezoning, you can contact... Updated 1/27/2021 per input from Bradford Dyjak, Director of Planning, Rockingham County - The UDA plan does offer examples of potential appropriate mixture of uses, and a broader definition of "mixed use" is also contained within the UDA Plan glossary, "Mixed of Uses - combines residential, commercial, civic, recreational and open space uses in a diversified but seamless arrangement; also combines first floor retail with second floor apartments and/or offices." Updated 1/29/2021 - Case #REZ20-333 has been postponed by request of the applicant and will not be heard February 2nd. It will be rescheduled and re-advertised at a later date. Full disclosure -- I live in one of the neighboring residential developments, about a half a mile from this proposed rezoning. | |
There Are Usually Two Phases Of Looking For A Home |
|
 OK - right now - it might really just feel like one phase, but humor me... There are typically (in most markets) two phases of looking for a home to purchase once you have decided that you are going to buy a new home. First -- we'll take a look at all of the homes currently on the market that might fit your ends. Second -- we'll wait for new listings to hit the market that might fit your needs. These days -- there are extremely low inventory levels in many price ranges and market segments, so the first part of the process (looking at current listings) is often a very brief exercise. Most of the homes of interest that have been listed in the past 90 days have already been snatched up with another buyer. As such, don't be surprised if it doesn't take long to go see the houses currently on the market that are a good potential match for you. We're then stuck in that second phase -- waiting. How exciting!? There will (likely) be new listings hitting the market in coming weeks or months that will be a potential match for what you're seeking in a new home, but we'll have to wait around for a homeowner to be ready to list their home for sale. When a local housing market experiences low levels of housing inventory, more of our "looking for a home" time is typically spent waiting rather than looking. What an exciting opportunity to practice patience! ;-) | |
January Housing Inventory Levels Sink To New Lows |
|
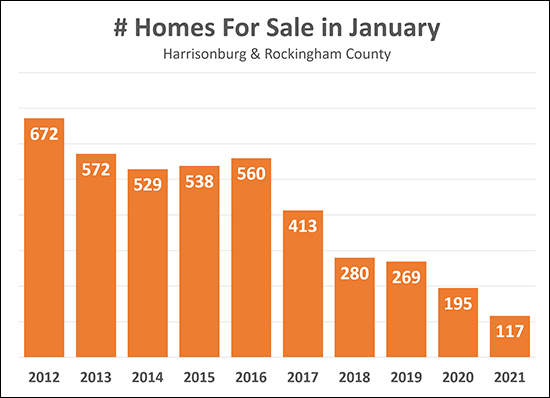 We like somethings to be low - like mortgage interest rates. But inventory levels - it really isn't ideal for them to be this low - except for sellers, I suppose. For each of the past five years, home buyers in our local market have found themselves worse off as far as having options for houses to buy in Harrisonburg and Rockingham County. Today, buyers are choosing from 117 homes for sale in the entire City and County. Ouch! Just a year ago, that was 195 homes, two years ago 269 homes, oh -- and can you imagine having 500+ homes to choose from such as back in 2016!? Here's hoping for a flurry of homes coming on the market in February and March to help meet the apparently never ending surge of buyer demand! | |
Will Buyer Activity Continue Full Strength In January? |
|
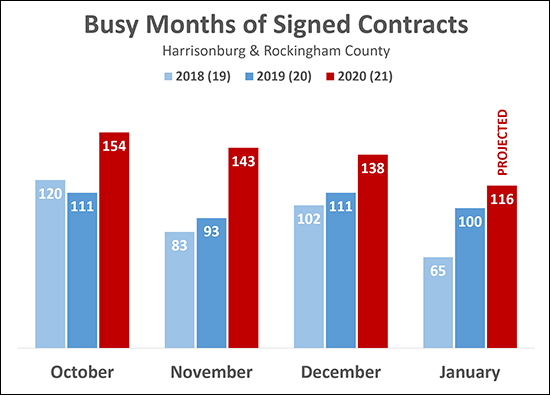 As shown above, the past three months (October, November and December) were absolutely bonkers as far as contract activity in Harrisonburg and Rockingham County. We saw far more contracts being signed than is typical for those months of the year. If we average the number of contracts seen in the fourth quarter of 2018 and 2019 we might have thought we would have seen 310 contracts signed in the fourth quarter of 2020. Instead, there were 435 contracts signed! So, how will things turn out in January? So far -- it seems buyer activity will continue to be strong in January 2021. There were 75 contracts signed between January 1 and January 20 which points to a projected total of 116 contracts potentially being signed during the full month of January, which would -- again -- surpass normal market activity for the month of January. Stay tuned to see how long this strong wave of buyer activity will continue... | |
Maybe Some Townhouse Developments Have Fewer Homeowners (Living In Those Townhouses) Than I Thought |
|
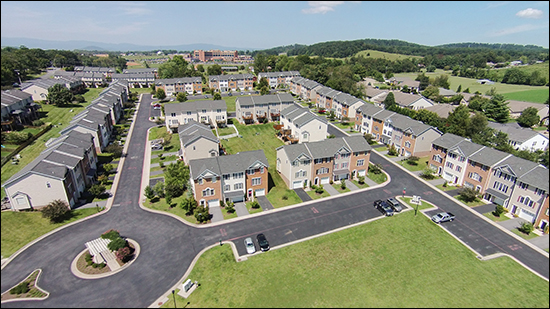 Before I look at any given set of real estate data, I usually have some sort of an idea in my head of what the data is likely going to indicate. I'm not always exactly right in my guess as to what I'll find when digging into the data - but I'm usually not overly surprised. A fellow agent asked me a few weeks ago about how many townhouses in Taylor Spring I thought were owner occupied vs. tenant occupied. I think I guessed that 80% or more were owner occupied. That was just my general feel for the neighborhood. It seems to mostly be homeowners. I was wrong. Pretty significantly wrong. I pulled the property records for all townhouses in Taylor Spring and then determined which were owner occupied based on whether the tax bills are sent to the actual property (likely owner occupied) or sent to a different address (likely not owner occupied) and this is what I found... Total Townhouses = 185 Owner Occupied = 94 Percent Owner Occupied = 51% So, it seems that about half of the townhouses in Taylor Spring are rentals. I was surprised, though mainly just because of my general assumption about what I was going to find. Are you surprised? | |
Juniper Hill Commons, A Multi-Generational Cohousing Community Is Under Development On Keezletown Road |
|
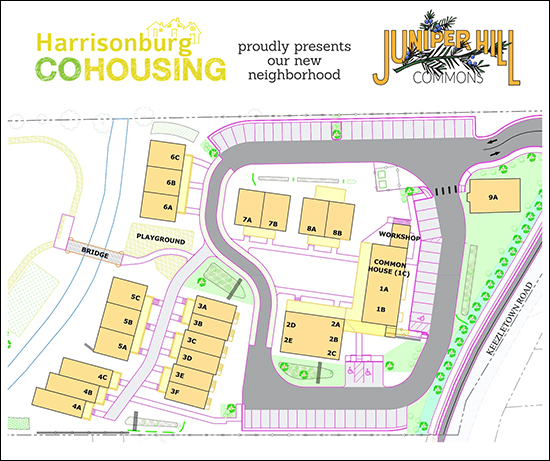 A new cohousing community is under development on Keezletown Road to feature (27) homes with 800 to 2400 SF. All homes are intended to include solar panels, spacious front porches and six inch thick walls. There are a variety of house plans intended to be built at Juniper Hill Commons such as this triplex... 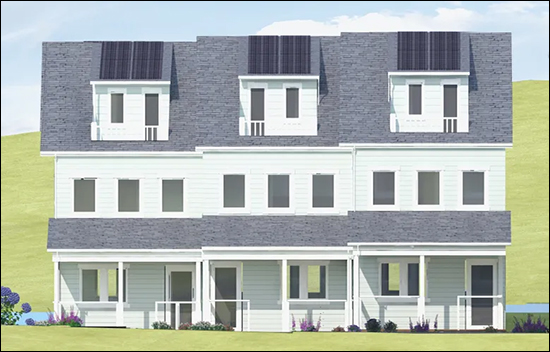 What, you might ask, is a Cohousing Community? Here's the vision for this neighborhood...
Learn (A LOT) more about this planned neighborhood by visiting their website where you can find a plat, house plans, neighbor bios and much more! | |
Most Homes Sold Quickly In 2020! |
|
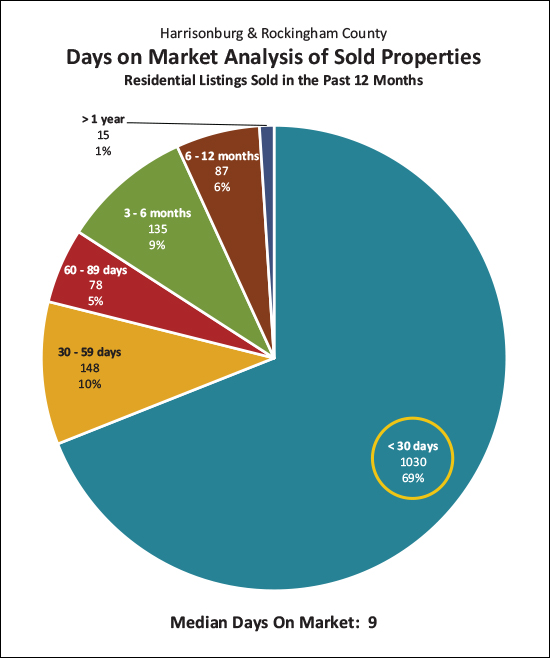 The graph above is an analysis of all of the homes that sold during 2020 in Harrisonburg and Rockingham County. You'll note that 69% of those homes sold (went under contract) within 30 days of being listed for sale! I expect that we will continue to see this dynamic in 2021. There are still plenty of buyers looking to buy homes, and very low inventory levels. As such, many homes are being scooped up by buyers within days (or weeks) of first hitting the market for sale. Home buyers in 2021 will need to be ready to act QUICKLY to secure a contract to purchase a home! | |
Not Much Negotiability In Home Prices In 2020 |
|
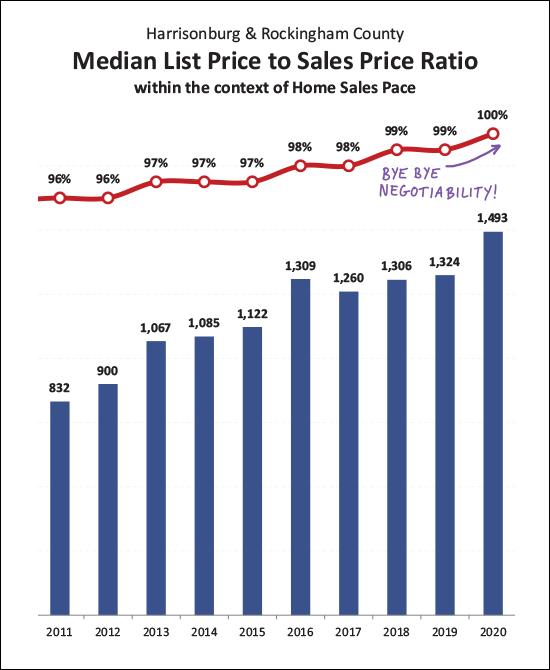 Looking back at a full year of data now for 2020, it is impressive to note that the median "list price to sales price ratio" was 100% for the year. This means that at least half of sellers sold at or above their list price! Home buyers likely aren't surprised by this revelation as they have experienced it first hand if they bought - or tried to buy - in 2020. New listings that are prepared well, priced well and marketed well are receiving multiple offers within days of hitting the market. Oftentimes, buyers are not discussing whether to make a full price offer - they are discussing how far above list price to go with their offer. Home sellers must still remember that this is not a blank check. Just because buyers are so eager to buy that they are often going above list price does not mean that you can list your home for any price you'd like. If your home is potentially worth $300K in the market right now, you ought not list it for $350K and then be surprised when you don't have a rush or showings and don't have any offers. You still need to price your home based on recent sales, though you might be able to round up a bit more than you had in the past when pricing your home. I expect this dynamic (most homes selling for the list price or higher) to continue as we move through 2021. | |
At Year End, Home Sales Up 13%, Prices Up 10% in 2020 in Harrisonburg, Rockingham County |
|
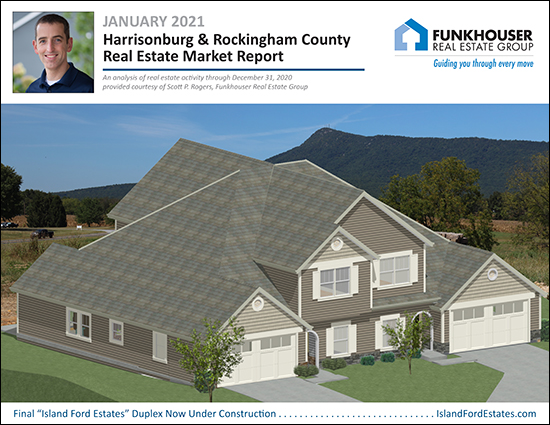 Happy New Year, friends! 2020 was a year like no other - in our local housing market - and in many (many!) other ways. I hope you and your family are doing well, staying healthy, and are full of hope looking forward to the year ahead! Below, I'll walk you through some of the overall trends we are seeing in our local housing market when reflecting back on a full year of 2020 home sales data. Before we get started, though, check out the featured home above here and feel free to download the full PDF of my market report here. Now, to the data... 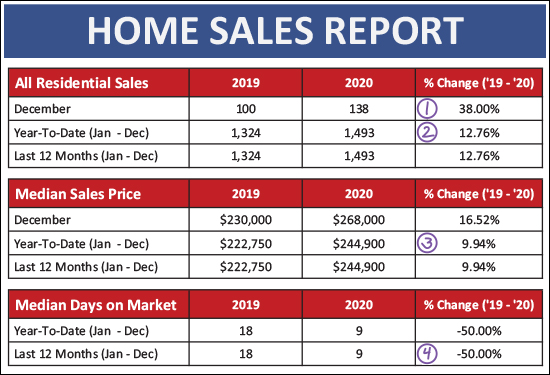 What a wild finish to the year! A few things to note when looking at this overall data...
Looking a bit further, let's break down the detached homes as compared to attached homes. Attached homes are duplexes, townhomes and condominiums. 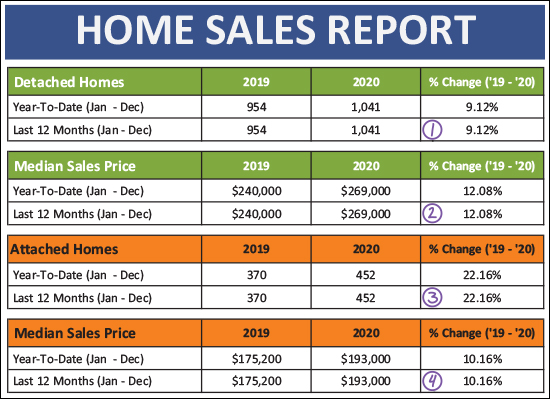 As you can see above...
It's hard to think of the best metaphor for the monthly pace of home sales in 2020. Perhaps someone running a race that tripped and fell and slowed down considerably a third of the way into the race, but who slowly picked up speed over the next third of the race and who absolutely SPRINTED through the final third of the race? 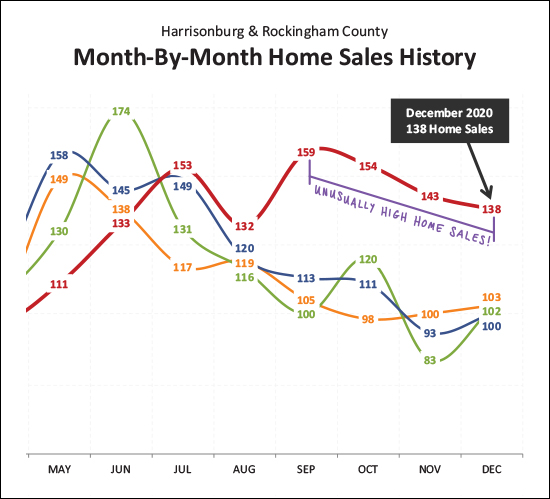 Take a look at September through December of 2020 above, marked with a red line. This is not normal / typical / expected. We expect to see an average of about 100 home sales per month for the last four months of the year. In 2020, it was an average of 149 home sales per month! This, clearly, makes me hesitant to guess about what we'll see in January and February. These winter months are typically the slowest months of the year for home sales -- but not in 2020. I expect we'll continue to see stronger than usual home sales for at least the first few months of 2021. And, looking at those sales on an annual basis... 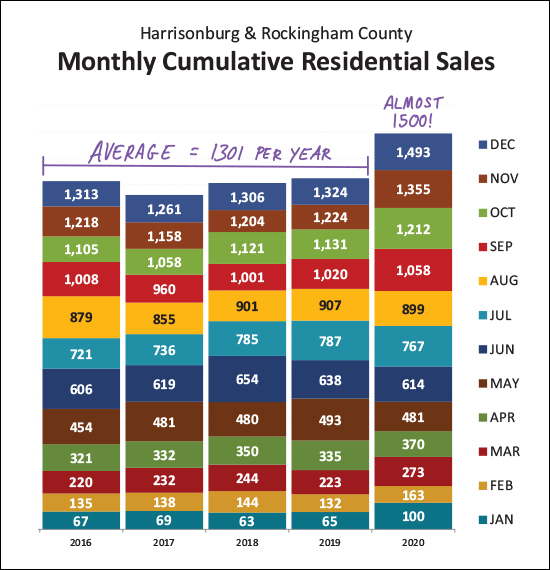 If you track along any particular color band in the graph above you can see where we were at that point of the year for each of the past five years. In August (yellow) of 2020 we were tracking right around where we would expect to be based on 2019 sales. But then those last four months of the year happened, catapulting us waaaaay ahead of where we have been for any recent year in Harrisonburg and Rockingham County! Here's an even crazier look at what has been happening for the past four months... 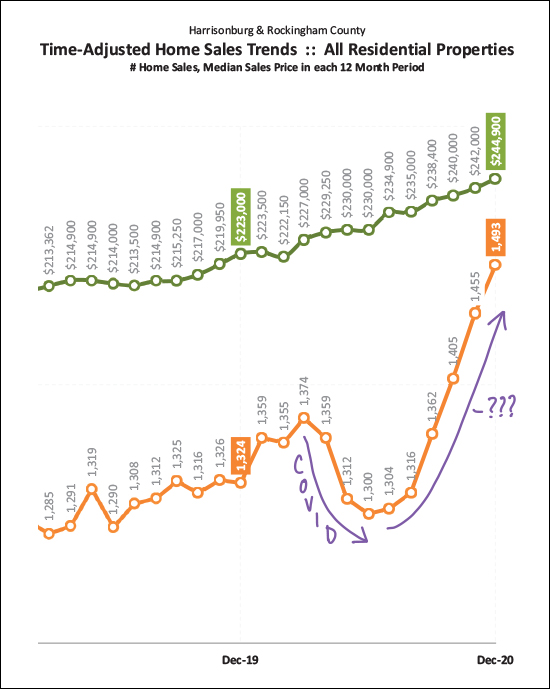 The more interesting (confusing!?) line above is the orange one. That is showing the number of home sales we're seeing per year in our area. That trajectory took a nose dive in early 2020 thanks to COVID but has been absolutely skyrocketing over the past four months. Why, why, why? Here are some guesses...
OK, I went on a bit more than I expected there, let's look one more time at the annual trends before we move on... 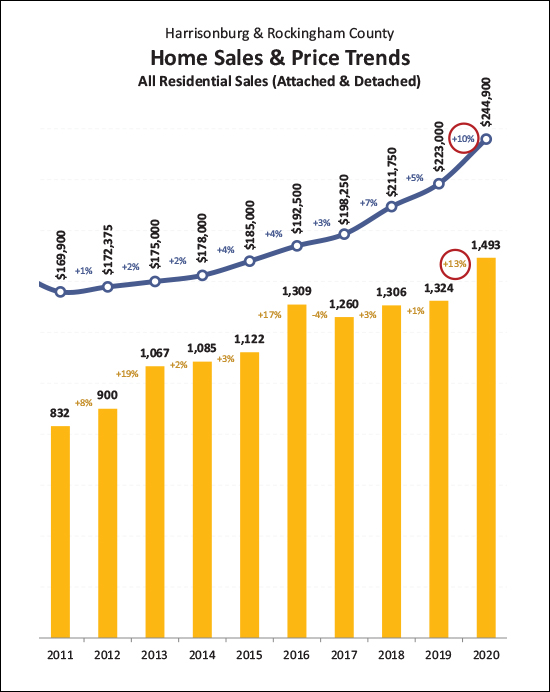 Two main things to note above...
Now, looking briefly at what is to come... 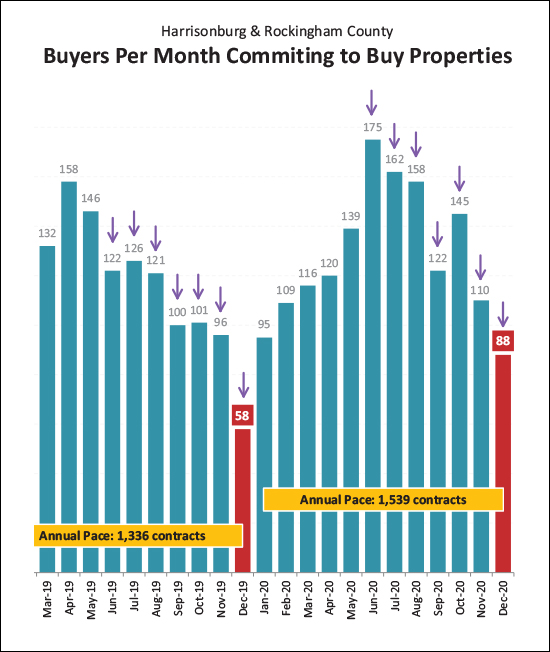 After I meticulously drew all of those purple arrows to point something out (see below) I realized it might seem like I was saying those numbers were decreasing. They're not. I didn't re-draw the arrows. You'll forgive me? OK - now to the point -- if you look at the seven purple arrows on the left you'll see that I'm pointing out the contracts signed between June and December of 2019 -- a total of 724 contracts. The seven purple arrows on the right are pointing out the contracts signed between June and December of 2020 -- a total of 960 contracts. So -- here's that evidence of a big increase in contract activity in the second half of the year. We saw that bear itself out in lots of closed sales between September and December, and I think that is going to keep on rolling into January and February. I expect we will see stronger than normal months of home sales for the first few months of 2021 if not longer. As I've alluded to a few times thus far, there is a lot of competition amongst buyers as each new listing hits the market. This abundance of buyers in the market, and scarcity of sellers, has caused continued downward shifts in inventory levels... 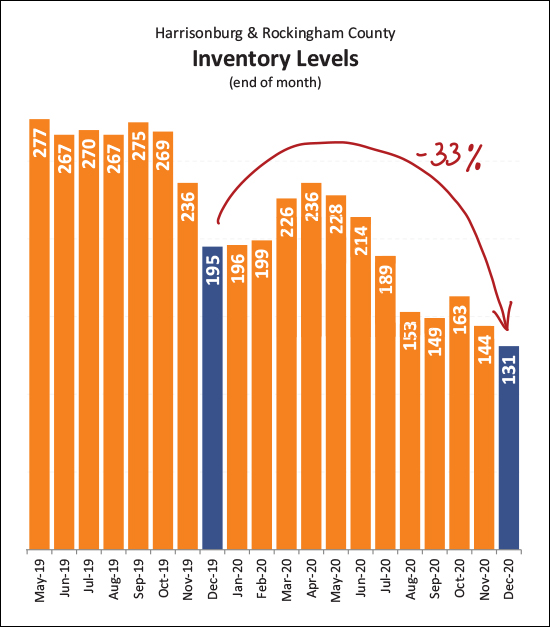 As you can see above, end-of-year inventory levels fell 33% over the past year. The important detail to note here is that these are just "moment in time" inventory levels. How many homes are on the market, actively listed for sale, on a particular day. Clearly, the 33% decline in inventory levels did not result in a decline in home sales in 2020. Perhaps it's actually the other way around -- the 13% increase in home sales in 2020 caused inventory levels to drop another 33% OK, one last graph to illustrate something I've referenced above... 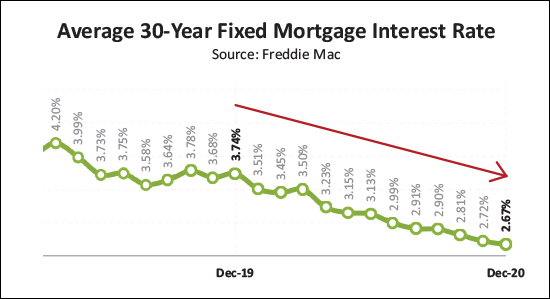 I told you mortgage interest rates had fallen - but look at how far they have fallen! Less than two years ago, the average 30 year mortgage interest rate was above 4%. Only a year ago it was 3.74%. Now, it's 2.67%. That marks a 29% decline in interest rates over the past year. This makes mortgage money cheap -- and monthly payments low -- and is part of what allowed median sales prices to rise 10% over the past year. Buyers were willing to pay higher prices for homes at least partly because their monthly costs keep declining. OK, I'll wrap it up there for now. Again, 2020 was a wild year and not at all what I expected it to be in March and April when things started slowing down. I did make a few predictions for 2021, but given how many surprises 2020 threw at us, it's certainly hard to imagine where exactly things might go in 2021. If you're thinking about buying a home in 2021, let's chat sooner rather than later if I can be of help to you in that process. You'll want to get pre-approved for a mortgage right away and then we'll want to start stalking the new listings as they hit the market. If you're thinking about selling your home in 2021, it is likely going to be a lot of fun to do so -- even if still a bit stressful. You will still need to prepare your house well, price it according to pertinent market data, and we'll need to market it thoroughly, but many sellers in most price ranges and locations are finding it to be a very favorable time to sell. If/when you're ready to connect to talk about buying or selling, feel free to email me (scott@hhtdy.com) or call/text me at 540-578-0102. Happy New Year! | |
Largest Inventory Declines In Lowest Price Ranges |
|
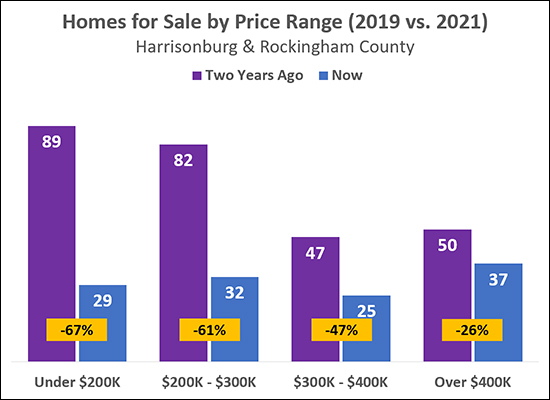 As will come as absolutely no surprise to anyone looking to buy a home under $200K, or even under $300K, there are far fewer options of houses on the market now as compared to two years ago. The graph above compares "beginning of the year" inventory levels today (blue bars) to two years ago (purple bars) to see how the market has shifted. As noted in gold, the lowest price ranges (under $200K, $200K - $300K) have seen over 60% declines in the number of homes on the market. It is a lot tougher to find a house to buy these days if you are hoping to buy for less than $200K, or even less than $300K. If you are planning to buy in that price range, get pre-approved, plan to see new listings the first day they come on the market, plan to make an offer immediately if it is of interest, and consider including an escalation clause to compete on price! | |
Local Home Prices Increase 32% In Five Years |
|
 The median sales price five years ago (2015) was $185,000 in Harrisonburg and Rockingham County. Last year, five years later, it was $244,900. That's a 32% increase in the median sales price over five years! A variety of thoughts come to mind...
That's all from me, for now. If this 32% increase in prices over five years seems shocking, or depressing, or awesome to you -- drop me a line (scott@hhtdy.com) and let me know what you're thinking or how you're feeling about these changes in home values in our area. | |
So, Will My House Sell For 10% More This Year Than Last? |
|
 It's a reasonable question. The median sales price increased from $223,000 to $244,900 between 2019 and 2020 -- which is a 10% increase. So, would your house sell for 10% more this year than last? Maybe. A good, solid, maybe. Whether your home would sell for 10% more than a year ago largely depends on its location and the buyer demand for homes like your home. If you live in a popular neighborhood where lots of buyers want to buy homes -- and few sellers are selling homes -- it is much more likely that your home would now sell for 10% more than it would have last year. In analyzing the market value of a property to prepare to list it for sale, we aren't going to look for comparable sales from 12 to 18 months ago and then add 10% to those sales prices. We will look for comparable sales from 6 to 12 months ago and then also examine current listings that are either actively for sale or are under contract. When prices are increasing quickly (10% over a year puts us in that zone) it is even more important to be precise and intentional with the pricing of your home. Pricing your home for sale won't always be a super straight forward decision but usually there are enough data points of recent sales and pending listings to give us enough guidance to make a good decision to maximize both the price for which you sell your home and the speed at which you sell your home. If you're getting ready to list your home this spring, it is definitely worthwhile to start looking at market value now. We can then continue to monitor listings and sales between now and when you list your home for sale to affirm our decision on pricing. | |
My Predictions for the 2021 Real Estate Market |
|
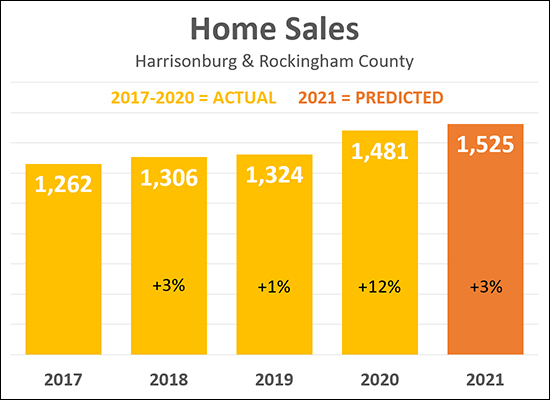 As I mentioned yesterday, my 2020 predictions for our local housing market were WAY off base. :-) I did not see such a strong market coming, and if I had known about COVID my predictions for 2020 would have been even more dire. But yet, despite COVID, 2020 was a robust year in our local housing market with 12% more sales and a 10% increase in the median sales price. So - knowing that my 2020 predictions were quite wrong - will I still take the time to make some predictions for the 2021 market? Sure! Why not!? :-) As shown above, I am anticipating a 3% increase in the number of homes selling in Harrisonburg and Rockingham County in 2021 as compared to 2020. Here's why...
So, given that I am anticipating an increase in home sales, albeit smaller than last year, what am I predicting on sales prices? 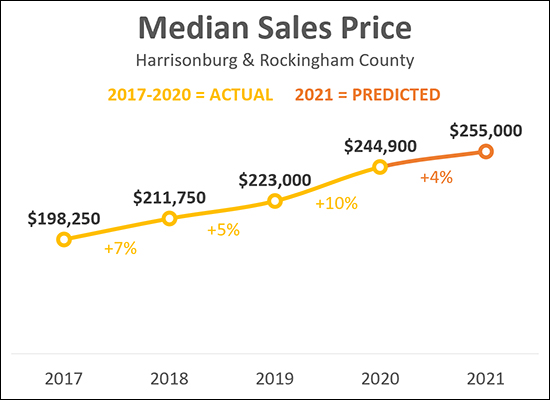 After as 7% increase in the median sales price in 2018 and a 5% increase in 2019, we saw a much higher, double digit, increase in 2020. The median sales price increased 10% from $233,000 up to $244,900. Again, I did not see this coming. I think this increase in the median sales price was largely the result of lots of buyers wanting to buy, low interest rates keeping mortgage payments affordable despite higher sales prices, and a limited inventory of homes for sale. So, where are we headed in 2021? I am predicting a 4% increase in the median sales price in 2021 in Harrisonburg and Rockingham County, which would get us up to $255,000. Here's why...
OK - enough about my predictions --what about for you? Email me (scott@HarrisonburgHousingToday.com) and let me know where you think our local market will go in 2021. And keep up with all the market data between now and next January by signing up to receive my monthly housing market report by email if you are not already receiving it. | |
Comparing My 2020 Housing Market Predictions To Reality |
|
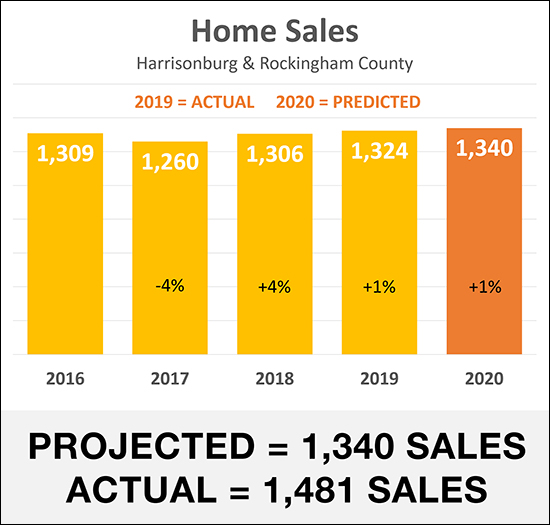 As shown above, I was terribly (!!!) inaccurate in predicting how many home sales would take place in Harrisonburg and Rockingham County in 2020. We saw a 1% increase in home sales between 2018 and 2019 and so I made the rather unexciting prediction that we'd see another 1% increase in 2020 to a total of 1,340 home sales. Wow, was I wrong! Home sales actually increased almost 12% to 1,481 home sales in 2020. This double digit increase in the pace of home sales is surprising because we were in the middle of a global pandemic for much of 2020 - but perhaps this is a part of why the increase happened. Here are some ways that the global pandemic (Covid) could have contributed to a significant increase in local home sales in 2020...
These (above) are some but certainly not all of the reasons why we saw an increase in home buying activity in 2020. In March and April of this past year as many aspects of our lives slowed to a stop, I certainly would not have predicted we see such a large increase in home sales locally -- but once we hit July, there seemed to be no stopping this quickly moving local housing market. So, given that I was wildly wrong on the number of home sales we would see in 2020, is it safe to assume I also erred on predicting the change in median sales price? Let's see... 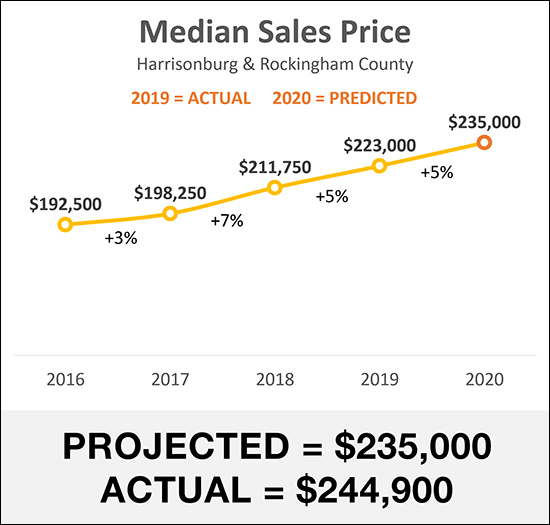 ...and, yes, I was also quite off the mark when it came to predicting the median sales price for 2020! After a 5% increase in the median sales price in 2019, I predicted that we would see another 5% increase to a median sales price of $235,000. When the year closed out, we actually saw a 10% increase in the median sales price -- from $223,000 in 2019 up to $244,900 in 2020. Wow! So, what could have caused this significant increase in the median sales price?
So -- given how inaccurate my 2020 predictions were you must, certainly, be looking forward to my predictions for 2021, right? :-) Stay tuned for my best guesses on what we'll see in our local market in the year ahead! | |
Home Sales Rise Around 12 Percent In 2020! |
|
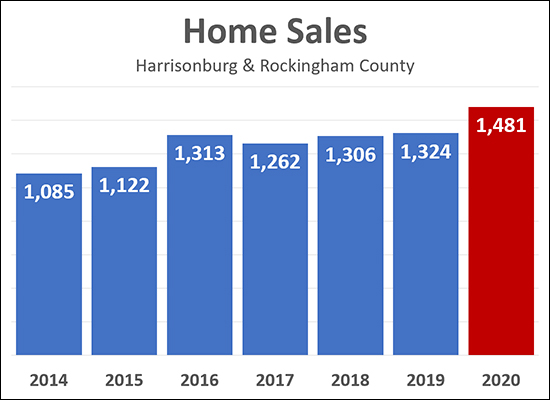 All home sales have not yet been reported but it is seems that we will see around a 12% increase in the pace of home sales in Harrisonburg and Rockingham County between 2019 and 2020! There have been 1,481 home sales recorded in the MLS thus far for last year and we may see that figure rise a bit more over the next few days, but not by much. This 12% increase is a SIGNIFICANTLY larger increase than we have seen in the last few years...
Stay tuned for my full market report in the next week or two, as well as predictions for the 2021 housing market. Oh, and HAPPY NEW YEAR! | |
Scott Rogers
Funkhouser Real
Estate Group
540-578-0102
scott@funkhousergroup.com
Licensed in the
Commonwealth of Virginia
Home Search
Housing Market Report
Harrisonburg Townhouses
Walk Through This Home
Investment Properties
Harrisonburg Foreclosures
Property Transfers
New Listings

