| Newer Post | home | Older Post |
At Year End, Home Sales Up 13%, Prices Up 10% in 2020 in Harrisonburg, Rockingham County |
|
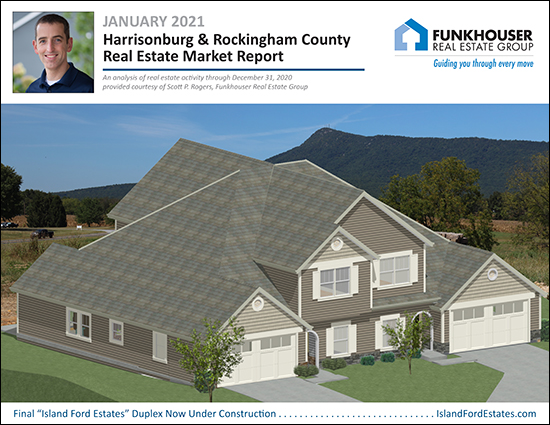 Happy New Year, friends! 2020 was a year like no other - in our local housing market - and in many (many!) other ways. I hope you and your family are doing well, staying healthy, and are full of hope looking forward to the year ahead! Below, I'll walk you through some of the overall trends we are seeing in our local housing market when reflecting back on a full year of 2020 home sales data. Before we get started, though, check out the featured home above here and feel free to download the full PDF of my market report here. Now, to the data... 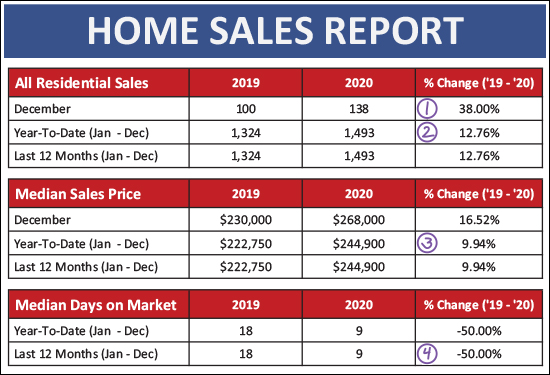 What a wild finish to the year! A few things to note when looking at this overall data...
Looking a bit further, let's break down the detached homes as compared to attached homes. Attached homes are duplexes, townhomes and condominiums. 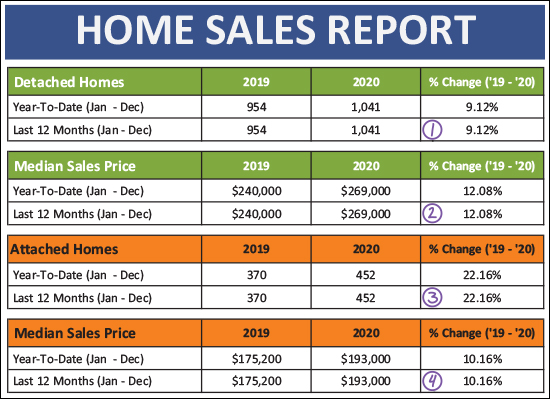 As you can see above...
It's hard to think of the best metaphor for the monthly pace of home sales in 2020. Perhaps someone running a race that tripped and fell and slowed down considerably a third of the way into the race, but who slowly picked up speed over the next third of the race and who absolutely SPRINTED through the final third of the race? 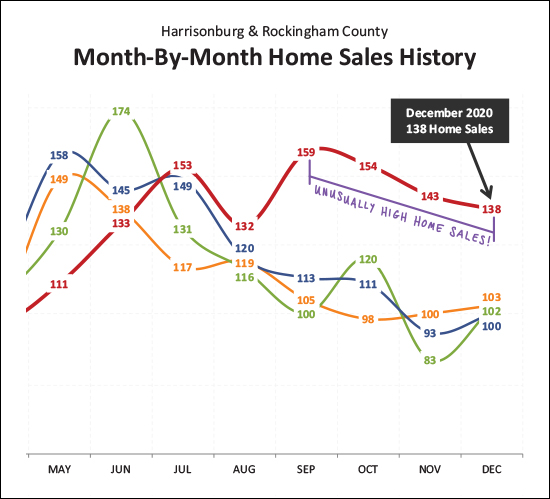 Take a look at September through December of 2020 above, marked with a red line. This is not normal / typical / expected. We expect to see an average of about 100 home sales per month for the last four months of the year. In 2020, it was an average of 149 home sales per month! This, clearly, makes me hesitant to guess about what we'll see in January and February. These winter months are typically the slowest months of the year for home sales -- but not in 2020. I expect we'll continue to see stronger than usual home sales for at least the first few months of 2021. And, looking at those sales on an annual basis... 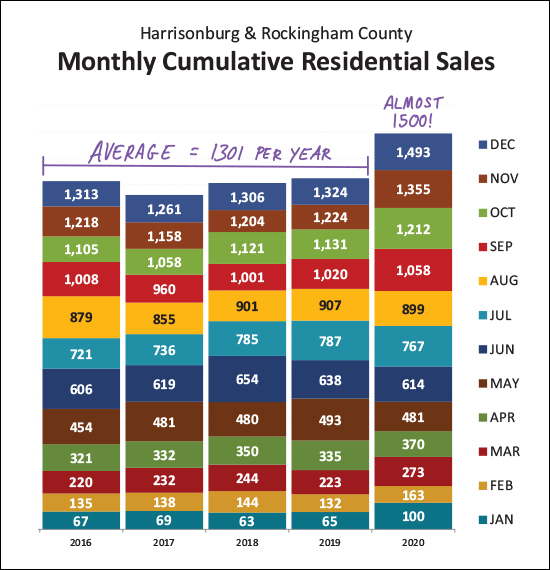 If you track along any particular color band in the graph above you can see where we were at that point of the year for each of the past five years. In August (yellow) of 2020 we were tracking right around where we would expect to be based on 2019 sales. But then those last four months of the year happened, catapulting us waaaaay ahead of where we have been for any recent year in Harrisonburg and Rockingham County! Here's an even crazier look at what has been happening for the past four months... 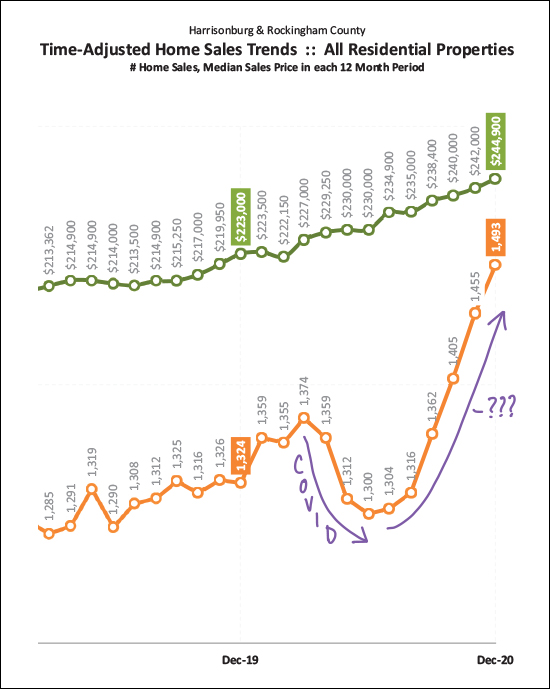 The more interesting (confusing!?) line above is the orange one. That is showing the number of home sales we're seeing per year in our area. That trajectory took a nose dive in early 2020 thanks to COVID but has been absolutely skyrocketing over the past four months. Why, why, why? Here are some guesses...
OK, I went on a bit more than I expected there, let's look one more time at the annual trends before we move on... 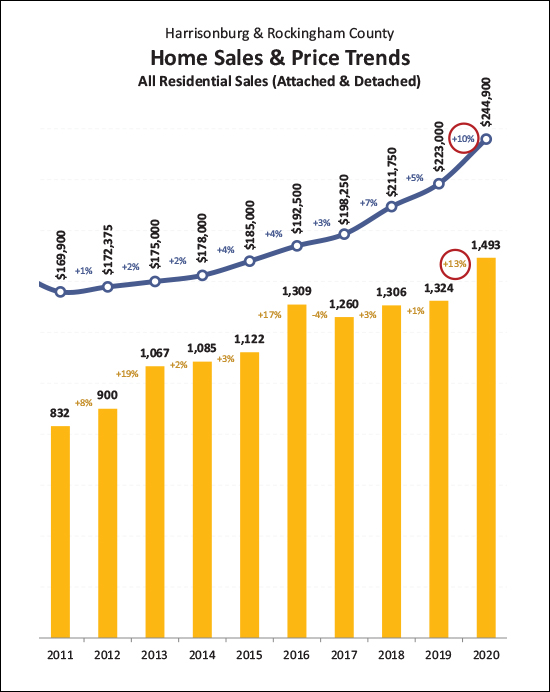 Two main things to note above...
Now, looking briefly at what is to come... 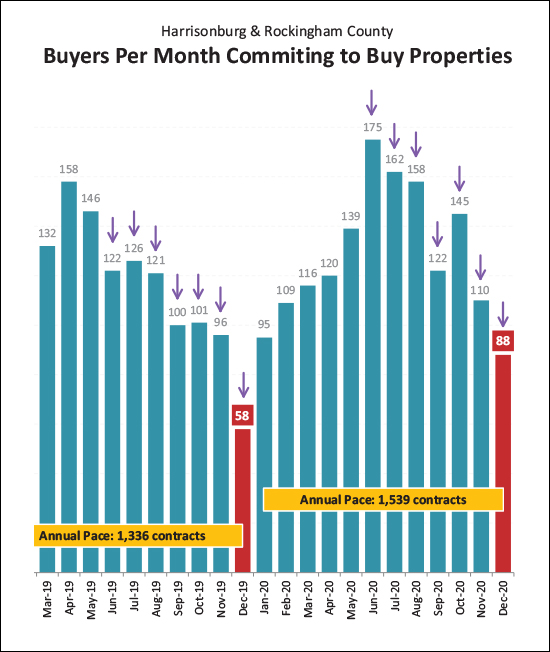 After I meticulously drew all of those purple arrows to point something out (see below) I realized it might seem like I was saying those numbers were decreasing. They're not. I didn't re-draw the arrows. You'll forgive me? OK - now to the point -- if you look at the seven purple arrows on the left you'll see that I'm pointing out the contracts signed between June and December of 2019 -- a total of 724 contracts. The seven purple arrows on the right are pointing out the contracts signed between June and December of 2020 -- a total of 960 contracts. So -- here's that evidence of a big increase in contract activity in the second half of the year. We saw that bear itself out in lots of closed sales between September and December, and I think that is going to keep on rolling into January and February. I expect we will see stronger than normal months of home sales for the first few months of 2021 if not longer. As I've alluded to a few times thus far, there is a lot of competition amongst buyers as each new listing hits the market. This abundance of buyers in the market, and scarcity of sellers, has caused continued downward shifts in inventory levels... 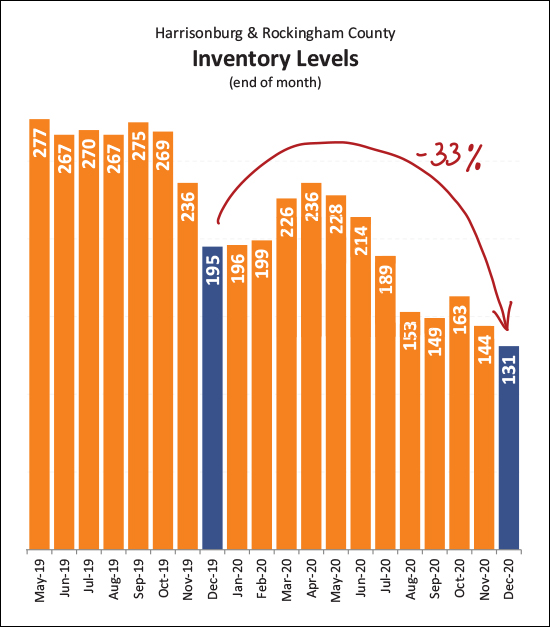 As you can see above, end-of-year inventory levels fell 33% over the past year. The important detail to note here is that these are just "moment in time" inventory levels. How many homes are on the market, actively listed for sale, on a particular day. Clearly, the 33% decline in inventory levels did not result in a decline in home sales in 2020. Perhaps it's actually the other way around -- the 13% increase in home sales in 2020 caused inventory levels to drop another 33% OK, one last graph to illustrate something I've referenced above... 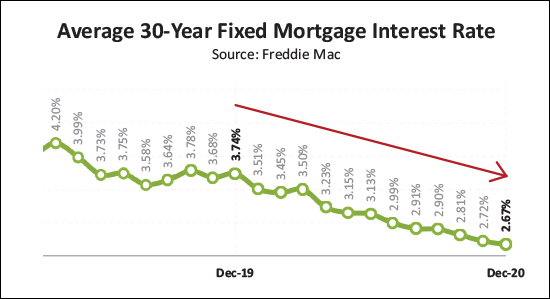 I told you mortgage interest rates had fallen - but look at how far they have fallen! Less than two years ago, the average 30 year mortgage interest rate was above 4%. Only a year ago it was 3.74%. Now, it's 2.67%. That marks a 29% decline in interest rates over the past year. This makes mortgage money cheap -- and monthly payments low -- and is part of what allowed median sales prices to rise 10% over the past year. Buyers were willing to pay higher prices for homes at least partly because their monthly costs keep declining. OK, I'll wrap it up there for now. Again, 2020 was a wild year and not at all what I expected it to be in March and April when things started slowing down. I did make a few predictions for 2021, but given how many surprises 2020 threw at us, it's certainly hard to imagine where exactly things might go in 2021. If you're thinking about buying a home in 2021, let's chat sooner rather than later if I can be of help to you in that process. You'll want to get pre-approved for a mortgage right away and then we'll want to start stalking the new listings as they hit the market. If you're thinking about selling your home in 2021, it is likely going to be a lot of fun to do so -- even if still a bit stressful. You will still need to prepare your house well, price it according to pertinent market data, and we'll need to market it thoroughly, but many sellers in most price ranges and locations are finding it to be a very favorable time to sell. If/when you're ready to connect to talk about buying or selling, feel free to email me (scott@hhtdy.com) or call/text me at 540-578-0102. Happy New Year! Recent Articles:
| |
| Newer Post | home | Older Post |
Scott Rogers
Funkhouser Real
Estate Group
540-578-0102
scott@funkhousergroup.com
Licensed in the
Commonwealth of Virginia
Home Search
Housing Market Report
Harrisonburg Townhouses
Walk Through This Home
Investment Properties
Harrisonburg Foreclosures
Property Transfers
New Listings

