| Newer Post | home | Older Post |
Special Saturday Edition: Home Sales, Prices Flying High In Harrisonburg Area |
|
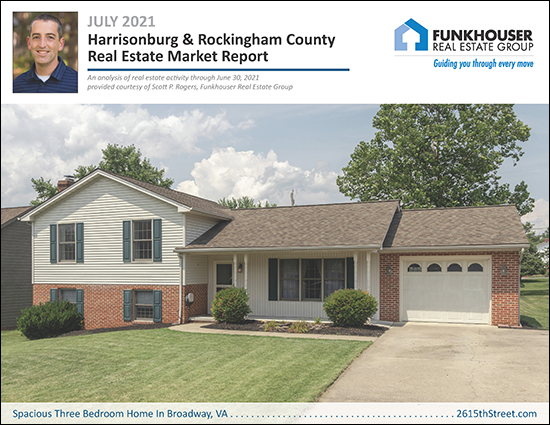 Happy Saturday morning to you! I hope you had a wonderful week. I am still unwinding a bit from a great time at the Red Wing Roots music festival last weekend. I enjoyed seeing many of you there, and if you missed it this year, you should consider attending next year! Back to the here and now, though -- I'm not sure what your weekend looks like -- but thus far mine has involved sipping coffee while my daughter and I have been drawing on our iPads. Admittedly, Emily is creating art, and I'm doodling on graphs and charts as included below - but fun times nonetheless. :-) Regardless of whether your weekend will include relaxing at home, traveling out of state to see family, heading to the beach for a week, or working in the yard -- I hope it is a weekend that includes at least some moments of fun and relaxation. When you get to a few free moments in your weekend, take a look through the remainder of this market update to learn more about what is happening in our quickly moving local real estate market. First, the full PDF of my market report can be found here, second, the featured home shown above is located at 261 5th Street in Broadway and you find details of it here, and now, let's dive in... 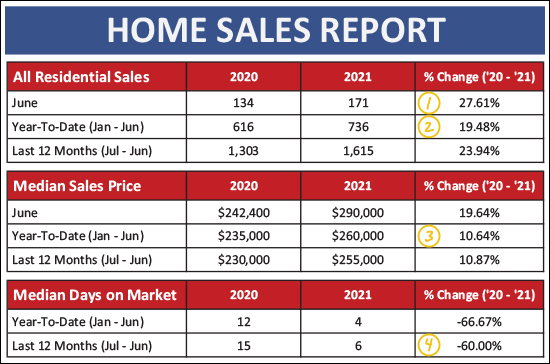 Quickly glancing through the numbers above, you might find your eyes opening wider than normal and your eyebrows rising higher than normal. There are some rather surprising things going on in our local housing market. Anyone who is selling their home, or trying to buy their home, knows about these dynamics -- but it's good to put some numbers to it... [1] There were 171 home sales in June 2021, which was 28% more than last June! [2] Thus far this year (we're halfway through it) there have been 736 home sales, which is 19% more than the first half of last year! [3] The median sales price in the first half of this year was $260,000 (!!) which is 11% higher the median sales price during the first half of last year which was only $235,000. [4] Over the past 12 months it has taken a median of six days for houses (that sold) to go under contract -- compared to a median of 15 days during the 12 months before that. So, yeah, lots of homes are selling, at much higher prices than a year ago, and much more quickly! Breaking it down between detached homes and attached (duplexes, townhouses, condos) homes reveals a few other details... 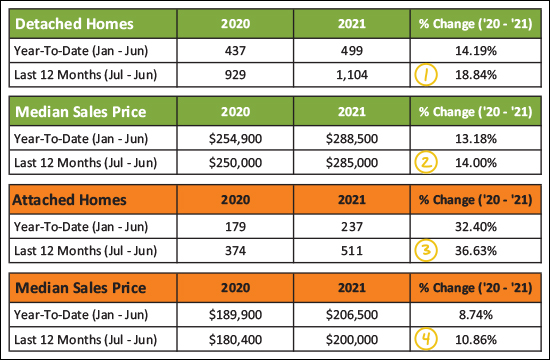 Above you might notice that... [1&3] There have been a 19% increase in the number of detached homes that have sold in Harrisonburg and Rockingham County over the past year -- but a much higher 37% increase in the number of attached homes that have sold! [2&4] The median sales price of detached homes ($285,000) has risen a bit more (14%) over the past year than the median sales price of attached homes ($200,000) which has only (haha) risen 11% over the past year. Those (above) are the long term trends. When we dial in a bit and look at things on a monthly we find that this strong increase in the number of home sales thus far in 2021 has been a month after month after month occurrence... 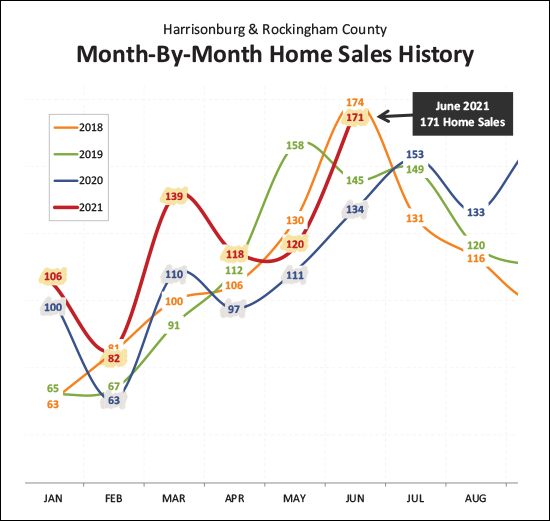 I have highlighted each of the first six months of 2021 in yellow above, and the corresponding month last year in gray. Now, it certainly bears noting that home sales during some of the months in the first half of last year were likely a bit lower than they would have been otherwise because of Covid, but regardless -- each month of home sales in 2021 has been head and shoulders above the corresponding month of 2020. And now, let's see how this first half of the year stacks up against the first half of the past few years... look for the dark blue bars... 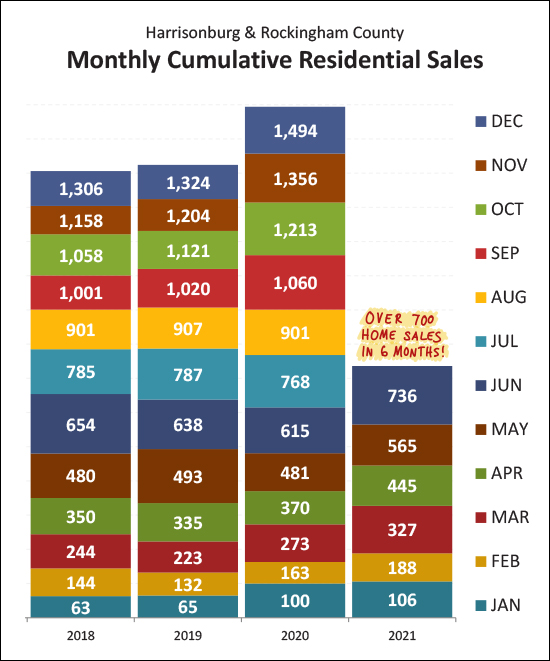 As you can see, with over 700 home sales (736) in the first half of 2021 this year is well ahead of the pace of home sales in the first half of each of the past three years. Looking ahead, it currently seems quite reasonable to think that we would see 1500+ home sales in 2021, with one significant exception. Home sales were tilted towards the second half of the year last year due to Covid, so while we are seeing stronger sales in the first half of 2021 (compared to 2020) things might level out a bit when we get to comparing the second half of 2021 to an abnormally strong second half of 2020. The next visualization is still shocking to me each time I update it with another month of data... 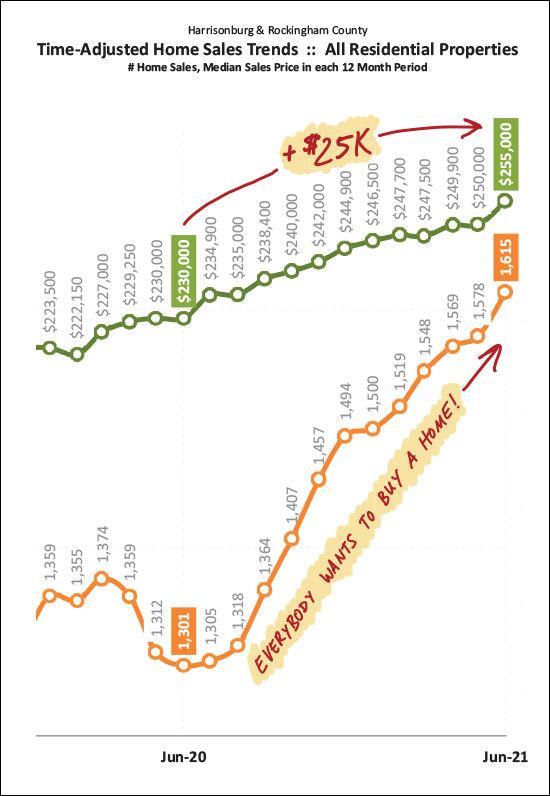 A year ago, 1300-ish buyers were buying homes a year -- now that has risen to 1600+ buyers per year!?! Indeed, it feels like EVERYBODY wants to buy a home... because, keep in mind, this 1600+ per year figure does not include all of the would-be buyers who made offers on houses in the past year but were not successful in securing a contract to buy a house!?! Imagine if there had been enough houses on the market for all of those buyers to have bought as well... The price change (orange line above) over the past year is also somewhat of an eyebrow raiser. The median price has risen $25,000 in the past year. Thus, if you own a home, the value of that property may have very well increased $25,000 over the past year! Admittedly, this varies based on property type, location, price range, etc., -- but suffice it to say -- home values have increased quite a bit in the past year!! Now, just to keep you levelheaded this morning, the next two graphs might make you (and me) say "hmmm..." and "well, let's see what comes next"... 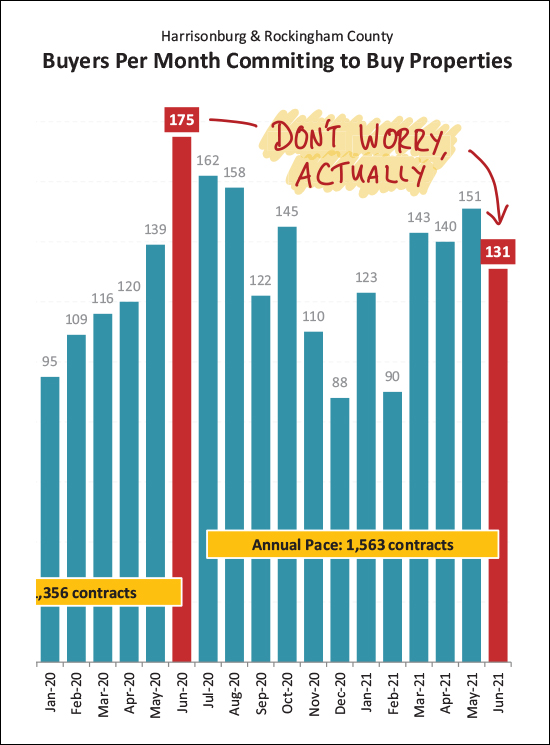 Above, it would appear that the pace of buyers signing contracts has dropped off considerably in June 2021!?!?! ;-) But don't worry too much -- I don't think!? The pace of contract signing in any typical March / April / May is usually quite (!!) active. Last year, buyer activity was significantly suppressed during those normally active months because of Covid -- we didn't know what was happening, what was going to happen, whether the housing market was going to slow down, etc. Then, buyer activity exploded in June of last year and remained quite strong throughout most of the remainder of the year. So, as you look at the decline in June 2021 as compared to June 2020, keep in mind that it was a very unusual June 2020. So, wait and see -- but I don't think June contract numbers mean that our local housing market is slowing down. And now, the second graph to make you say hmmm..... 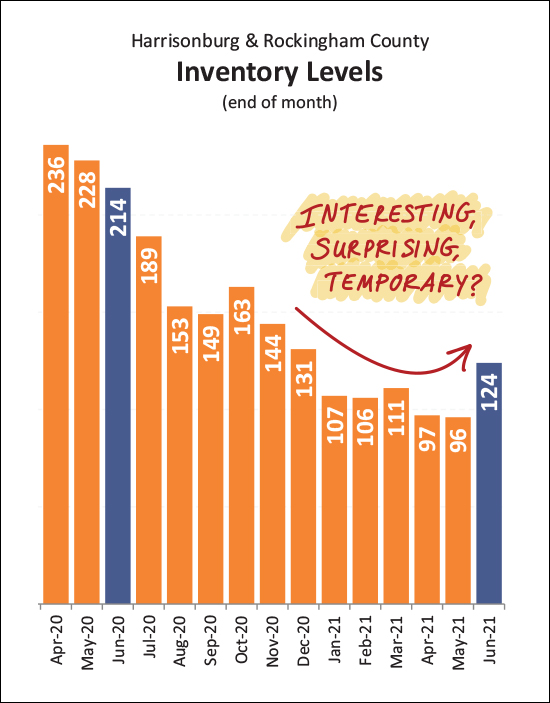 Inventory levels have risen over the past month -- to the highest level in almost six months! This is somewhat interesting and surprising -- but I do also wonder whether it is temporary. I should also point out that this increase in inventory levels only takes us from super-super-super-super low inventory levels up to super-super-super low inventory levels. In the end, most buyers in most price ranges will still find very few choices of homes on the market at any given time. So, I think this is a wait and see -- as to whether we'll start seeing inventory levels rising again, or if this is a one month blip. Lastly, just to remind everyone of at least one of the reasons why so many buyers would LOVE to buy a house right now -- mortgage interest rates are phenomenally low right now... 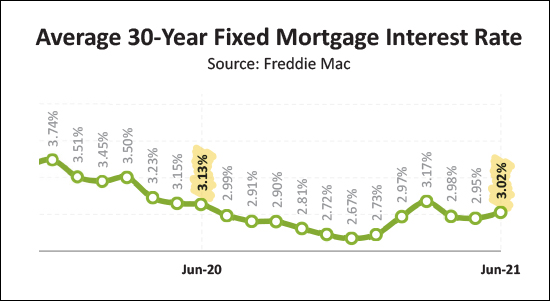 Interest rates have been up and down over the past year, falling as low as 2.67% and rising as high as 3.17%. Clearly, though, anything under 4% still has to be described as absurdly low from any sort of a long term perspective. The cost of financing your home purchase will be very, very low if you are fortunate enough to secure a contract to buy a home in 2021. OK, that's all of the charts and graphs I have for you this morning. A few short takeaways from a big picture perspective... BUYERS: Get prequalified now, see new listings quickly, and carefully consider each contract term of your offer to make it as strong as possible. SELLERS: Prepare your home well, price it reasonably, enjoy a short period of time when you have to put up with showings, and enjoy likely being able to select from multiple offers with favorable terms. HOMEOWNERS: Enjoy knowing that your home value is increasing. :-) If you have questions about buying, or selling, or just want to tell me about the exciting plans you have for the weekend ahead -- drop me a line via email or call/text me at 540-578-0102. Otherwise, enjoy the weekend! Recent Articles:
| |
| Newer Post | home | Older Post |
Scott Rogers
Funkhouser Real
Estate Group
540-578-0102
scott@funkhousergroup.com
Licensed in the
Commonwealth of Virginia
Home Search
Housing Market Report
Harrisonburg Townhouses
Walk Through This Home
Investment Properties
Harrisonburg Foreclosures
Property Transfers
New Listings

