| Newer Post | home | Older Post |
More Homes Are Selling, Faster, At Ever Higher Prices |
|
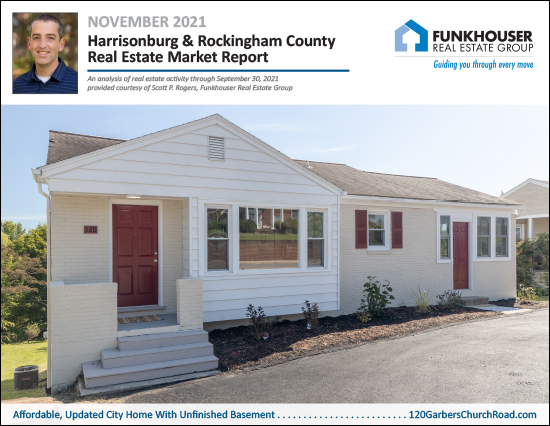 Happy, Chilly November morning, Friends! This month's market report is brought to you by... turkey, stuffing, cranberry sauce, sweet potato casserole, carrot souffle, corn casserole, mashed potatoes and gravy...  Thanksgiving is my favorite meal of the year because of all of the delicious foods offered all at once. This year, my family humored me... and spoiled me... by making me a full Thanksgiving meal for my birthday at the end of October! :-) So, for everyone who hasn't had a full Thanksgiving meal for 11.5 months now, I can tell you from personal, recent, experience, you're in for a treat... nine days and counting! ;-) Speaking of Thanksgiving, there is much in my life for which I am immensely grateful -- my family, friends, health, a job I enjoy, my clients, and much more -- and I hope you are finding much in your life for which you are also thankful this year. I also hope you are able to spend some time this Thanksgiving with family and friends and enjoy a bit of downtime amidst what has been a hectic and stressful year for many. But, enough talking turkey, back to the main course -- the local housing market. ;-) The photo on the cover of my market report is a lovely, updated house on Garbers Church Road, which you can check out here, and you can download a PDF of all of the charts and graphs from my market report here. Now, let's start stuffing our faces with some of the latest stats... 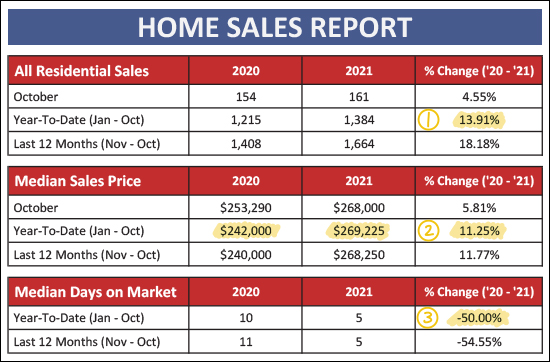 OK, quite a few highlighted items here... [1] We have seen 1,384 home sales thus far in 2021 which is almost 14% more than we saw last year during the same timeframe. The market continues to be red hot with lots of homes selling -- more than any recent year! [2] The median sales price has risen 11.25% in the past year. One year ago, the median sales price (for 2020) was $242,000. Now, that median sales price is $269,225. That is an increase of more than $25,000 in a single year! [3] The time it takes for homes to sell has been cut in half in the past year. A year ago the median days on market was 10 days, and this year it is only five days. That is to say that half of homes are going under contract in five or fewer days! Let's break it down, now, between detached homes and attached homes. Attached homes are duplexes, townhomes and condos... 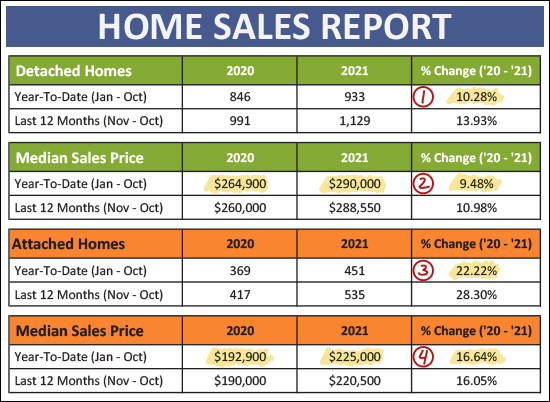 The green charts, above, are detached homes and the orange charts are attached homes, and here's what I'm noticing... [1] We have seen 10% more detached home sales this year -- an increase from 846 sales up to 933 sales. [2] The median sales price of these detached homes has risen 9.5%, from $264,900 up to $290,000. We are now pretty close to a $300,000 median sales price for detached homes in our area. Wow! [3] We have seen even more of an increase in the pace of sales of attached homes, with a 22% increase in those sales from 369 sales last year to 451 sales this year. [4] The median sales price of attached homes has risen even more than detached homes, with a 17% increase from $192,900 up to $225,000. So, many more sales this year than last, and higher prices! It's been a busy year for buyers and sellers in the local housing market. Breaking it down month by month, here's what we're finding... 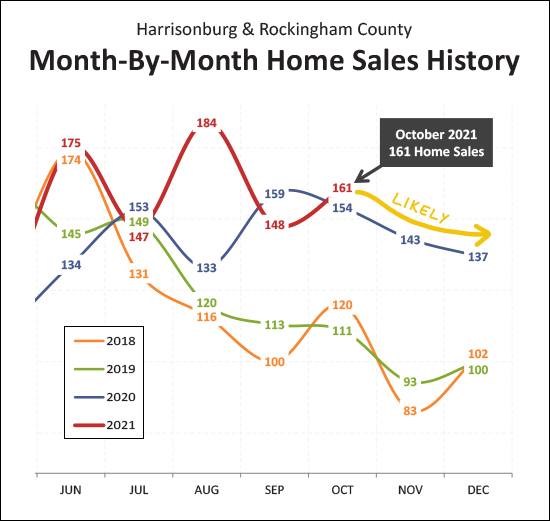 It's been a bit of a roller coaster ride in the second half of this year... JUN: highest month of sales in many years JUL: slower sales than last year AUG: highest month of sales, by far, in many years SEP: slower sales than last year But, the market is back in full force in October, with the... highest month of sales in many years. :-) We are likely to see a slow decline in monthly home sales in November and December as is typical most years -- but then again, maybe I'll be surprised yet again! If we do stay on track with a relatively solid November and December, here's what that might look like... 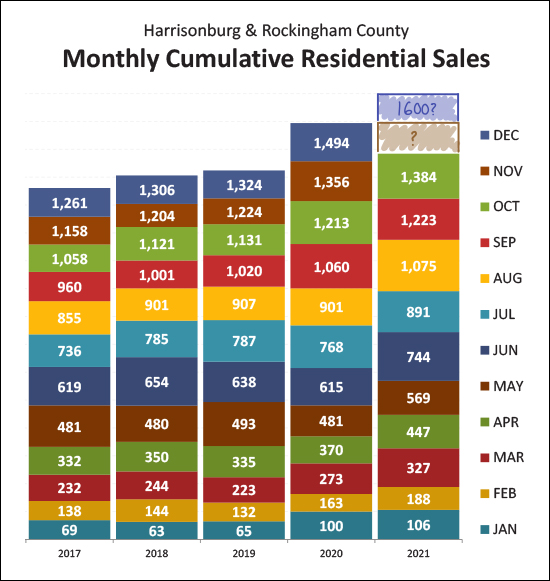 As you can see, with only ten months of sales thus far in 2021 we have already eclipsed the total number of sales in 2017, 2018 and 2019. We may very well rise above 2020 just with the addition of November sales, and when 2021 is completely in the books, perhaps we'll get all the way up to 1,600 home sales! Here's an another visualization of how we made our way to this pace of home sales... 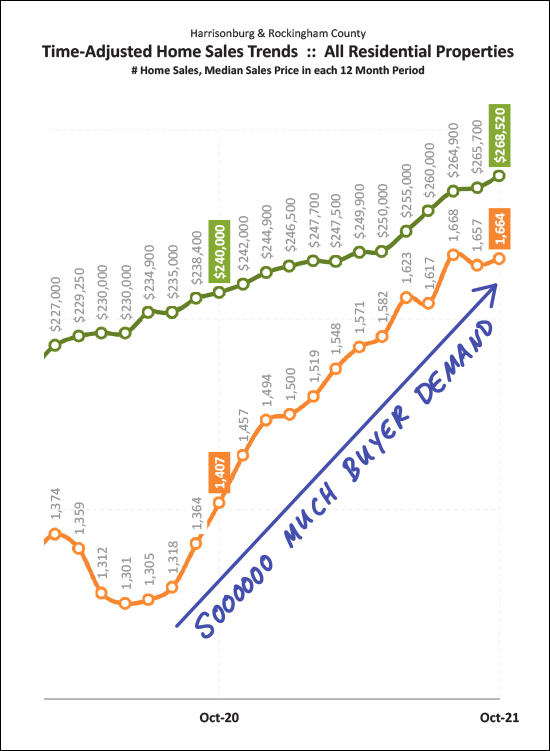 Yeah, that orange line. The orange line is showing the annual pace of home sales in Harrisonburg and Rockingham County. The annual pace of sales slowed in mid 2020 due to Covid -- that's the multi month dip on the left side of the graph. But when Fall 2020 came into view, the pace of buying activity took off like a rocket and has not slowed down much since. The annualized pace of home sales has actually been over 1,600 for five months in a row now, which is a relatively good indicator that we'll see a total of 1,600 home sales in 2021. Will the pace of home buying activity slow in 2022? I don't think that it will. I believe there is a good bit of unmet buyer demand that has built up in our local market over the past five years. I think there are plenty of would be home buyers that are just waiting on resale homes, or newly constructed homes, to be available so that they can buy a home. Assuming we continue to see growth in new construction options, and assuming mortgage interest rates don't rise dramatically, I think we are likely to continue to see an annualized pace of 1,600+ home sales as we work our way into and through 2022. And what about home prices... 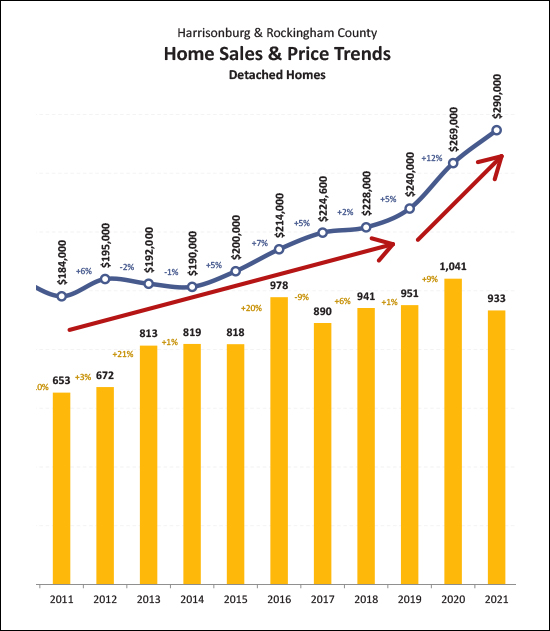 Between 2011 and 2019 the average increase in the median sales price of detached homes was 3.4% per year. Over the past two years (2020, 2021) the average annual increase in the median sales price of detached homes was... 10%. So, clearly, home values are increasing much faster now than they were for most of the past decade. Looking ahead, what will we see next. I believe we will soon (2022) or eventually (2023) see that annual increase return to that longer term norm of three to four percent. I am not thinking, at this point, that we will see sales prices drop -- but I don't think we will continue to see those prices increase as fast as they have for the past two years. Looking ahead at what closed sales might be in the next two months requires looking backwards at what we've seen in the way of contract activity over the past few months... 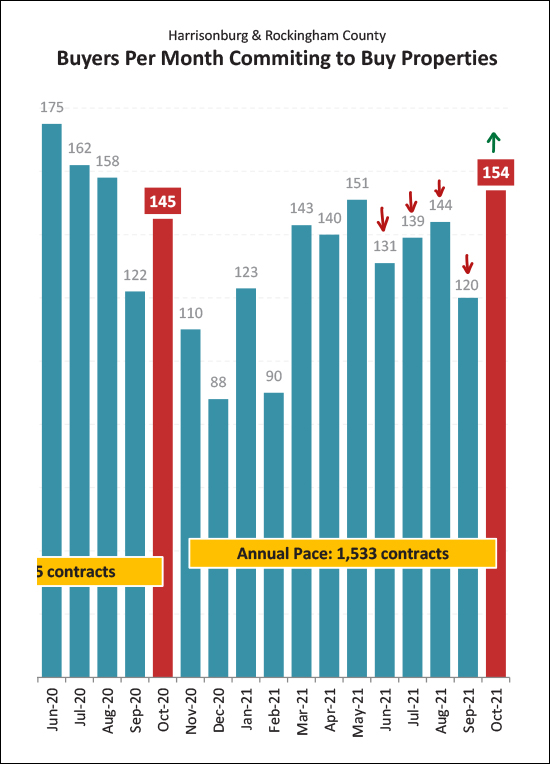 As noted by the red and green arrows above the last five months above... [1] In June, July, August and September of 2021 we saw fewer contracts being signed than in the same month in 2022. [2] In October 2021 we saw more contracts being signed than in October 2021. [3] In the total of those five months there were 762 contracts in 2020 and only 688 contracts in 2021. So, contract activity might be (?) slowing a bit, which means home sales activity might (?) slow a bit as we finish out 2021 and roll into 2022. Stay tuned as I continue to track this over time. Here's a bit of a confusing graph, at first glance... 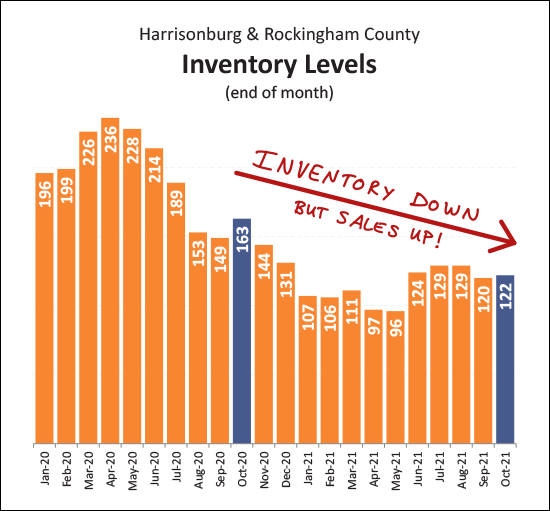 This graph, above, shows the number of homes on the market at any given time, measured monthly. Inventory levels have been dropping for many years now -- but home sales have been increasing during that same timeframe. Confusing, right? Here's the skinny... [1] More homes have been listed over the past year than the previous year. [2] Homes have sold much more quickly this year than last. [3] As a result, the number of homes on the market at any given time has dropped over the past year. Maybe that's clear, maybe not. As with all of this data and these graphs, just ask if you have a question! As per #2 above, homes are selling rather quickly... 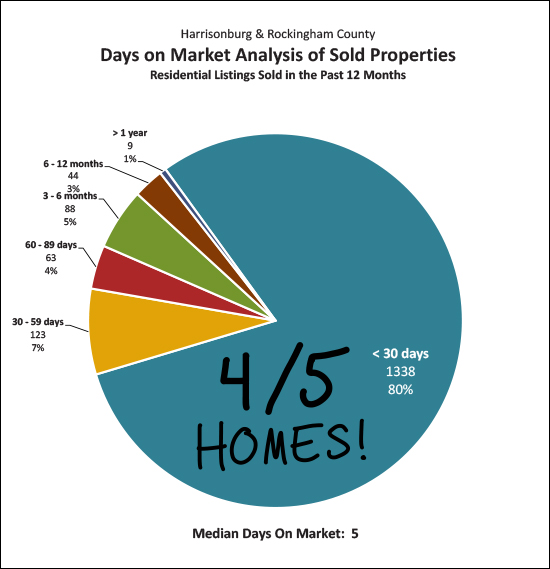 A few things we can pick up from the graph above... [1] As scribbled on the chart, four out of five homes are going under contract within 30 days. [2] Narrowing the focus a bit, we can note at the bottom that per the median of five days, at least half of the homes that have sold in the past year have been under contract within five days of being listed for sale. Here's an even more interesting visualization of how quickly homes are going under contract in Harrisonburg and Rockingham County these days... 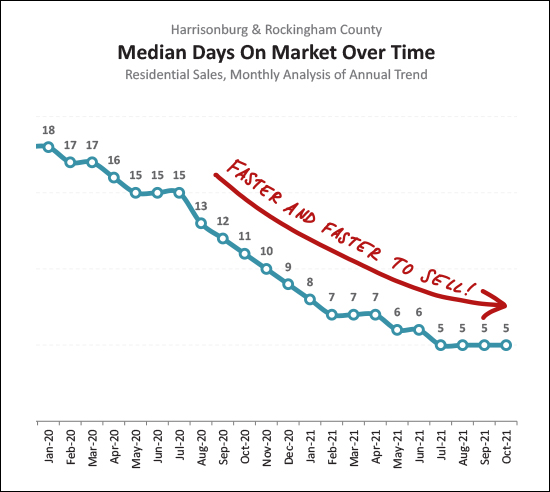 This graph takes a look at the median days on market of all residential sales in Harrisonburg and Rockingham County in a year's time. This shows the speed of home sales in our marketplace and that speed has been steadily increasing over the past 18+ months. Alright, that brings my monthly overview of our local real estate market to a close for now. As noted throughout... more homes are selling, more quickly, at ever higher prices. It is not clear when these trends will slow down, stop or reverse themselves, but for now, the local market keeps on moving steadily ahead. If you made it through reading the entire overview of my market report, kudos to you, and you can consider yourself to be well informed on the latest local market trends. You are now dismissed from class to go daydream about your favorite foods you will devour on Thanksgiving day. As we continue through November, I hope your Thanksgiving season is one full of plenty of relaxation, delicious food, and enjoyable time with family and friends. Looking ahead, if you hope to buy a home or sell a home yet this year, or in early 2022, let's chat sooner rather than later to prepare you for entering into this fast pace local housing market. You can reach me via phone/text at 540-578-0102 or by email here. Happy Thanksgiving! :-) Recent Articles:
| |
| Newer Post | home | Older Post |
Scott Rogers
Funkhouser Real
Estate Group
540-578-0102
scott@funkhousergroup.com
Licensed in the
Commonwealth of Virginia
Home Search
Housing Market Report
Harrisonburg Townhouses
Walk Through This Home
Investment Properties
Harrisonburg Foreclosures
Property Transfers
New Listings

