| Newer Post | home | Older Post |
Another Visual Of A Slightly Slowing Pace Of Home Sales |
|
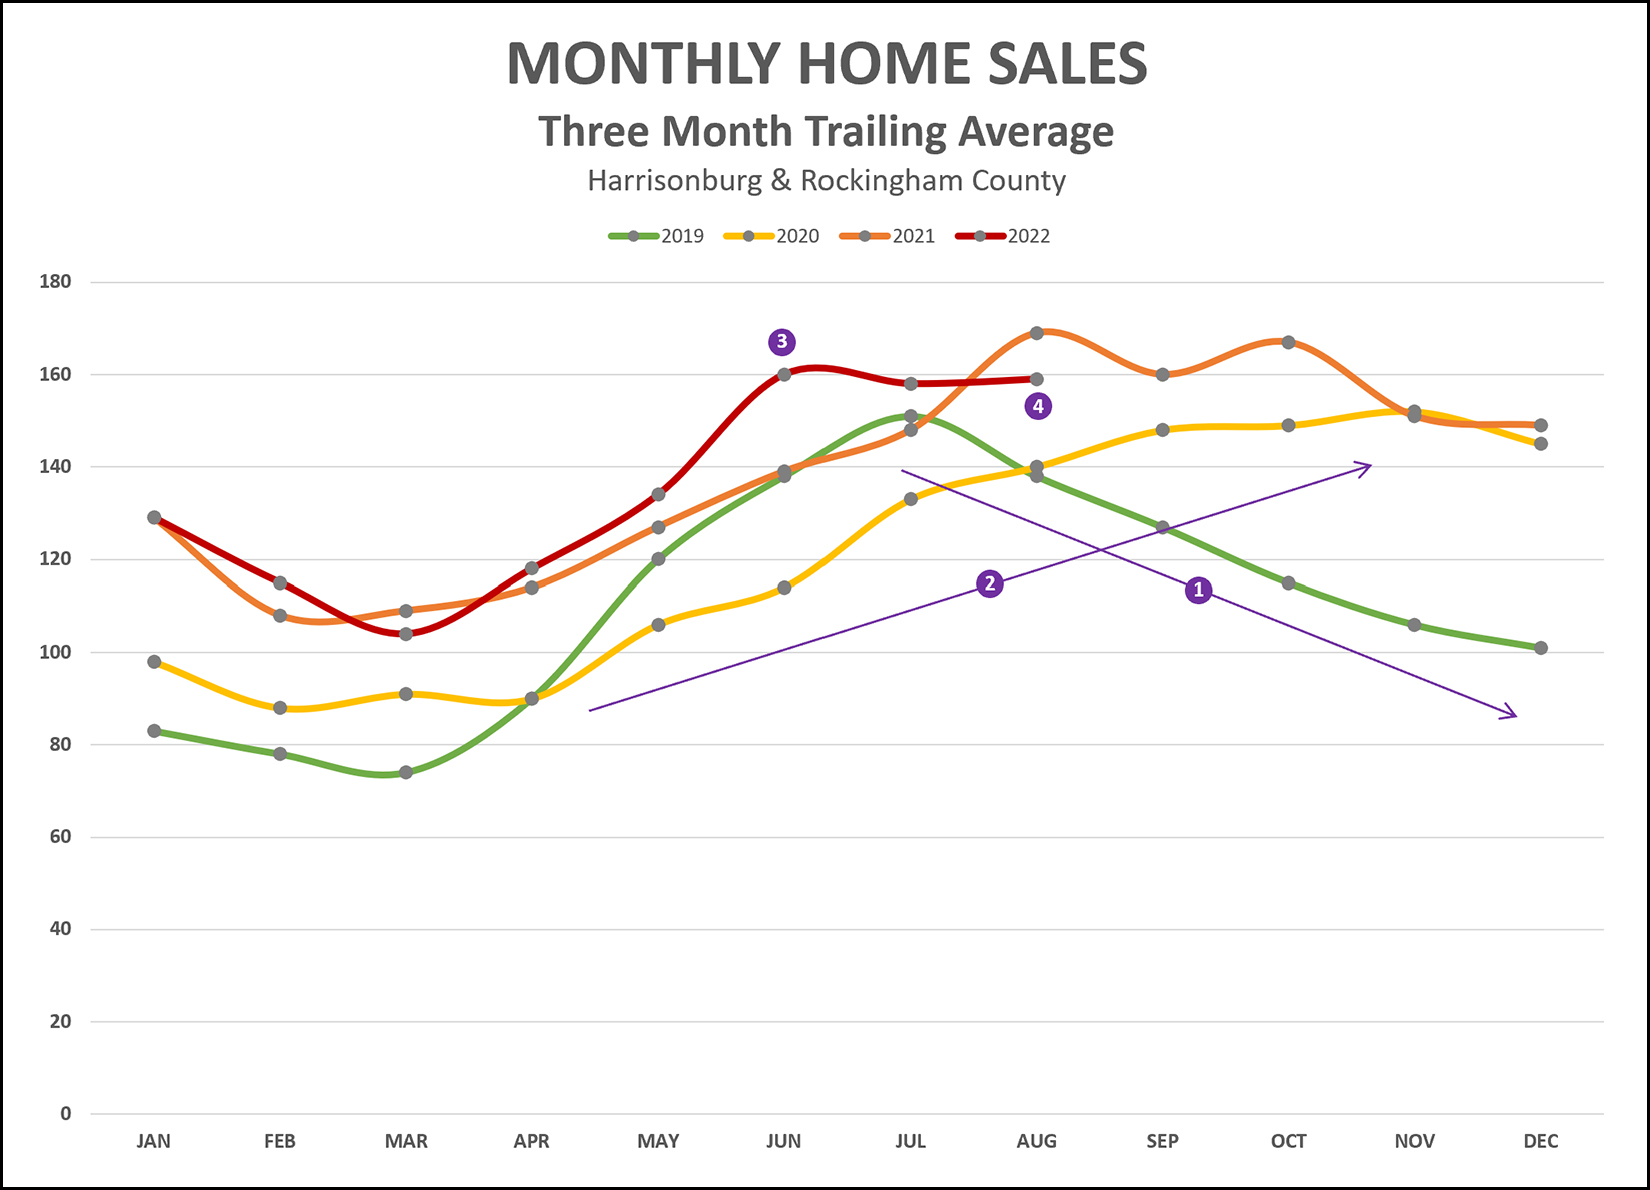
 I usually look at the pace of home sales each month, which shows quite a movement up and down as some months are surprisingly slow and some are surprisingly active. I also usually examine the annual pace of home sales to see how home sales are trending from a long term perspective, though this view of the data is very slow to reveal any shorter term trends. Upon a recommendation from a reader, I have created the graph above that averages the three most recent months of sales in order to smooth out the monthly data but get faster insights into trends than the annual data can provide. Thus... The August 2022 data point is the average of June, July and August home sales. The July 2022 data point is the average of May, June and July home sales. Etc., etc. A few things, then, to point out on the graph above... [0] There are plenty of normal season trends illustrated on this graph. For example, home sales are typically lowest in the first quarter of the year, accelerate through the second and third quarter and then decline in the fourth quarter. This happens most years. [1] The green line (2019) took a nose dive in the second half of the year due to the uncertainty and anxiety of a pandemic sending many people home to work, for school and more. [2] As shown on the yellow line, things were rocking and rolling again by mid 2020 as buyers were snapping up houses as fast as they could because "home" was so important during the pandemic and because of rock bottom interest rates. [3] Looking at the red line (2022) we see that home sales activity was setting new records all the way through June 2022... though that data point is an average of April, May and June. [4] Now that we're into August, we have seen a slight decline in home sales activity as compared to 2021. We are still well above 2020 and 2019 at this point. It will be interesting to see how the remainder of 2022 plays out. It seems unlikely that the market will be as active as it was in the last five months of 2021. Recent Articles:
| |
| Newer Post | home | Older Post |
Scott Rogers
Funkhouser Real
Estate Group
540-578-0102
scott@funkhousergroup.com
Licensed in the
Commonwealth of Virginia
Home Search
Housing Market Report
Harrisonburg Townhouses
Walk Through This Home
Investment Properties
Harrisonburg Foreclosures
Property Transfers
New Listings

