| Newer Post | home | Older Post |
Slightly Fewer Homes Are Selling At Ever Higher Prices |
|
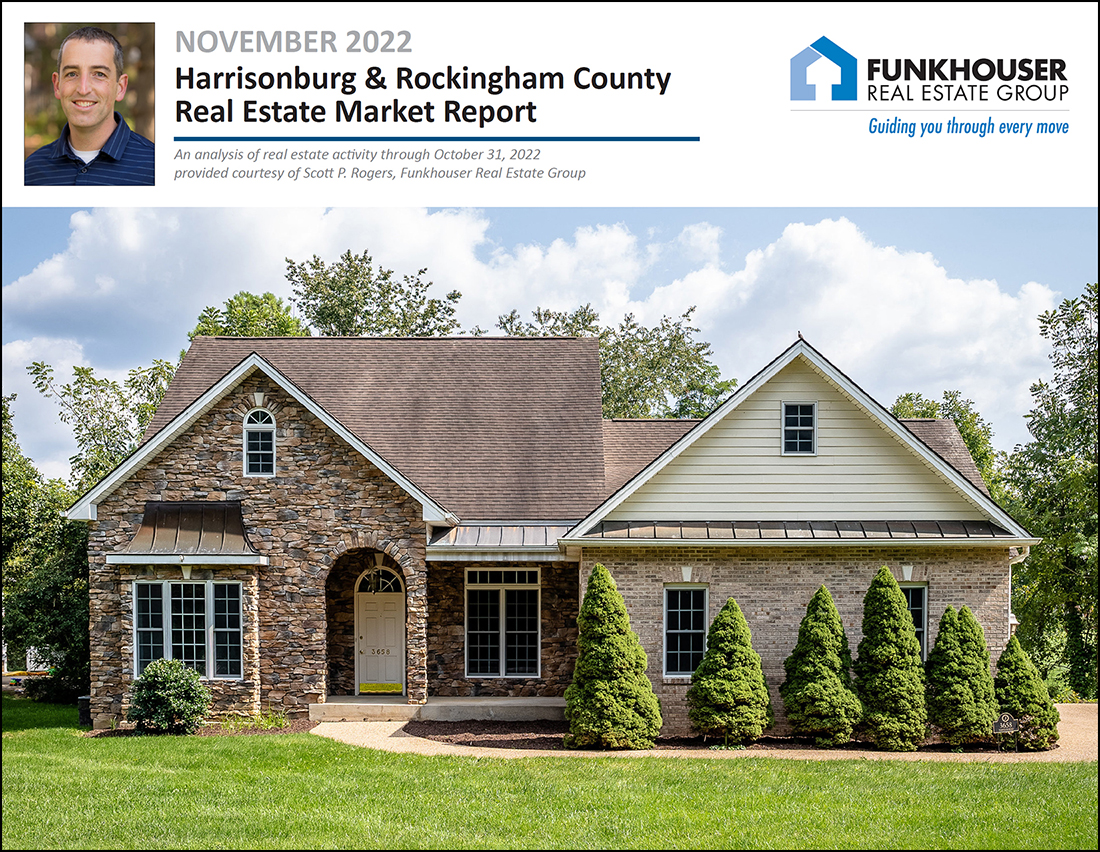 Happy Monday morning, friends! What a delightfully warm fall we had this year! I hope you have taken advantage of the beautiful weather and explored some of the many outdoor adventures the Shenandoah Valley offers us. Late last month, Shaena and I, with several other family members, enjoyed a 30 mile bike ride on the Greenbrier River Trail in West Virginia and took in many beautiful sights along the way. I highly recommend it as a day trip!  Before we get to latest happenings in our local real estate market, each month I offer a giveaway, of sorts, for readers of this market report, highlighting some of my favorite places (or things) in Harrisonburg. Recent highlights have included Bella Gelato, the JMU Forbes Center and the Harrisonburg Half Marathon. This month, I encourage you to go check out Walkabout Outfitter in downtown Harrisonburg where you will find plenty of awesome gear and apparel for your next outdoor adventure! As a bonus, click here to enter to win a $50 gift certificate to Walkabout Outfitter! Also, take a few minutes to check out this month's featured home... a spacious, five bedroom home in Highland Park located at 3658 Traveler Road! Now, then, let's dig into the data. I'll preface it by saying that the trends you might read regarding significant changes in housing markets across the country don't necessarily seem to be showing up in our local housing market at this time. Read on to see what that means from the latest available data... 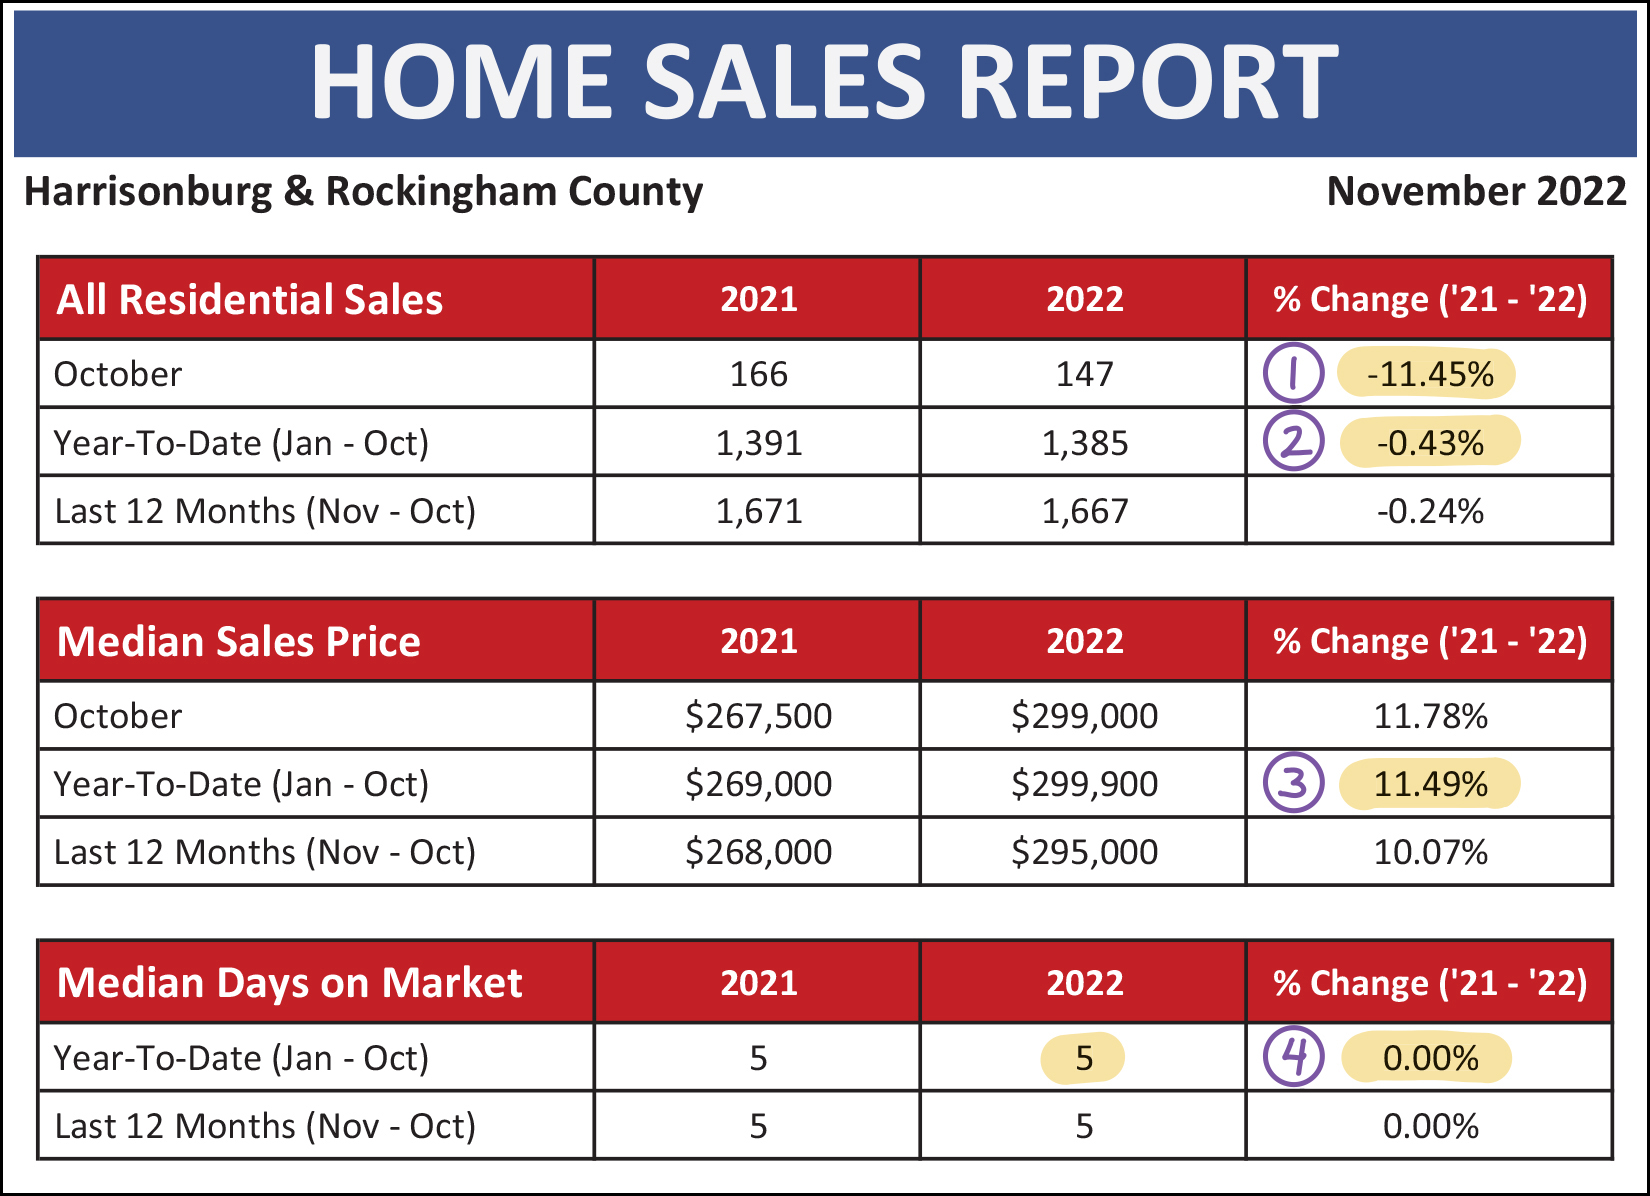 A few things stand out to me as I look at the latest overall numbers in our local housing market above... [1] We saw fewer home sales in October of this year (147) compared to last year (166) which marked an 11% decline in monthly sales activity. [2] This decline in October sales piles onto January through September sales to show a tiny decline in home sales (-0.43%) when looking at the first ten months of this year compared to the first ten months of last year. [3] Homes are still selling for quite a bit more now than they were last year. The median sales price of homes sold thus far in 2022 has been $299,900 -- up 11.5% from last year when the median sales price was $269,000. [4] Homes are still selling (as a whole) just as fast now as they were last year. The current median days on market is five days... just as it was a year ago at this time. This means that half (or more) of homes that sell are under contract within five days of being listed for sale. So... a slower than expected October, but otherwise still quite a strong year of home sales activity. That theme will continue as we work our way through the rest of the data, with only a few exceptions. It is interesting to note the slight difference in performance of detached single family homes compared to attached homes, which includes duplexes, townhouses and condos... 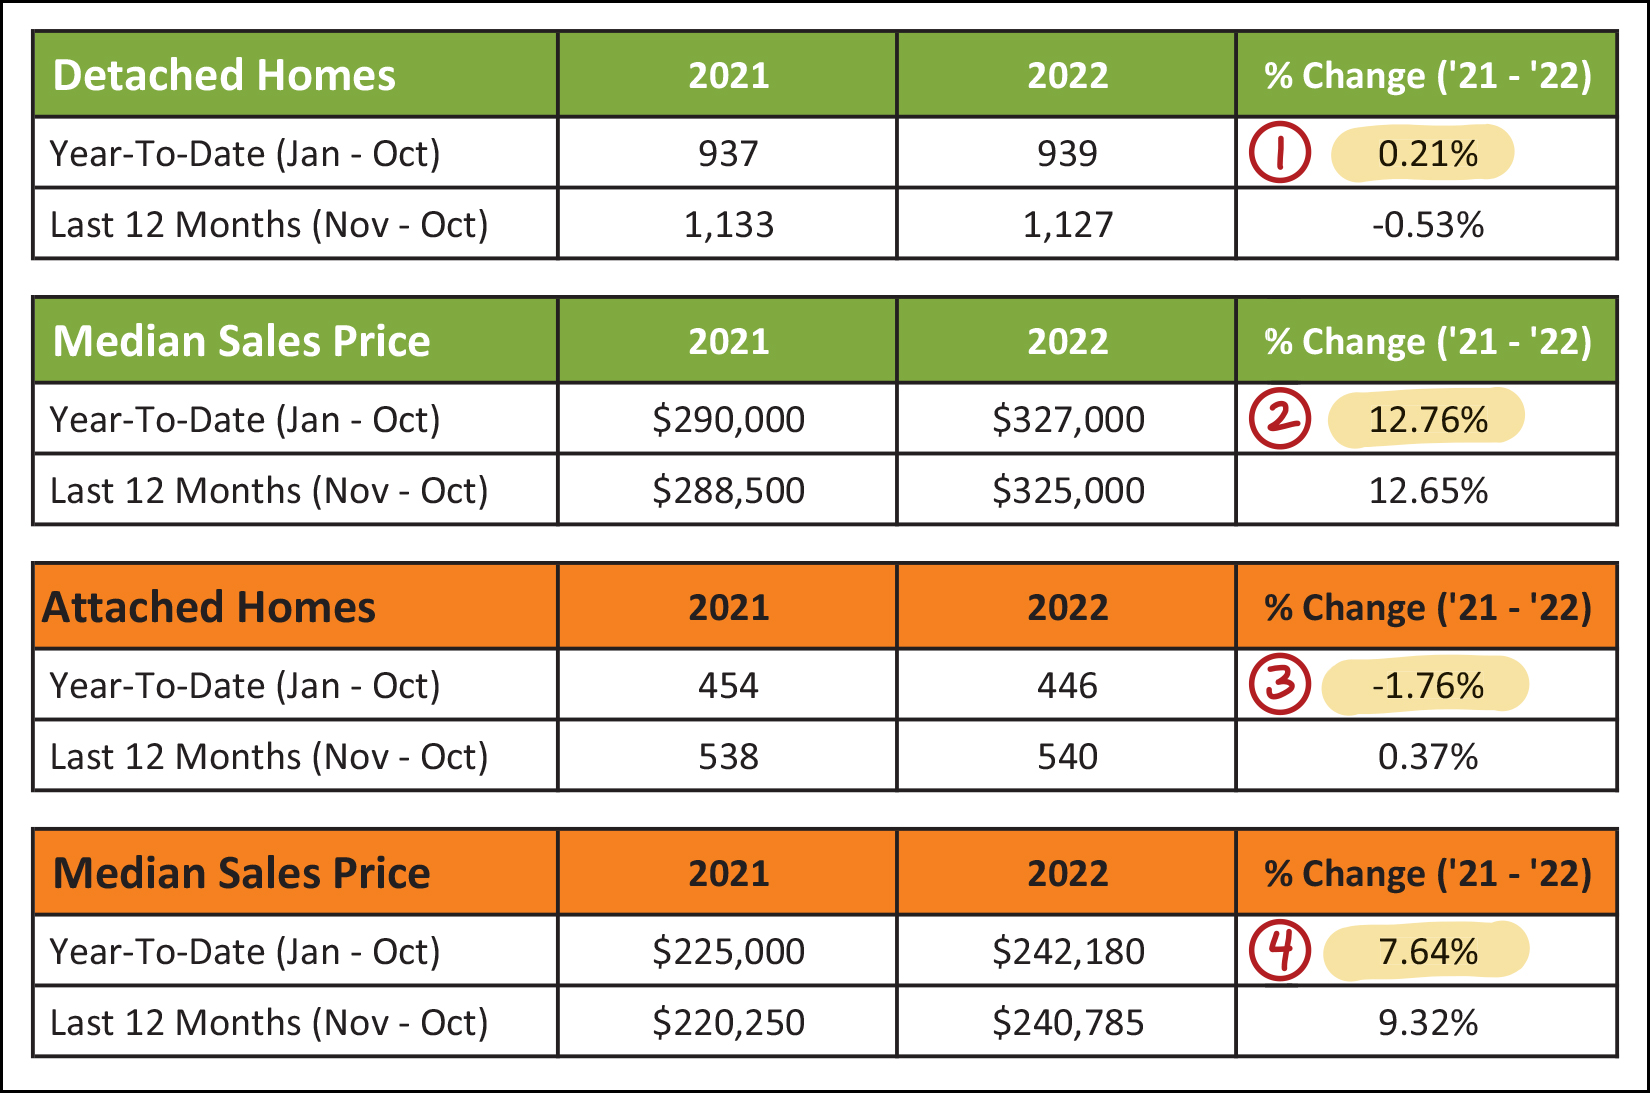 [1&2] Detached single family home sales are shown in the first two green tables above and you'll note that there were just about the same number of sales this year (939) as last year (937) and that the median sales price has increased 13% over the past year. [3&4] In contrast, we have seen a slightly decline (-2%) in attached home sales over the past year and the increase in the median sales price (+8%) is slightly lower than that of single family homes. So, the "detached" portion of our local housing market has outperformed the "attached" portion of the market, but not significantly. Looking at the last few months graphically, it seems the lower month of home sales in October was actually... the fourth month in a row of fewer sales... 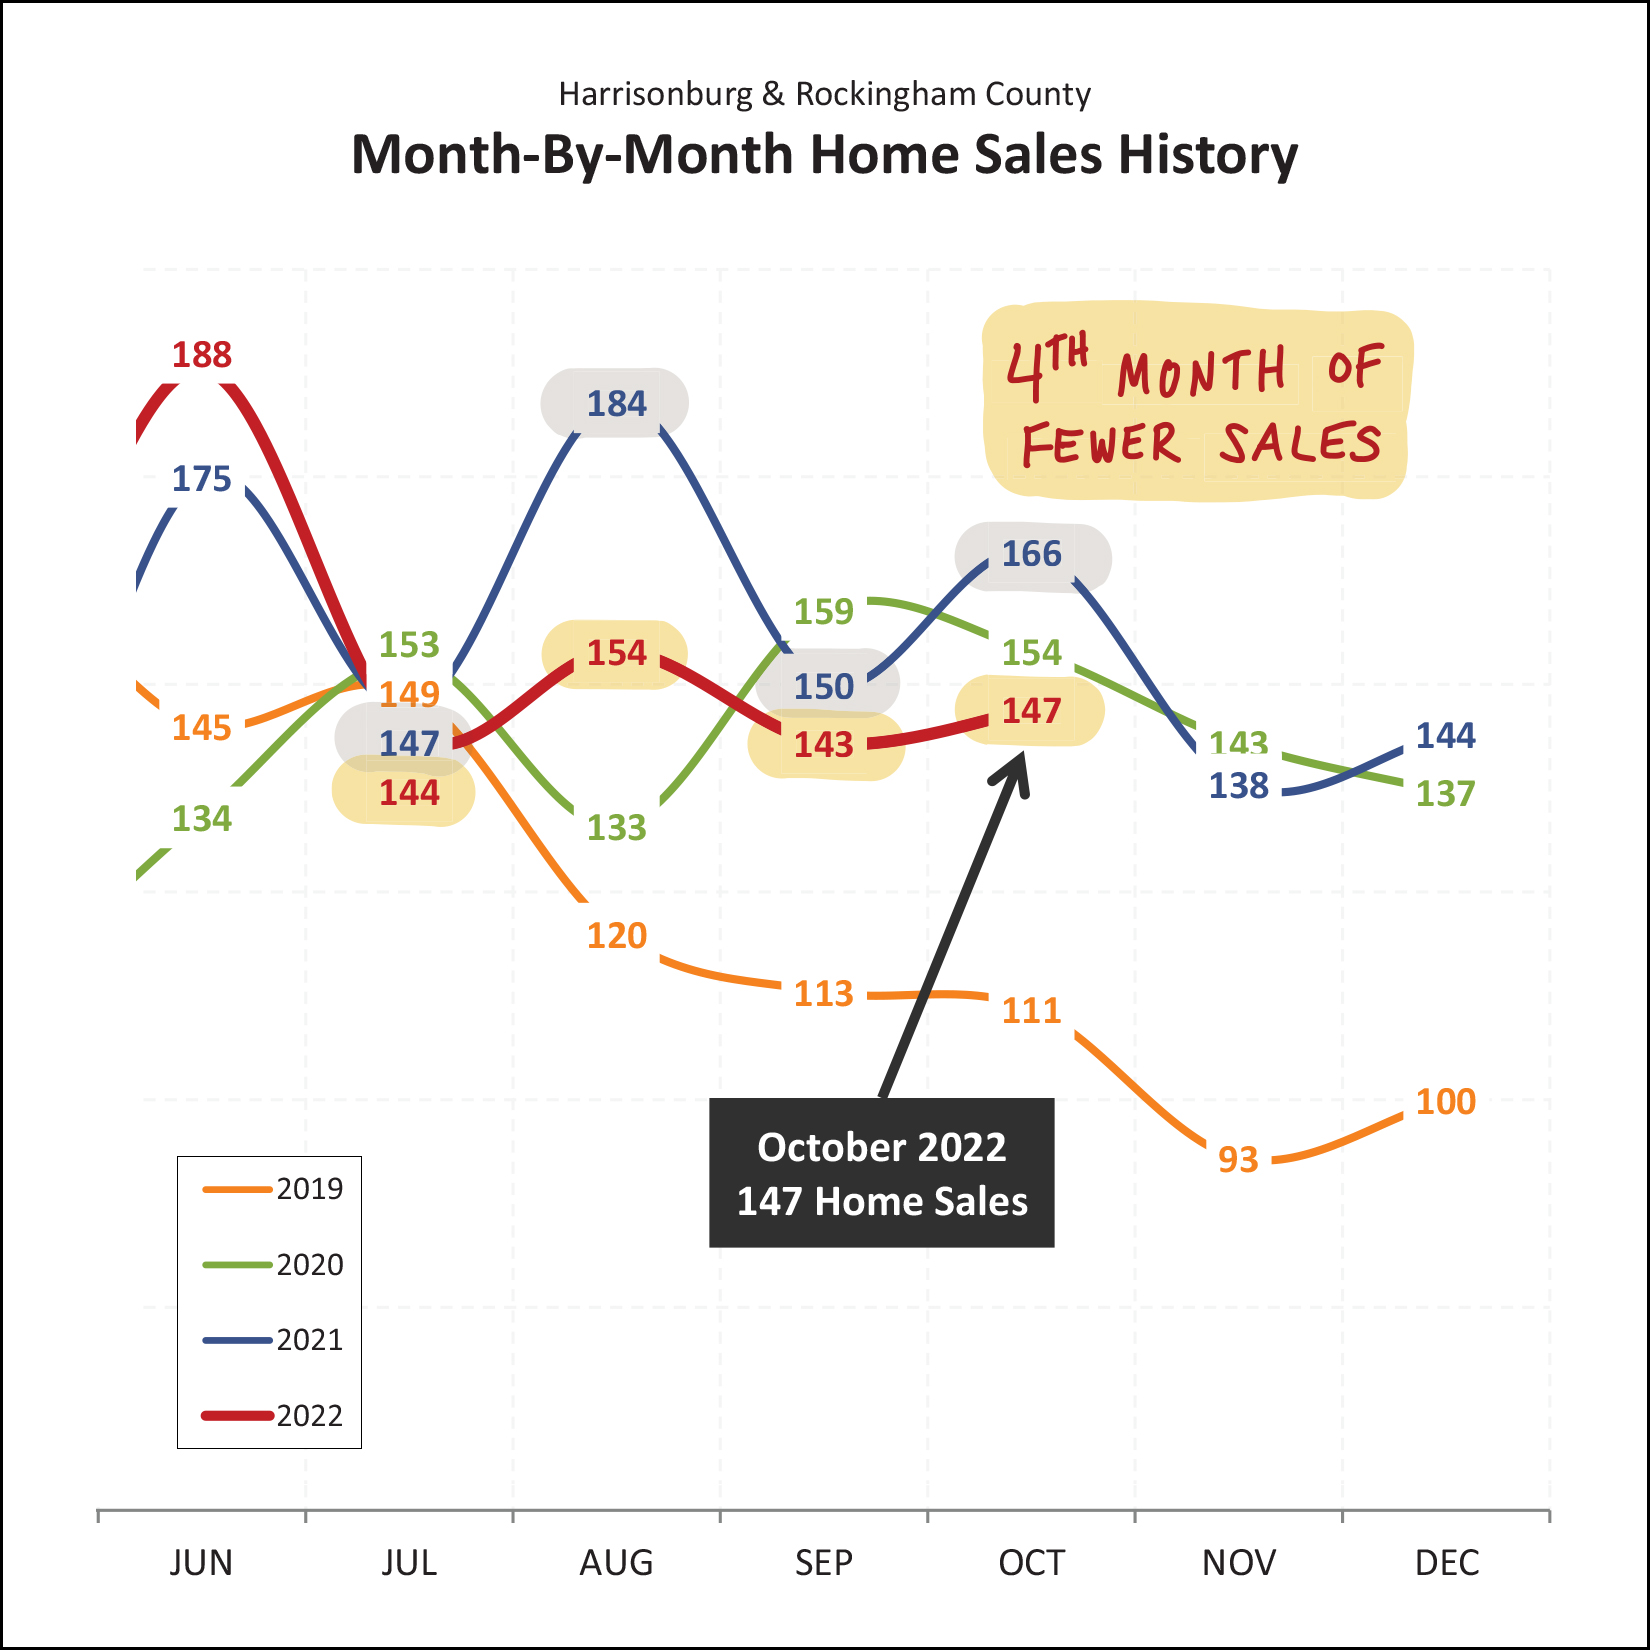 During each of the past four months (Jul, Aug, Sep, Oct) we have seen fewer home sales this year than during the same month last year. Looking ahead, it seems very likely that we will see fewer home sales in November and December as well, especially once we consider the number of contracts signed (or not signed) in October. Read on for more on that... Here, then, for the first month in quite a few years, I am reporting that the pace of home sales (the number selling) is declining... ever so slightly... 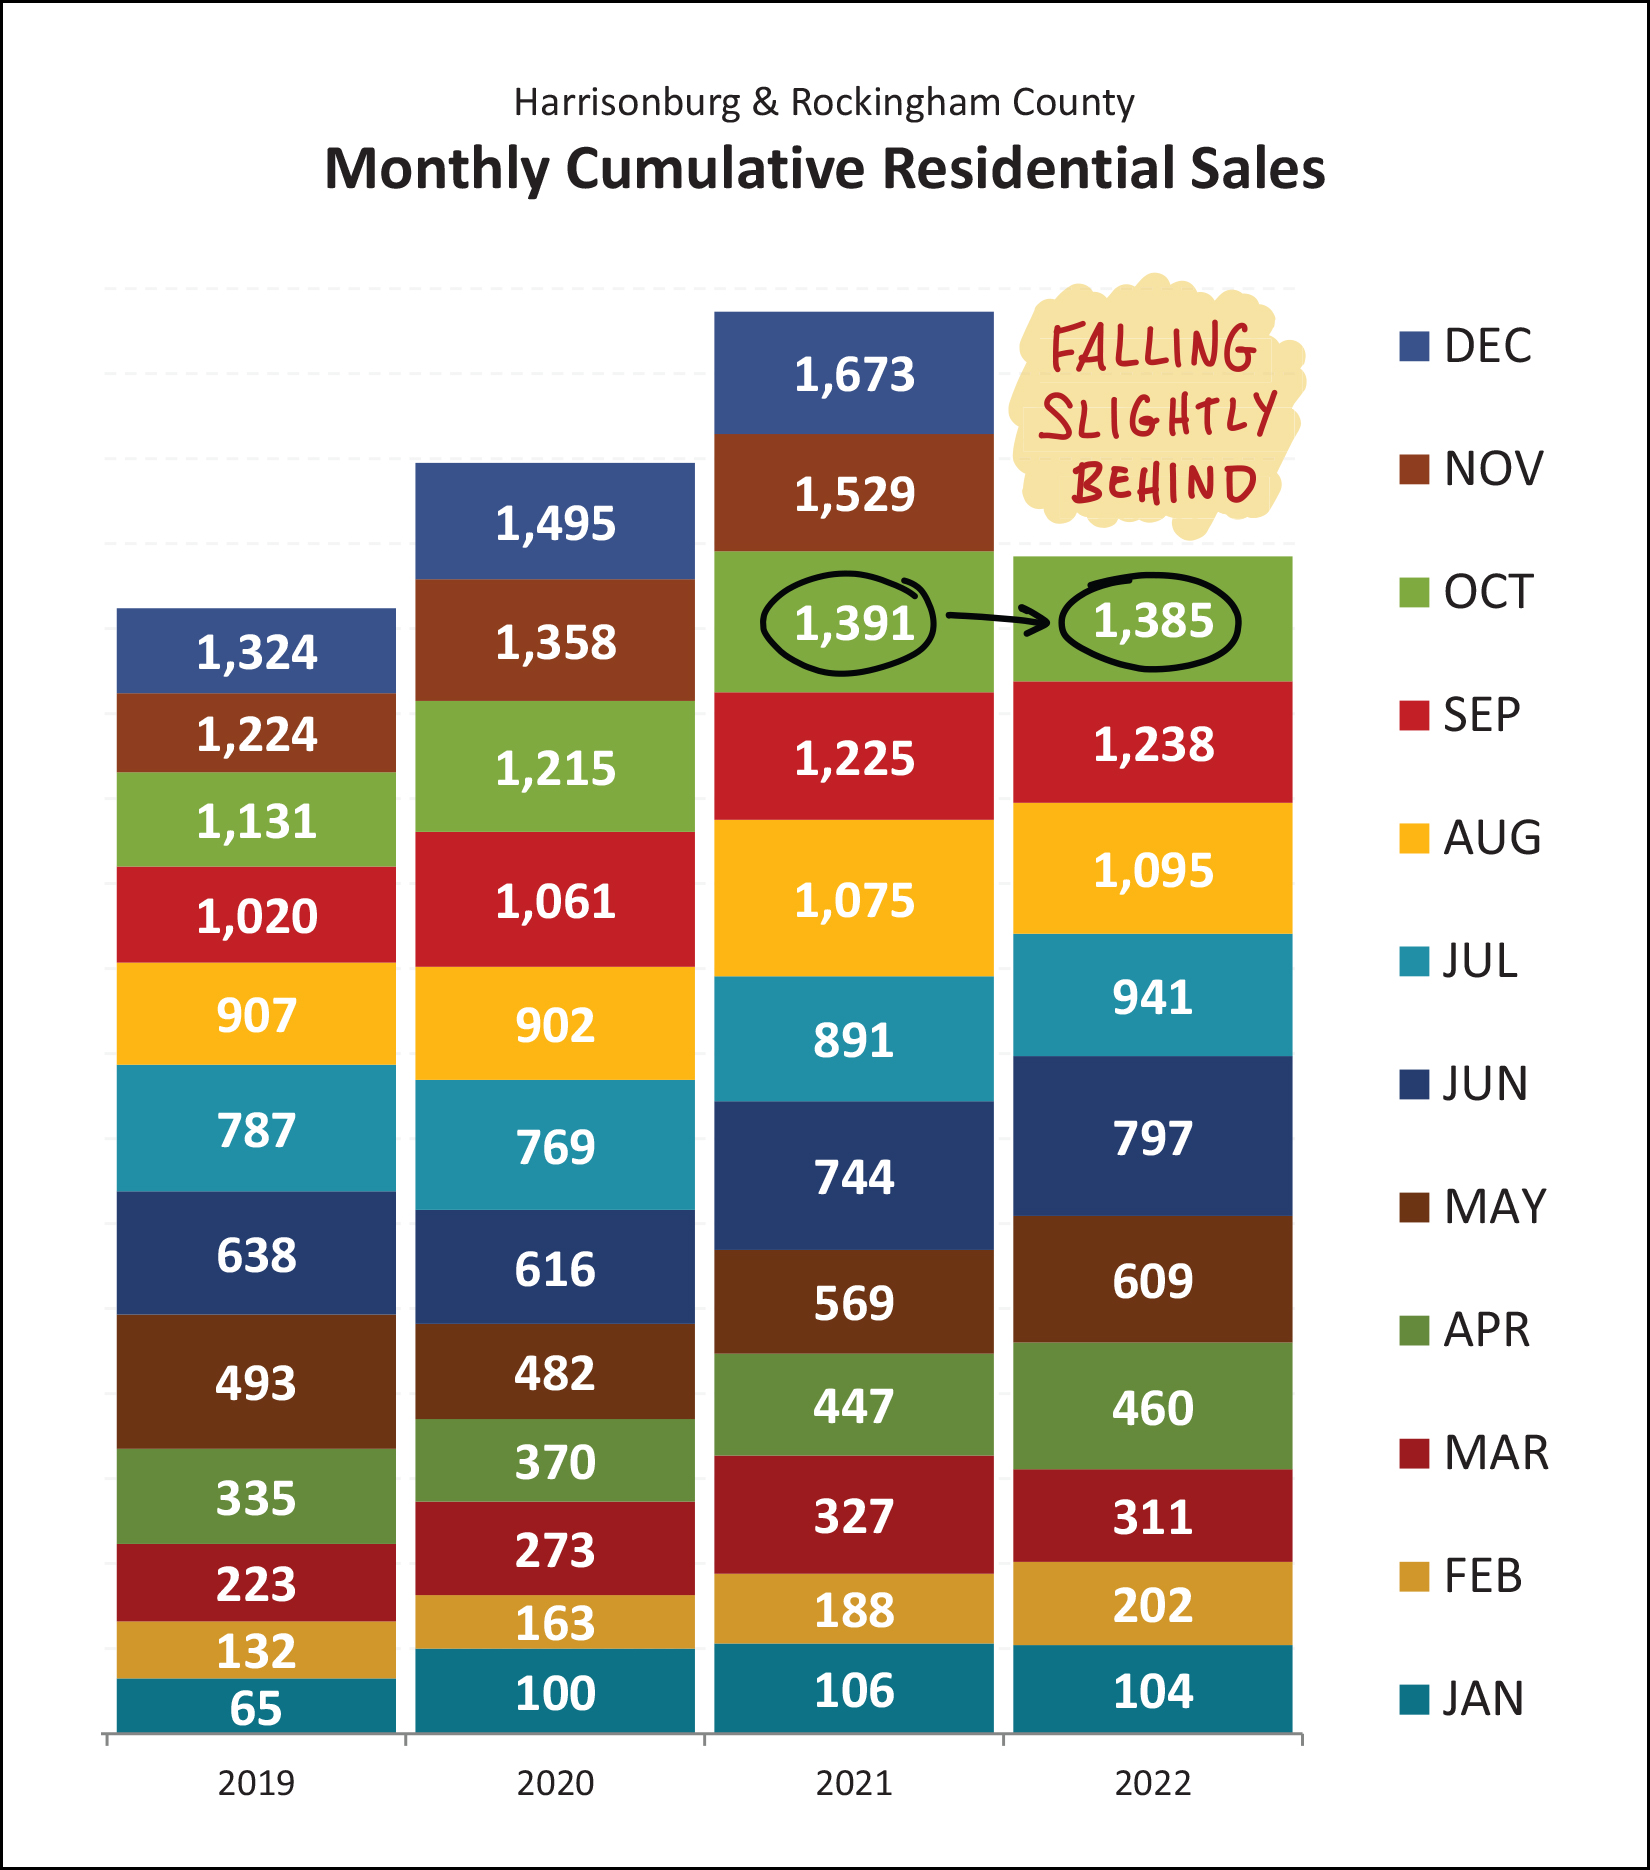 Don't get me wrong, it's been exciting to report each and every month for the past few years that there have been more, and more, and more home sales. But perhaps this rapid increase in the number of homes selling could not go on forever. This year and last are now relatively even when looking at the first ten months of the year, but 2022 is falling slightly behind. At this point, I am predicting that we'll see 2022 fall a bit further behind as we finish out the year. But despite fewer sales, prices are... 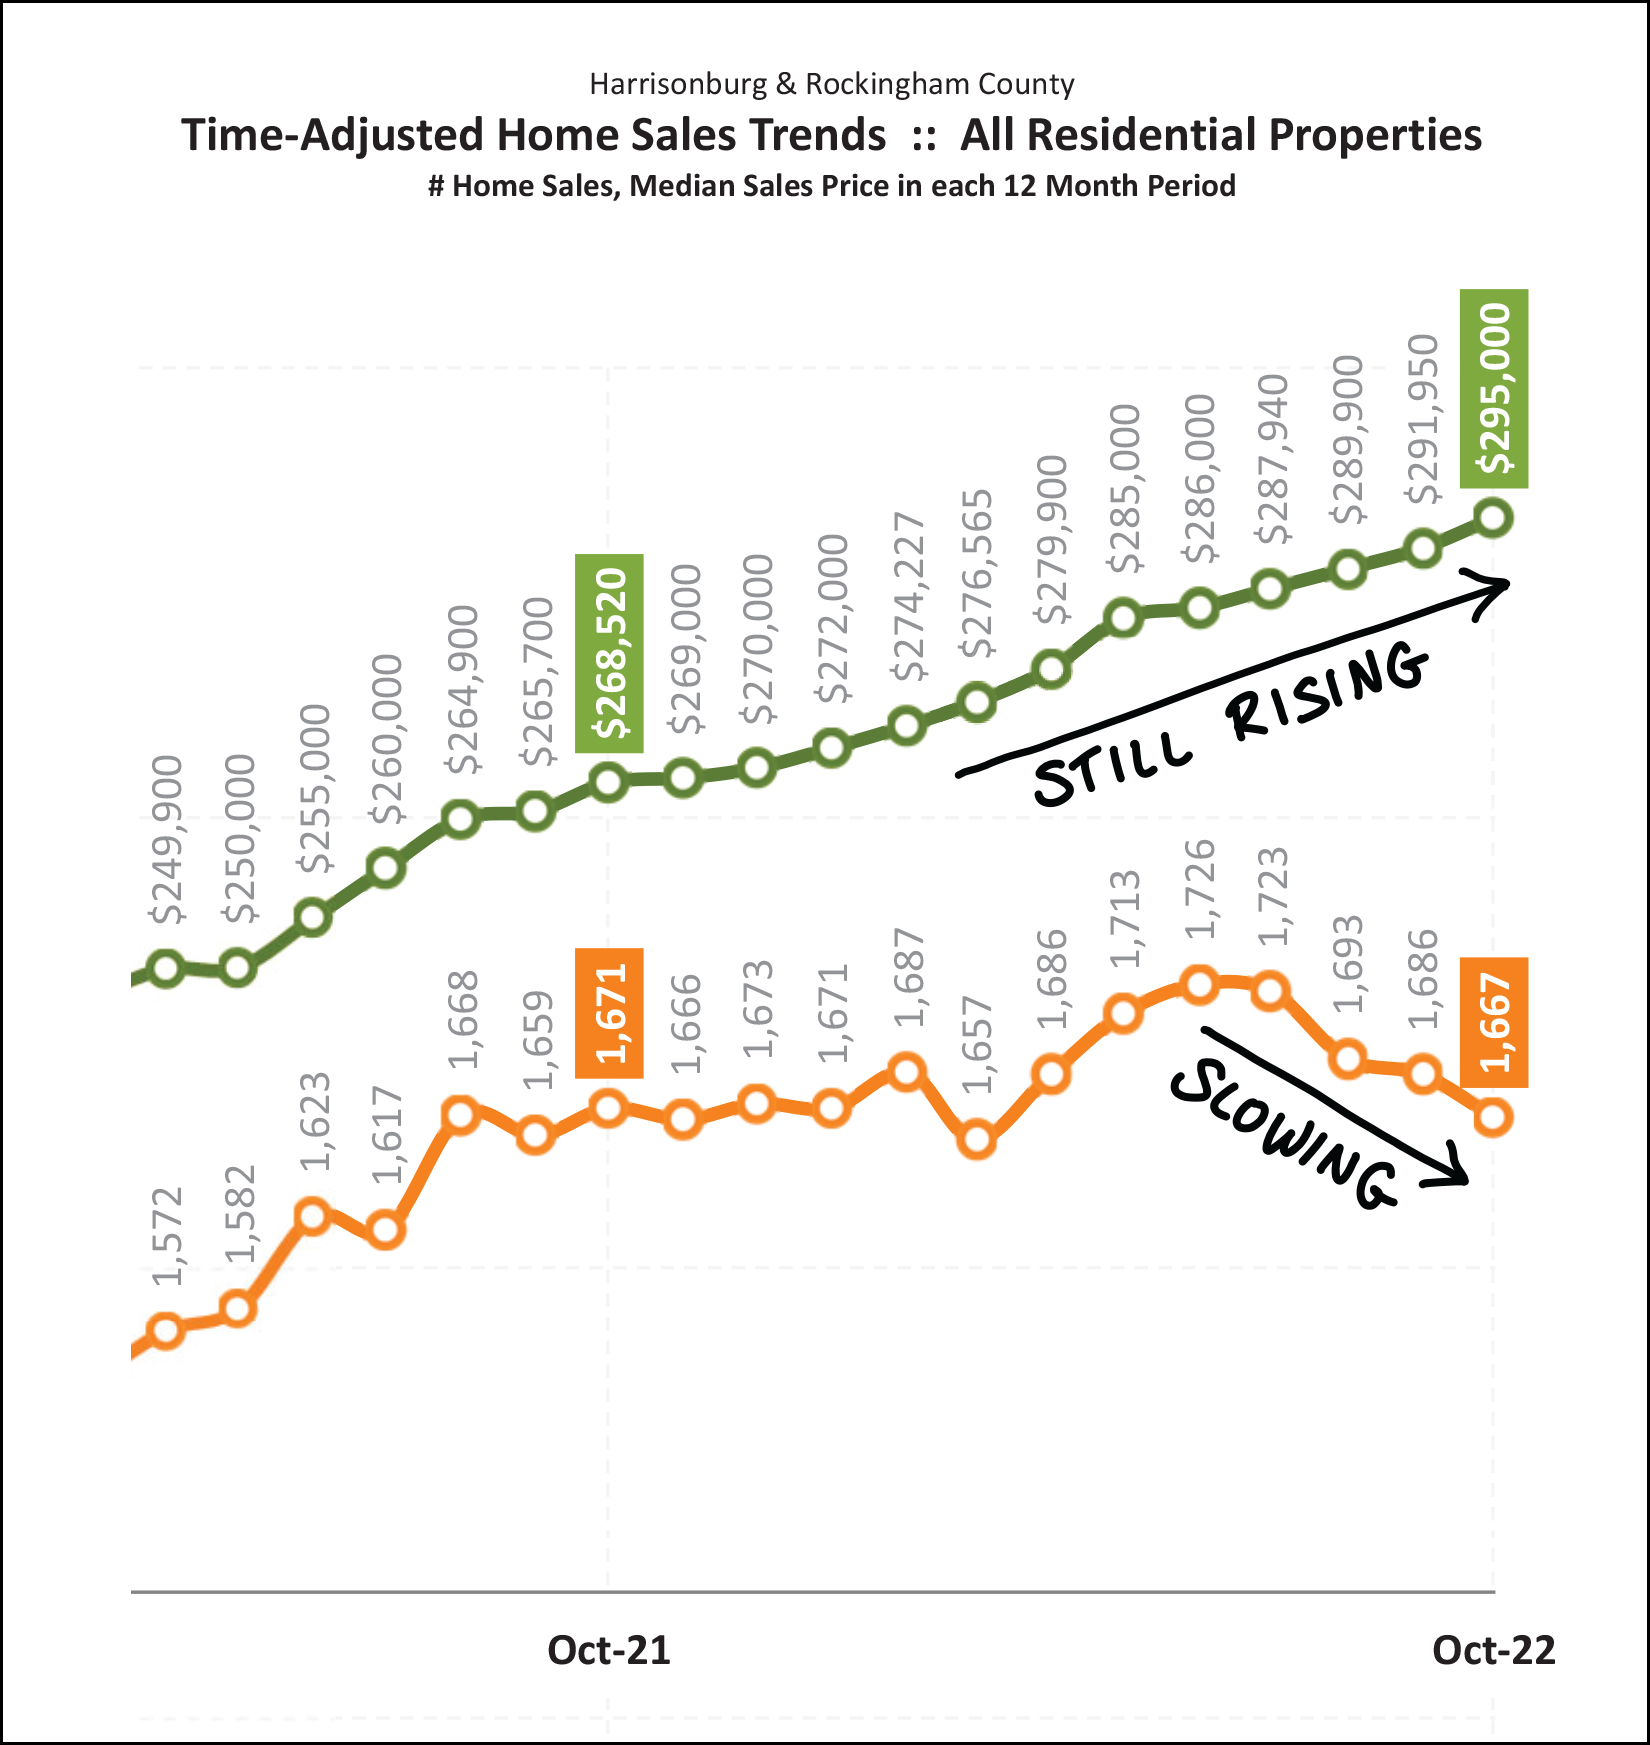 Yes, indeed, home prices are still rising. The orange line above shows the number of homes selling in a year's time. The last four months of declines in the annual pace of sales is a result of those four months of fewer sales shown in the previous graph. We have now seen a decline from a peak of 1,726 sales per year down to 1,667 sales per year. But despite fewer sales... home prices keep on climbing! The median sales price of homes sold in Harrisonburg and Rockingham County over the past year has now risen to $295,000. As one of my past clients once pointed out... most homeowners don't care how many homes are selling... they care about the prices of those homes that are selling. So, from an overall market perspective, things are still looking rather bright in the local housing market as prices seem to still be on the rise, even if we are seeing slightly fewer home sales. Another trend that is interwoven into this equation is housing inventory... how many homes are on the market for sale at any given point... 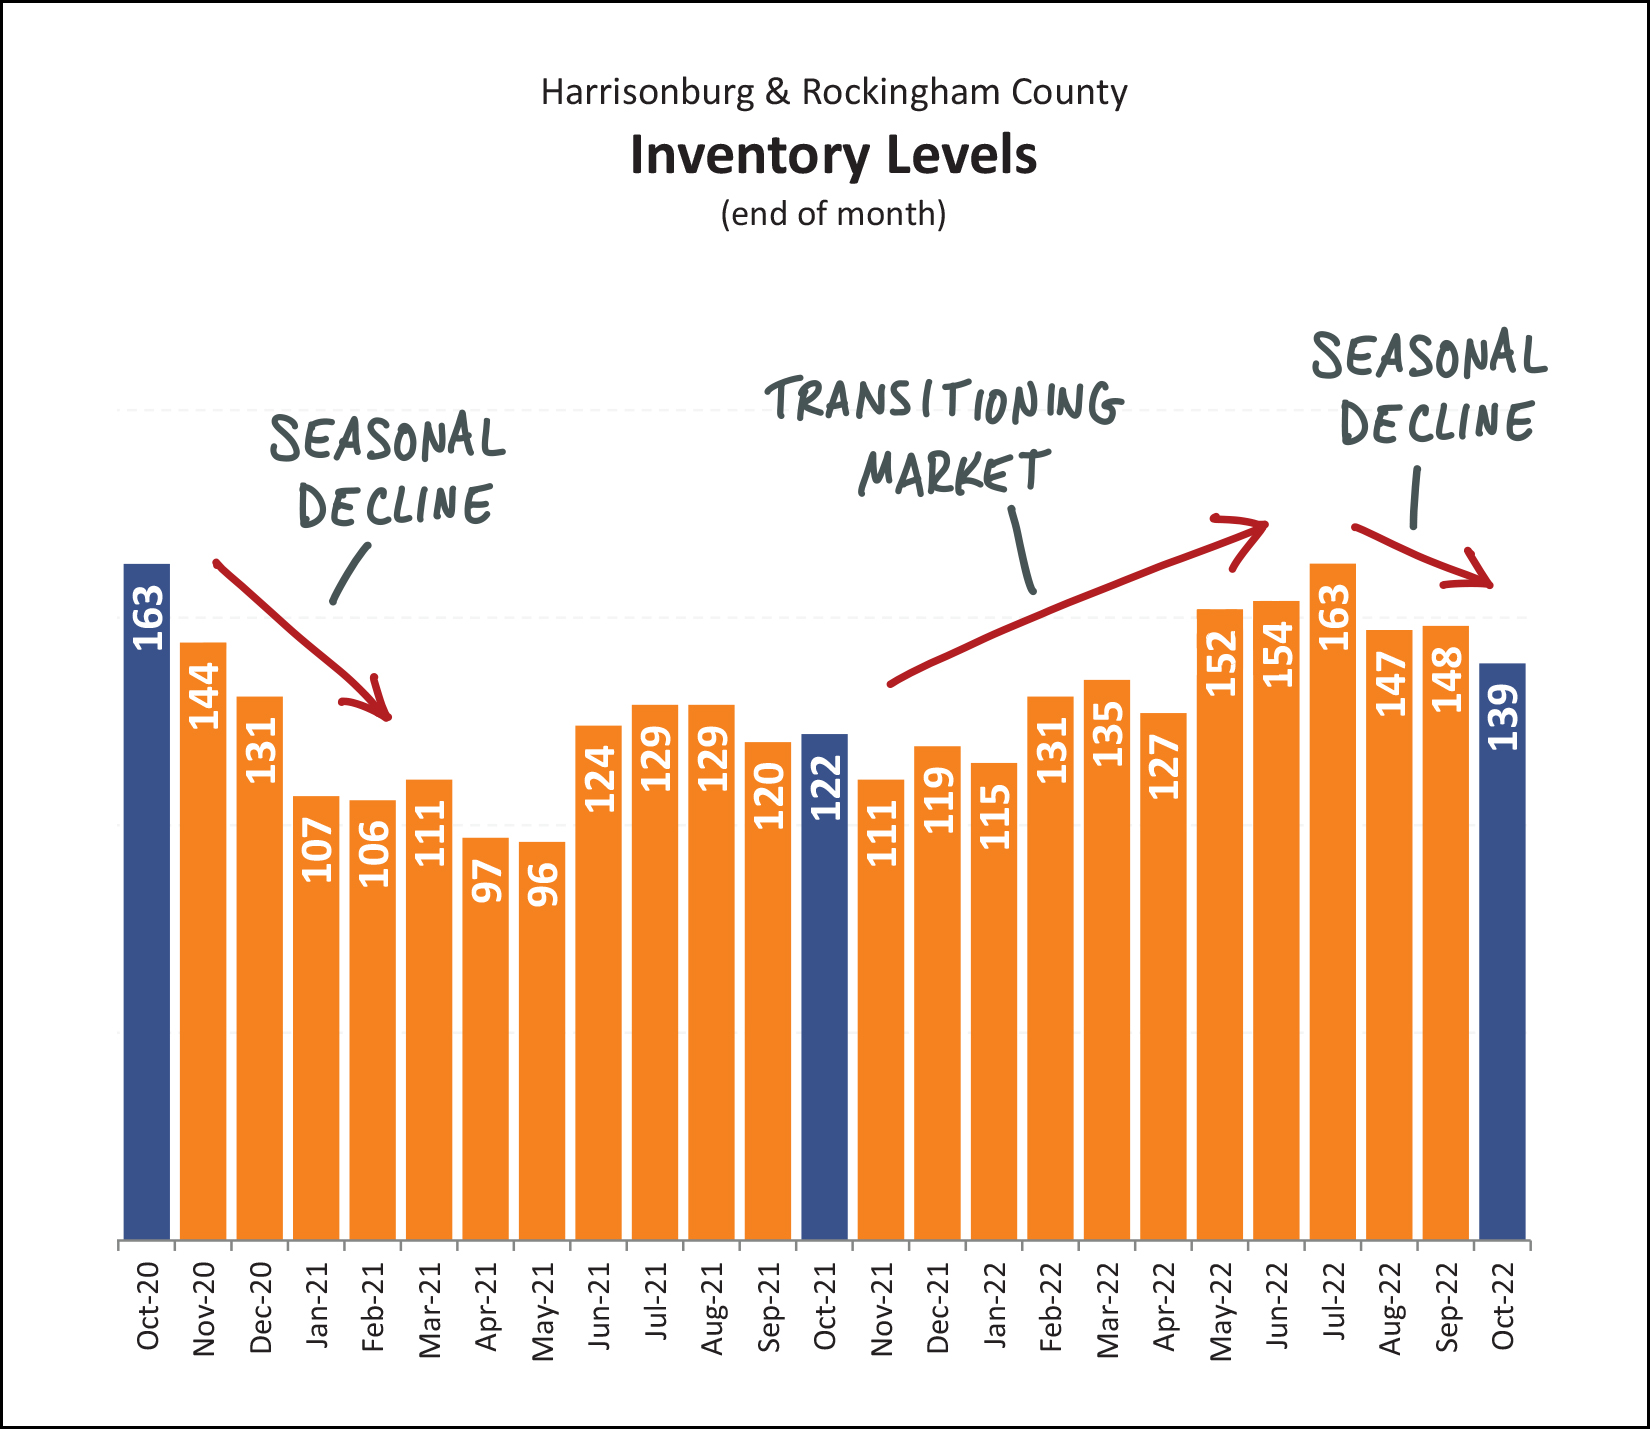 Over the past several years we have seen extremely low inventory levels at any given point in time. Plenty of homes have been listed for sale, but they have gone under contract very quickly given very strong buyer demand in almost all price ranges and locations. During much of 2022 we started to see an increase in the number of homes listed for sale...rising to 163 homes for sale in July... compared to only 129 the previous July. So, yes, the market seems to be transitioning a bit... perhaps we won't see super low inventory levels forever. But despite signs of a slowly transitioning market during the spring and summer of 2022, we are now seeing a normal seasonal decline in inventory levels as we work our way into the fall. The place where the rubber meets the road is when we combine buyer activity (demand) and housing inventory (supply) to see what balance does or does not exist in the market... 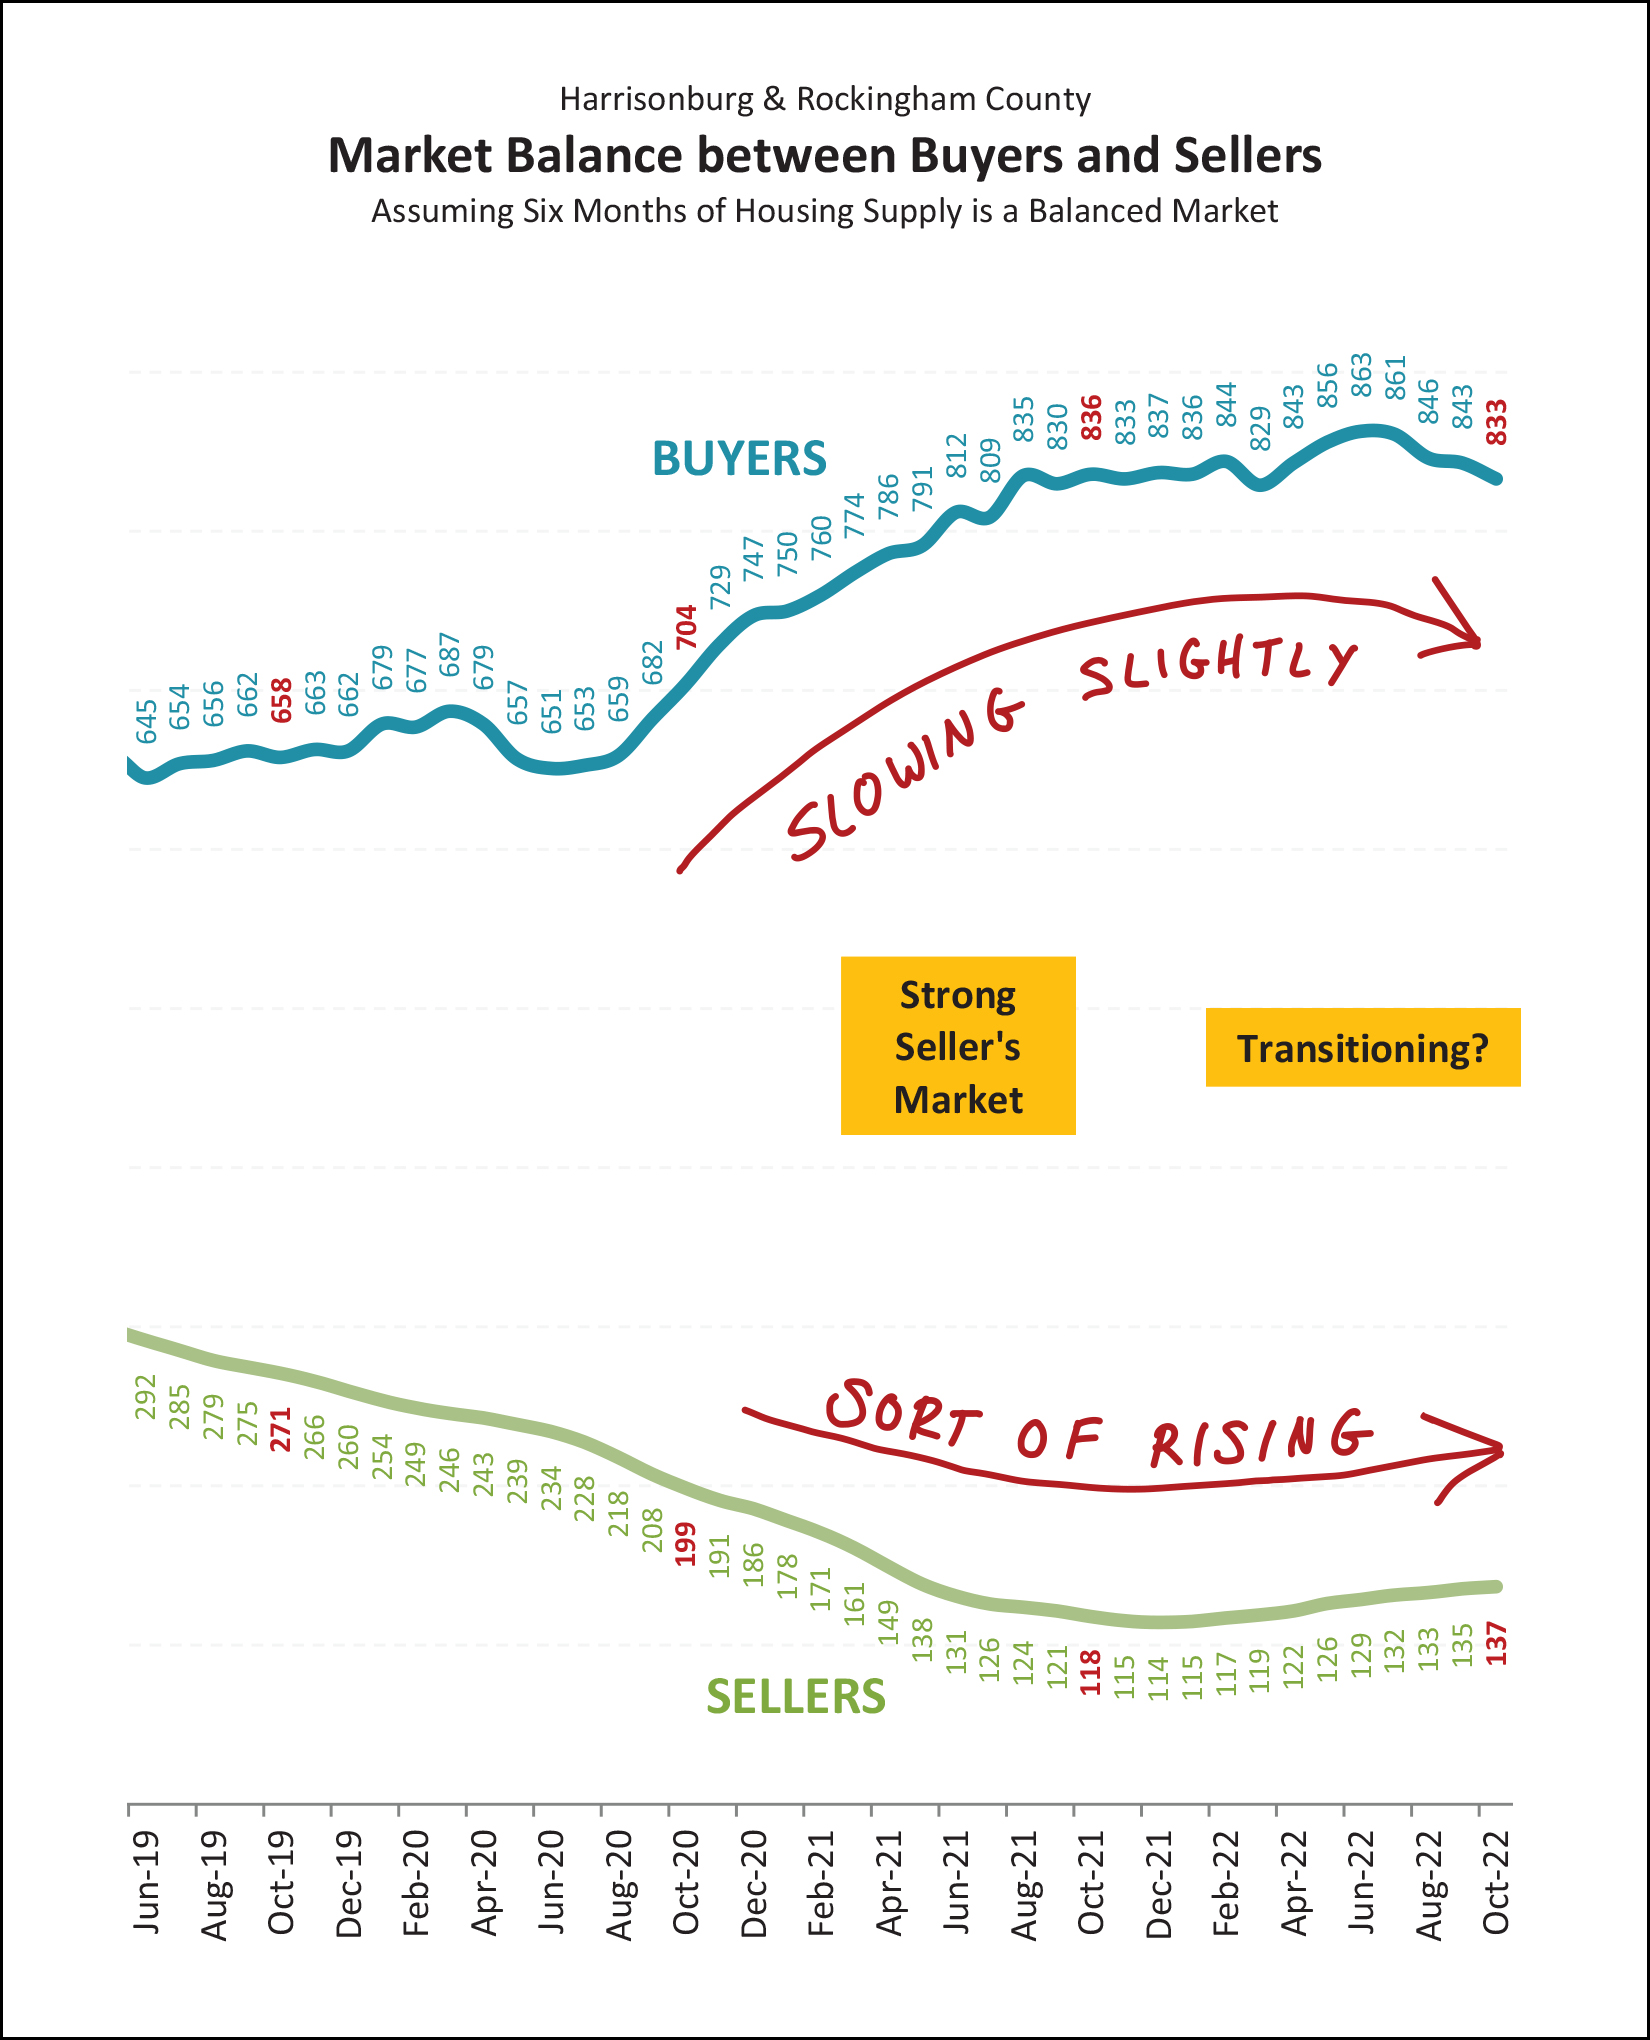 As shown above, we may be starting to see a slight, modest, tiny transition in the balance of the market. We are starting to see buying activity slow... slightly. We are also starting to see inventory levels rise... slightly. Do keep in mind, though, that this is likely a transition from an extremely strong seller's market to a very strong seller's market. There is still very strong demand in the market for most properties at most price points and in most locations. To get anywhere close to being a balanced market we would need to see much more significant declines in buyers who want to buy homes and much more significant increases in sellers who want to sell homes. I'm realizing now that my preceding paragraph might now seem like it was leading up to this next graph. Digest the next graph... don't fall off of your chair... and then keep reading below... 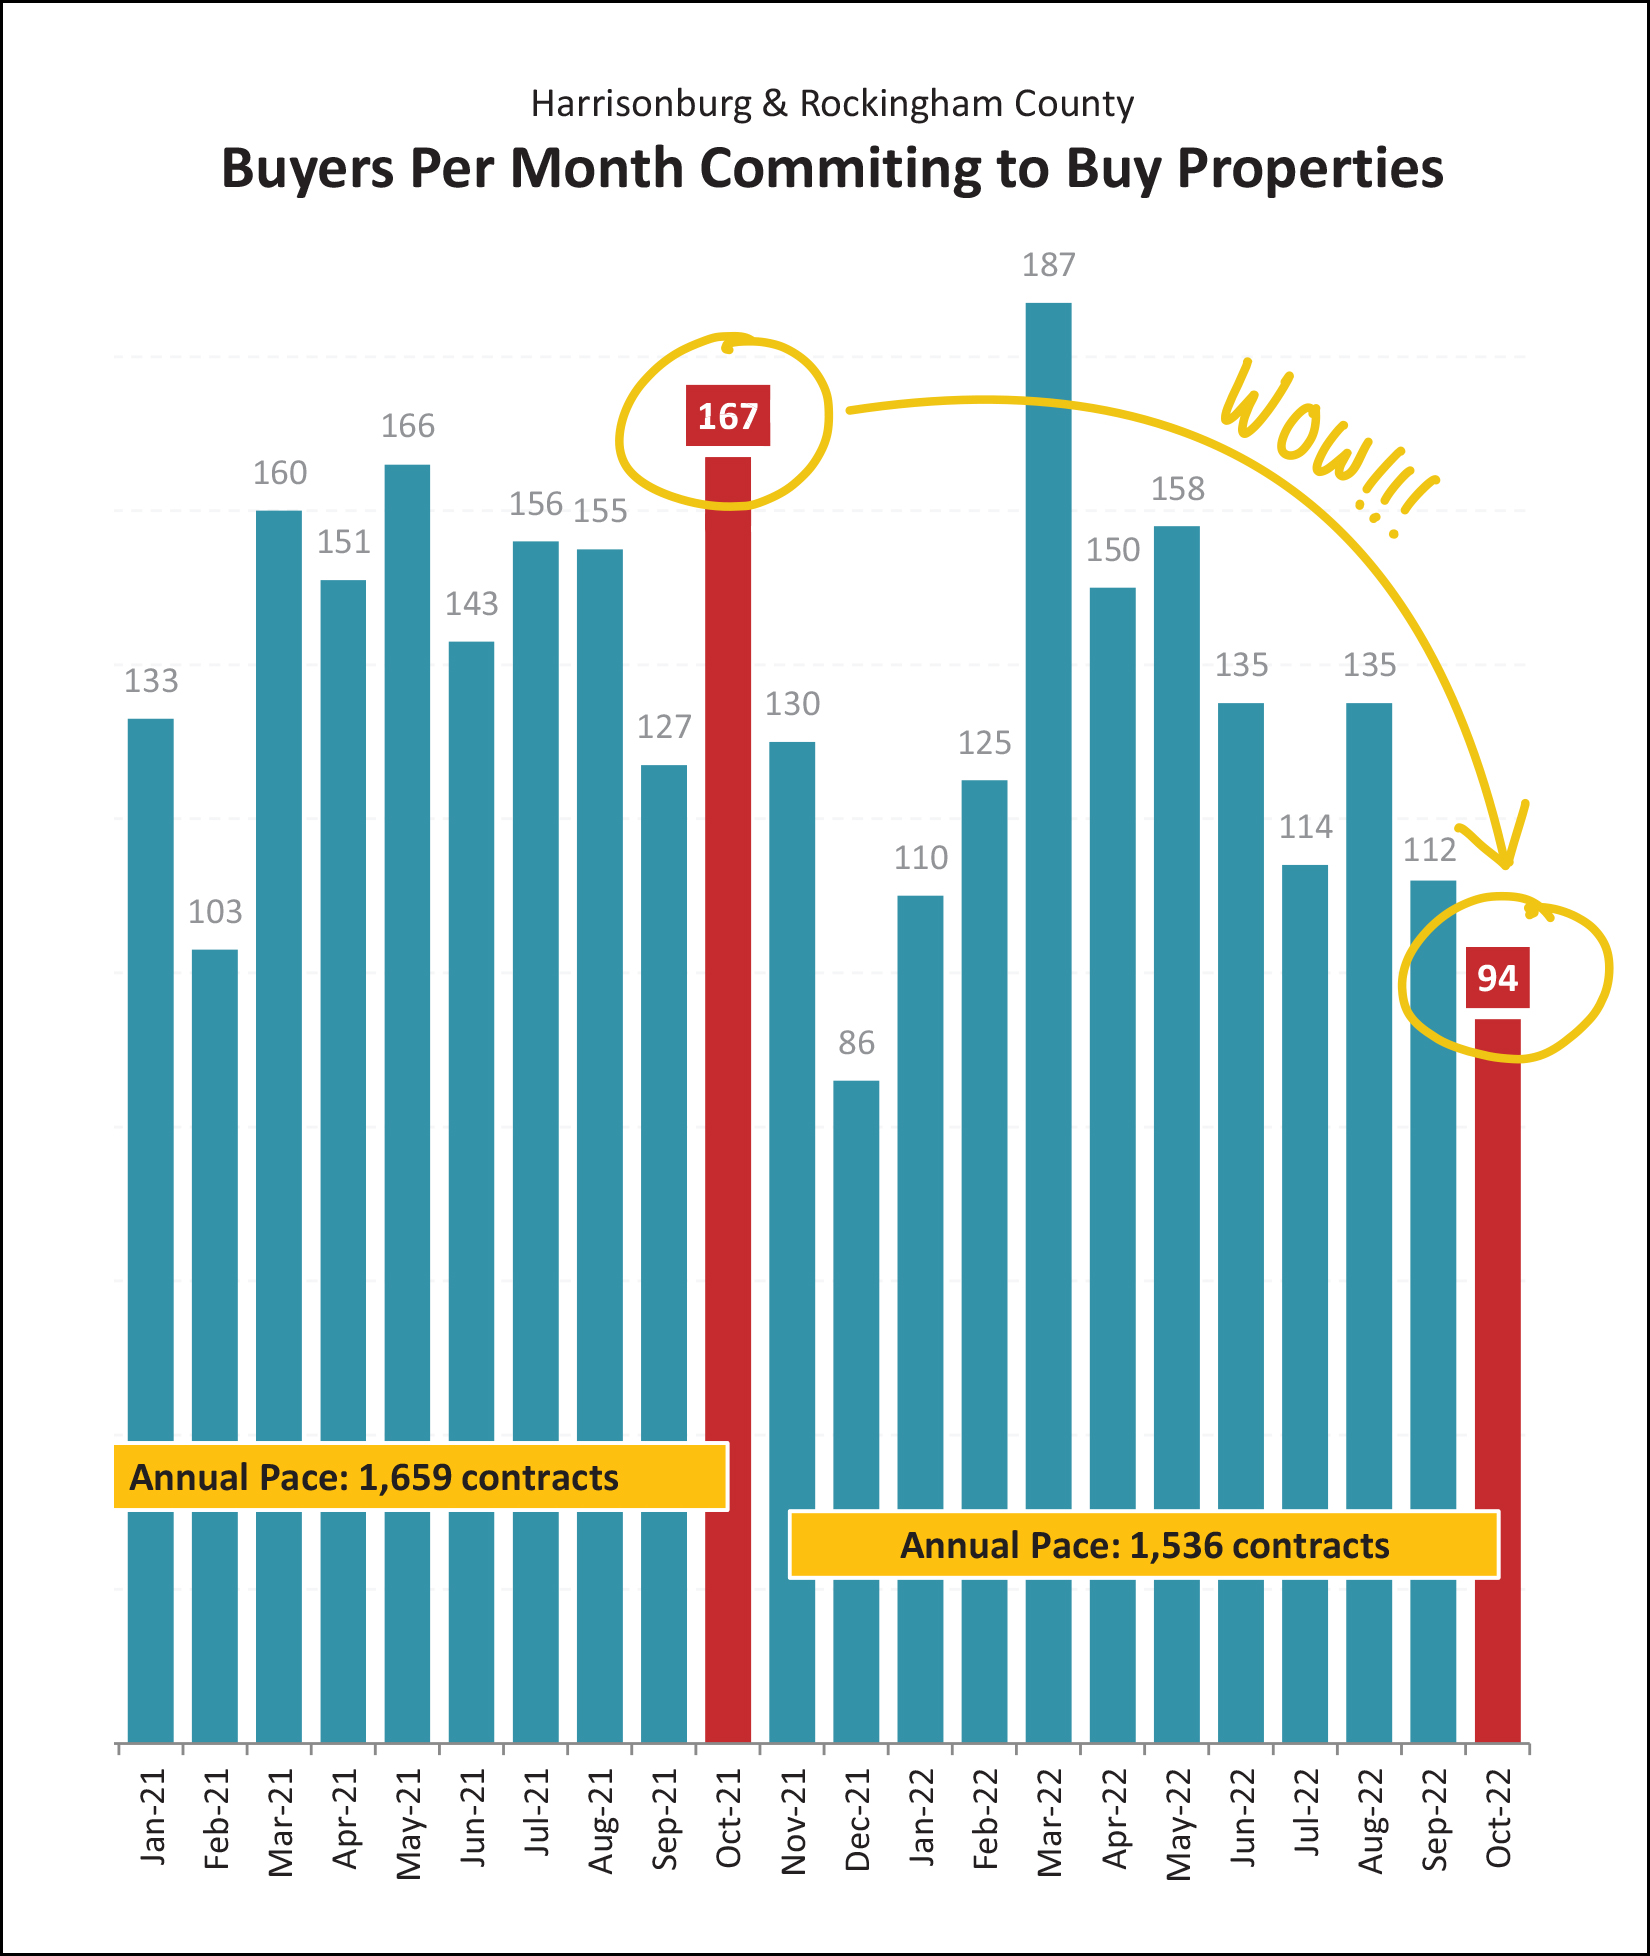 Somewhat surprising, right? There was a significant, large, drastic, huge decline in contracts being signed this October as compared to last October. Why? What happened? Does this mean the market is turning on a dime? Is buyer demand dropping off a cliff overnight? I'd point out a few things... [1] Mortgage interest rates did jump up again, significantly, in September and October - which likely played at least some role in slowing down buyer enthusiasm. Which, side note, was the intended effect -- or at least an understood side effect -- of the interest rate hikes. [2] If we're surprised by the low number of contracts signed this October we should probably be equally (or even more) surprised by the ridiculously high number of contracts signed last October. Last October was the peak of contract signing in all of 2021, which is odd -- that doesn't usually happen in October. All that is to say, the number of contracts signed in October (94) leads me to believe that we will see slightly slower months of home sales in November and December, but it does not cause me to conclude that the market changed drastically sometime in October. Clearly, though, only time will prove me right, wrong, mostly right or mostly wrong. ;-) So... with this big (but perhaps temporary) decline in contracts being signed... and with the slight decline in homes selling... it's probably safe to say that homes are not going under contract as quickly, right? 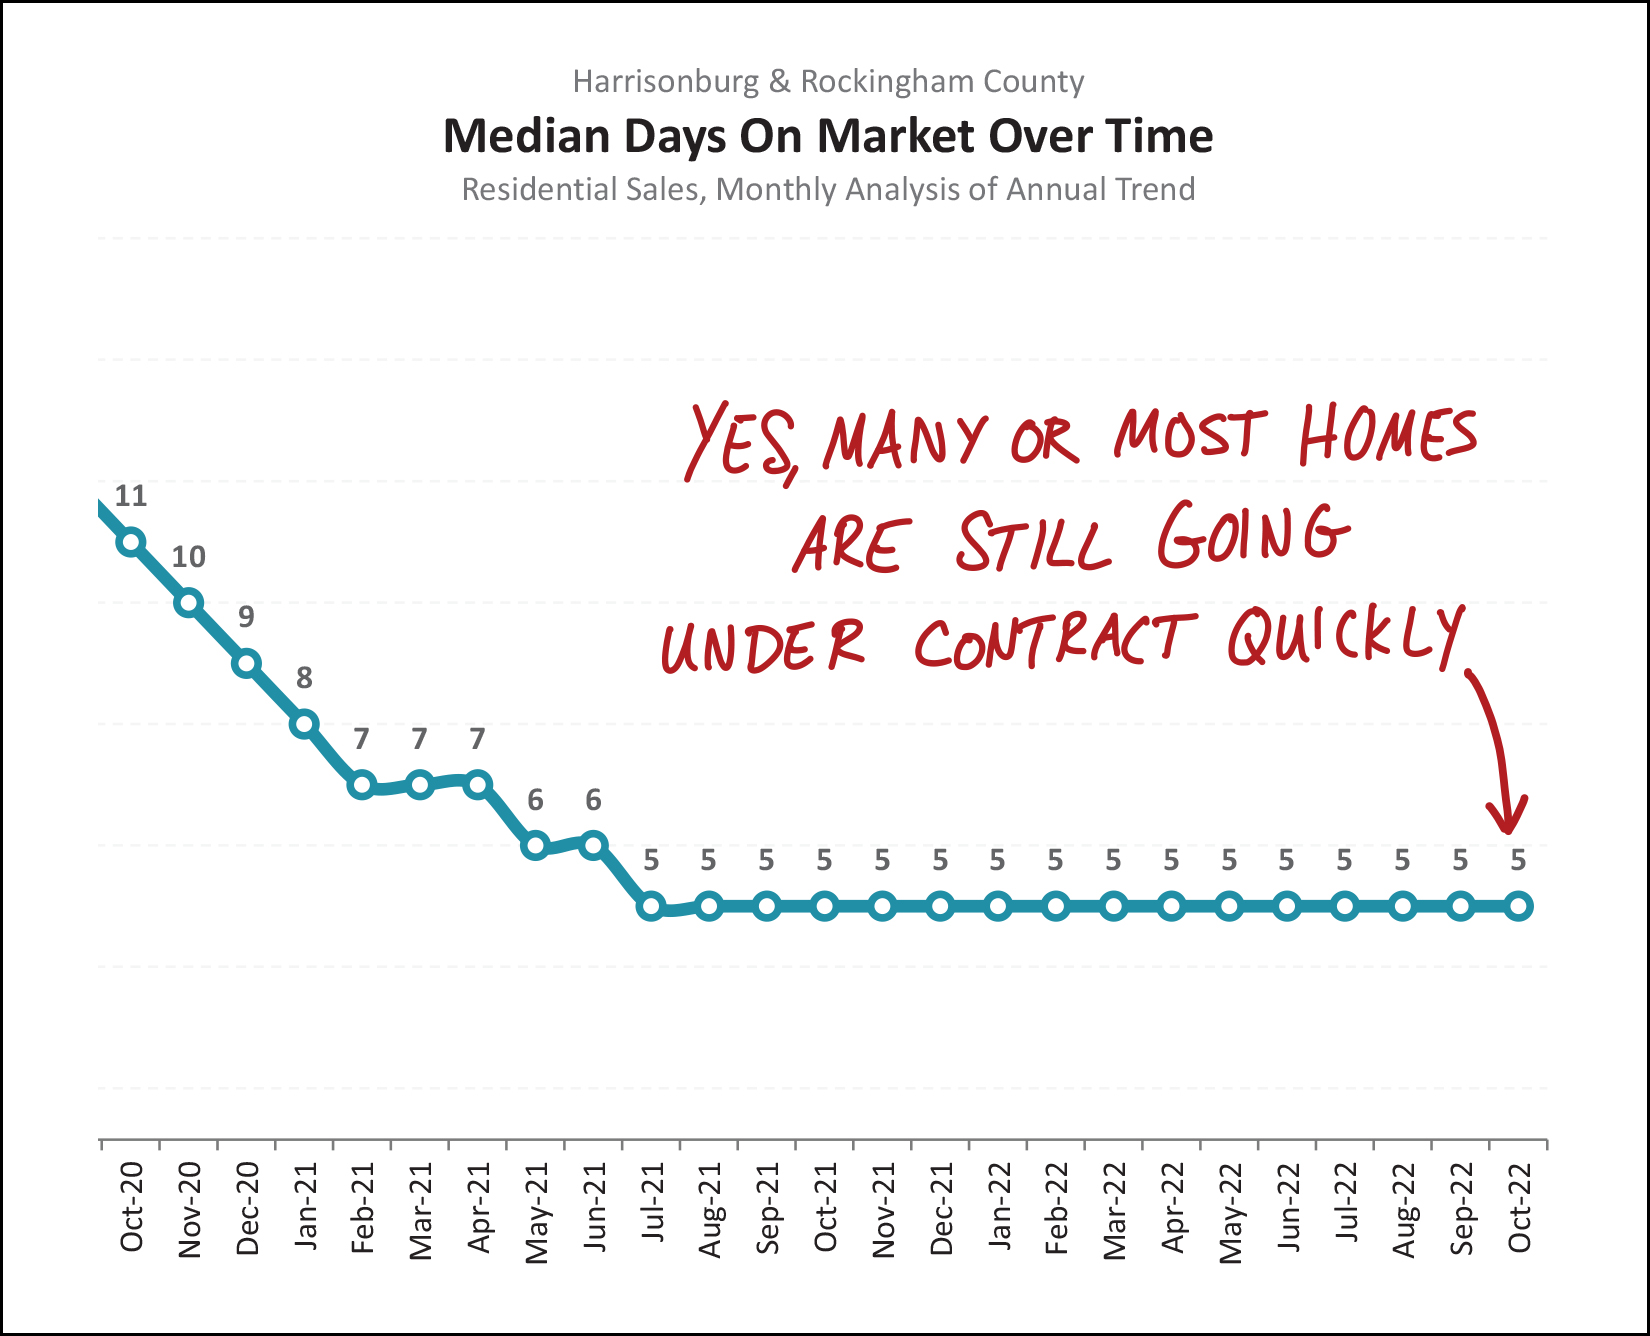 Ummmmm... nope! The "median days on market" metric continues to hover at five days on the market. Homes are still going under contract very quickly. To be clear, this data point above is looking at home sales over the past 12 months to arrive at this "five days" metric. You might then wonder if we would start to see higher "days on market" results if we looked only at the past six months, or three months or one month. Let's take a look... Median Days On Market Past 12 Months = 5 days Past 6 Months = 5 days Past 3 Months = 6 days Past Month = 6 days So, yes, it's taking... one extra day for homes to go under contract. ;-) Now, for our monthly opportunity to point the finger of blame... 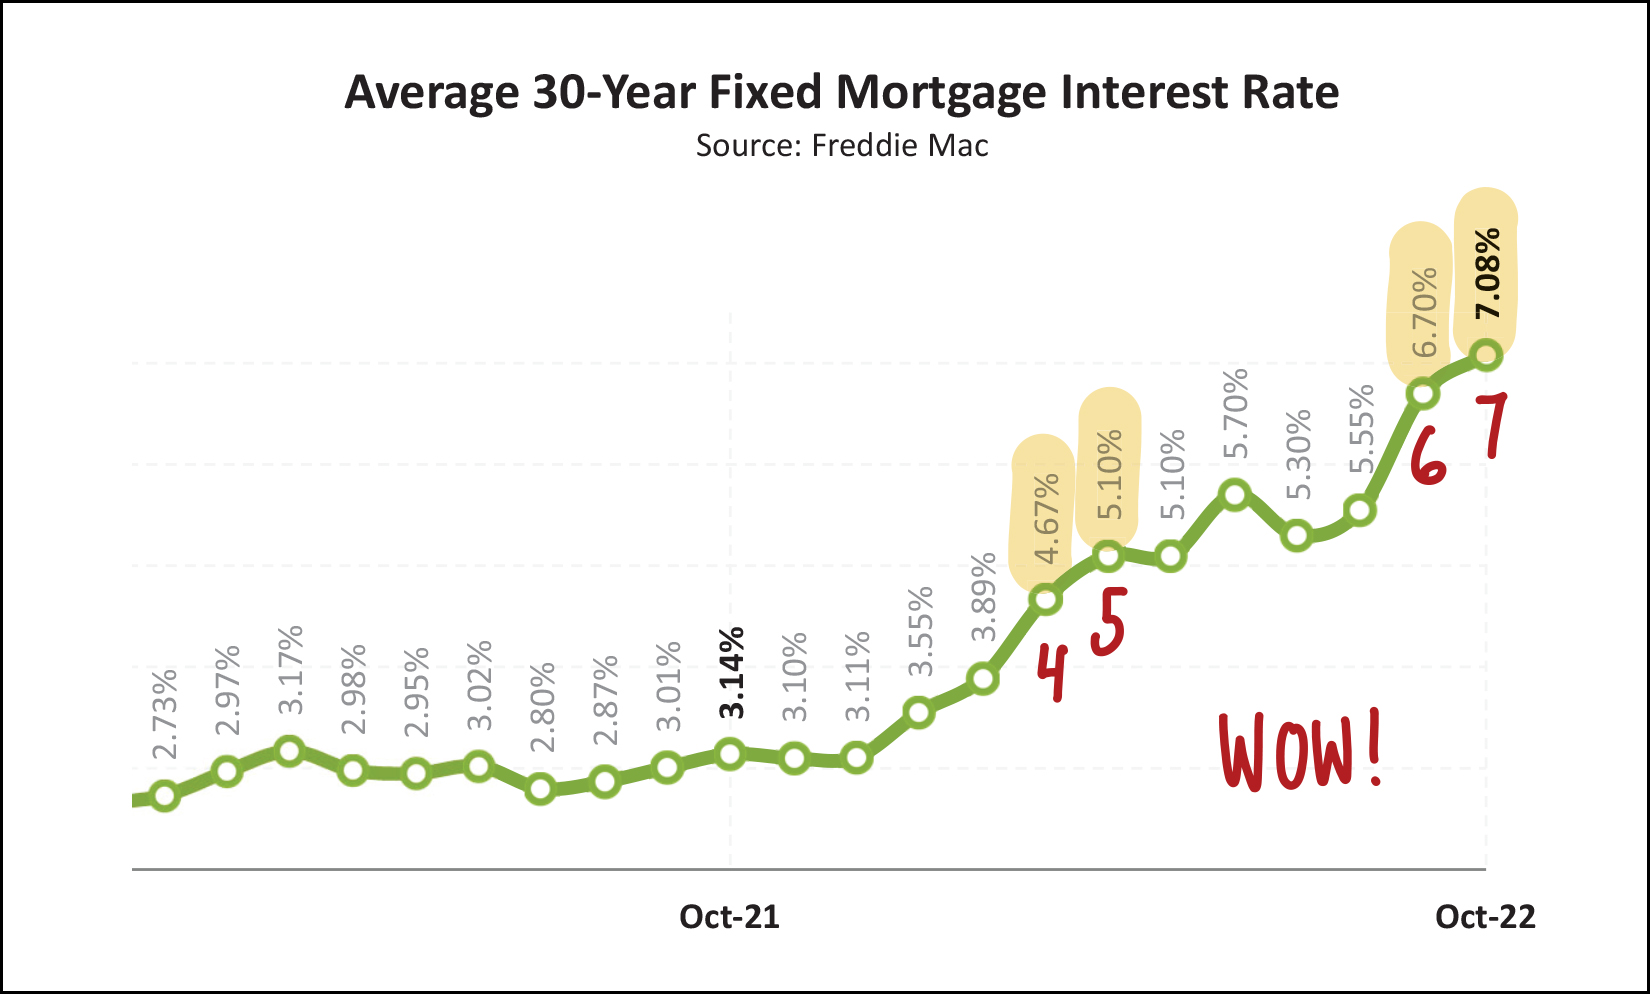 Why oh why are home sales slowing down? Why is contract activity slowing down? What in the world could be causing these changes? ;-) Well, could it be higher mortgage interest rates? We started the year with interest rates below 4% and then proceeded to fly past 4%, 5%, 6% and now 7%. Home buyers will keep on buying as prices rise 10% (or more) per year when mortgage interest rates are between 2% and 4%... but when mortgage interest rates get to 6% or 7% that can start to impact buyer decision making... either because they can no longer afford the monthly mortgage payment... or because they don't want the higher monthly mortgage payment associated with current mortgage interest rates. Just as a bit of context (that is sure to make me sound old) back when Shaena and I bought our first home (a townhouse in Beacon Hill in 2003) our mortgage interest rate was... 6.25%. So, these mortgage interest rates of 6% or 7% aren't absolutely crazy from a long-term context, but after experiencing abnormally low mortgage interest rates for years, and years, and years... a 6% or 7% rate certainly sounds and feels high! Now then, where does all of this leave us? Lots of homes are still selling... rather quickly... at higher prices than ever before... but buyer activity is slowing a bit... at least partially related to high mortgage interest rates. Thus, my advice is as follows, depending on where you fit into our local market... SELLERS - Consider selling sooner rather than later in case mortgage interest rates keep climbing, or in case prices start to level out. BUYERS - Consult with an experienced lender to understand your best mortgage options to make sure you are buying at a reasonable and comfortable price point. HOMEOWNERS - Enjoy your (likely) low mortgage interest rate, and your still-increasing home value. If you're considering buying or selling yet this year... or in early 2023... let's chat sooner rather than later to formulate a game plan. The first step? Email me or text/call me at 540-578-0102. I'll provide another market update next month, but between now and then I hope you have a wonderful Thanksgiving and that you are able to let those dear to you know how thankful you are that they are a part of your life. Happy Thanksgiving! Recent Articles:
| |
| Newer Post | home | Older Post |
Scott Rogers
Funkhouser Real
Estate Group
540-578-0102
scott@funkhousergroup.com
Licensed in the
Commonwealth of Virginia
Home Search
Housing Market Report
Harrisonburg Townhouses
Walk Through This Home
Investment Properties
Harrisonburg Foreclosures
Property Transfers
New Listings

