| Newer Post | home | Older Post |
Home Sales Slowed Considerably In Late 2022 But Home Prices Kept On Rising |
|
 Happy Thursday afternoon, friends! And... Happy New Year! It's hard to believe the New Year is upon us. Actually.. we're already more than halfway through January at this point. What a whirlwind. I hope you had a delightful finish to 2022. I capped off the year with a slightly warmer than anticipated New Years Eve Glow Run, another fantastic community running event put on by VA Momentum. Below is a photo just prior to the start of the race... after which it became progressively darker and our glow bracelets and necklaces were lighting up the hilly course at Heritage Oaks Golf Course...  Two other items of business before we get into the real estate data... First, take a few minutes to check out my featured home of the month... 3078 Preston Lake Blvd... This beautiful cottage home with a finished basement is located in the Preston Lake community with a clubhouse, pool, walking paths and playground, all just minutes from Sentara RMH, JMU, Merck and Coors! You can check out the house here or walk through it here. Finally, each month I offer a giveaway, of sorts, for readers of this market report, highlighting some of my favorite places, things or events in Harrisonburg. Recent highlights have included Grilled Cheese Mania, Walkabout Outfitter and Bella Gelato. And this month... This month it's back to music... I'm giving away a pair of tickets to see The Steel Wheels and Sierra Hull at JMU's Wilson Hall on February 11th! Read all about the event, and the artists, here - and if you're interested in a pair of free tickets, enter to win them here. :-) Now, onward to the latest data on our local housing market! First, how many homes have been selling lately... 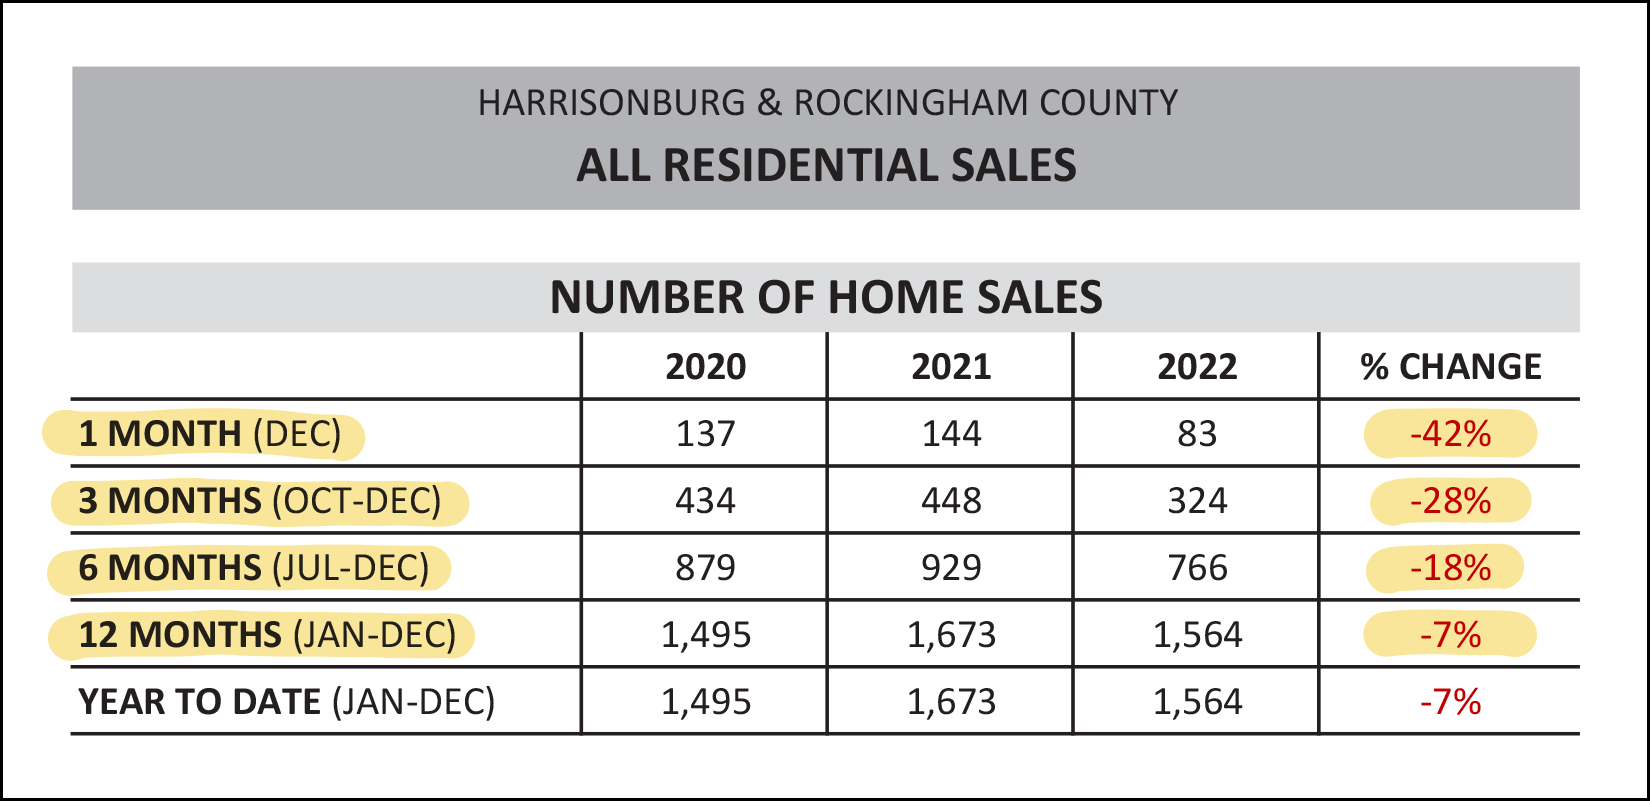 There's a lot to note in the graph above, and some of these numbers informed the headline for this article... [1] There were only 83 home sales in December 2022... compared to 144 in December 2021. That's a rather surprising 42% decline in home sales for the month of December. [2] When we pile in a few more months (October and November) we see that there were 28% fewer home sales in the fourth quarter of 2022 than in the fourth quarter of 2021. [3] Finally, when looking at the full year of 2022... there were 7% fewer home sales than in 2021. After several years of rapidly increasing numbers of home sales, it seems that higher mortgage interest rates finally slowed down buyer activity... though not very significantly until the very end of 2022. But yet, despite slowing sales, home prices did what!? 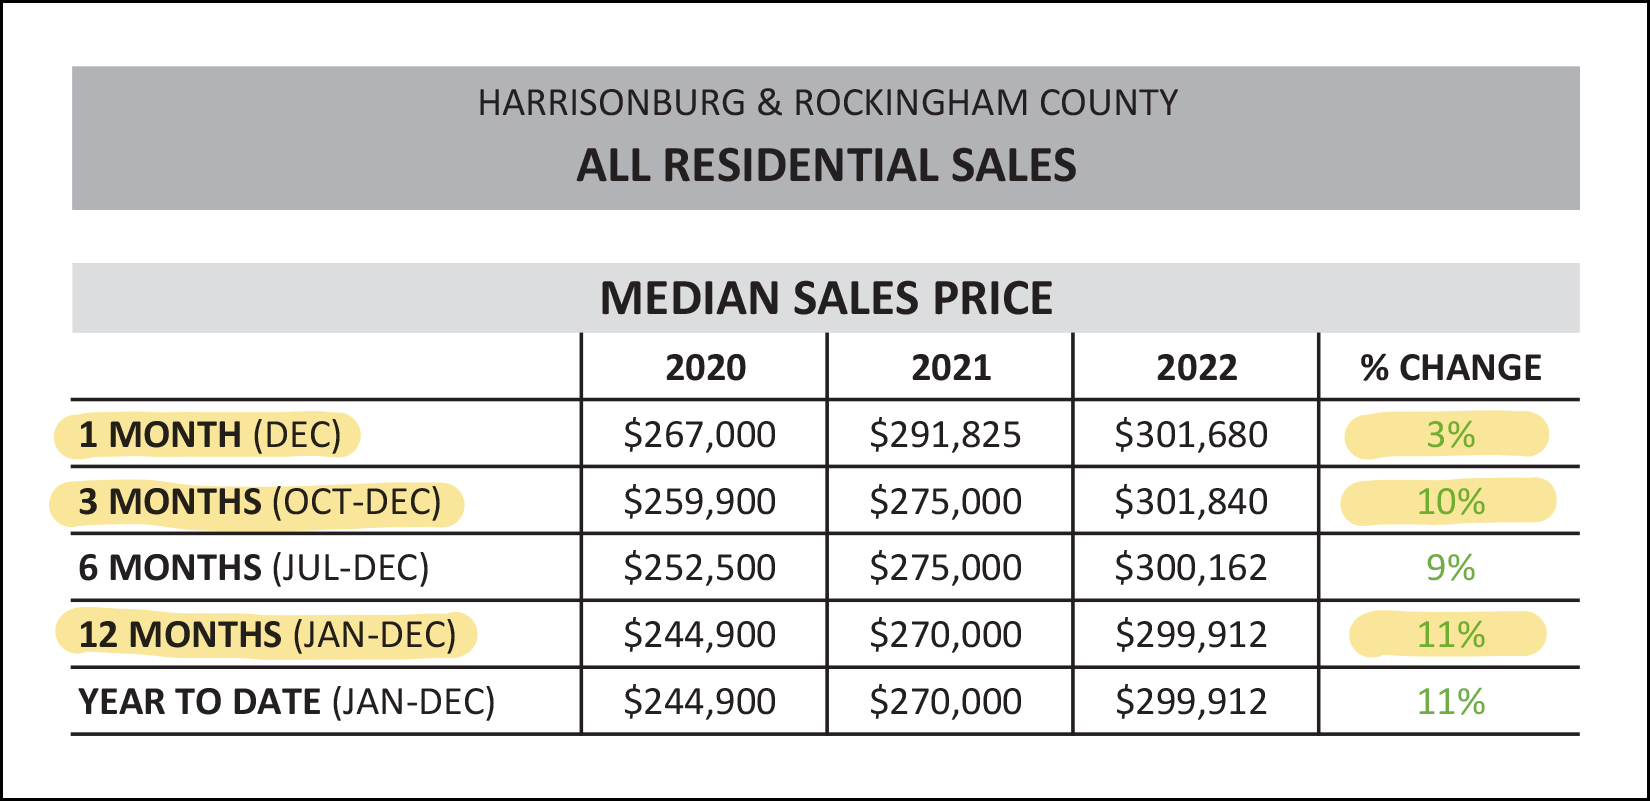 Home prices... kept on rising! [1] Starting from the bottom of the chart (above) this time we see that there was an 11% increase in the median sales price when comparing all of 2021 to all of 2022. That's a rather significant increase in the median sales price and it follows on after two preceding years of 10% increases in the median sales price. Needless to say, homes have become quite a bit more expensive over the past several years. [2] The median sales price in December 2022 was 3% higher than in December 2021. This could be an indication that we'll start to see a slow down in the rate at which home prices are increasing... or, as is more likely, it may be lower than the longer term trend (+11%) because it is a smaller data set of only the homes that sold in a single month. So... was it just December when we were seeing slowing home sales? 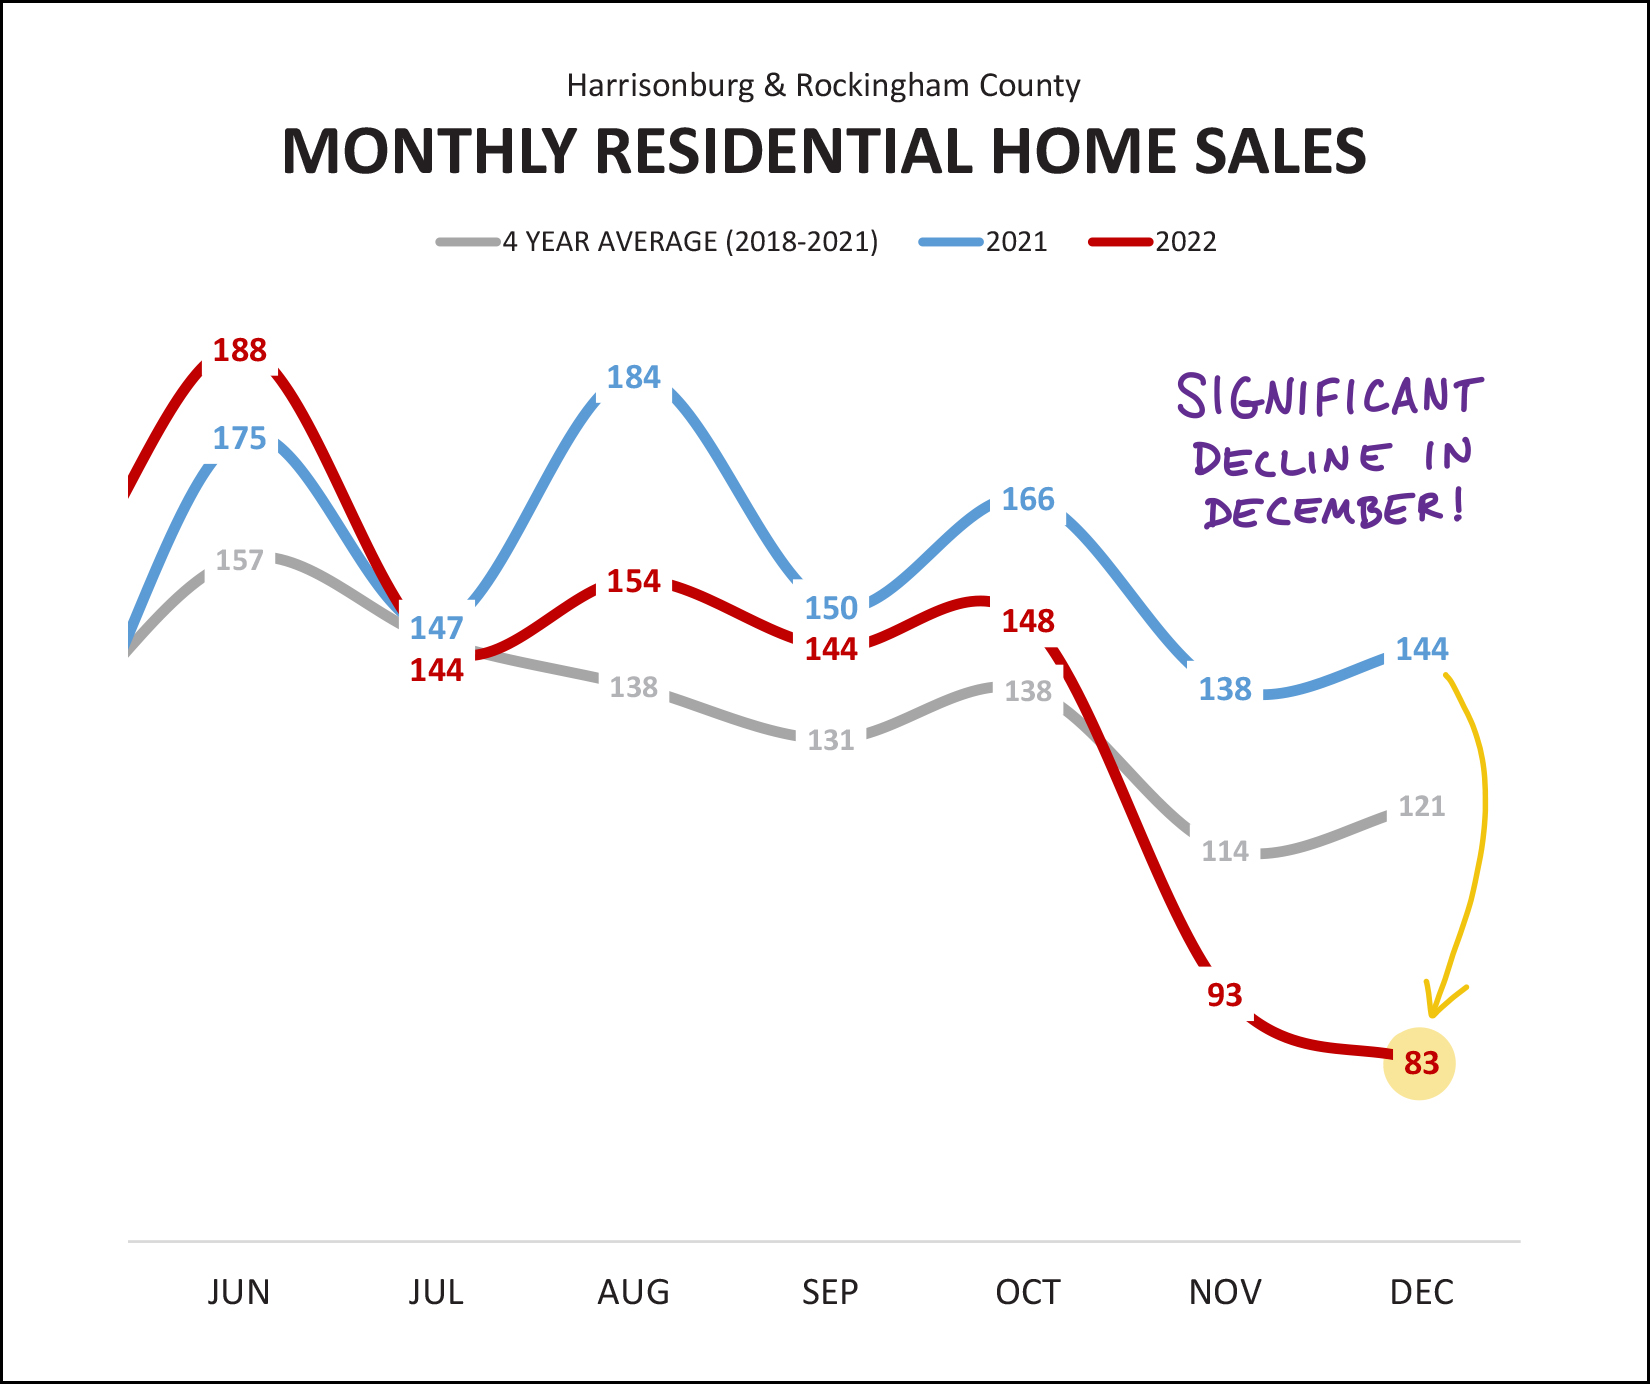 The decline in home sales was certainly significant in December... but if you track that red line (2022) back to November and compare it to the blue line (2021) you'll see that the slow down started before December rolled around. The graph above (and many of the graphs in this month's report) are in a slightly different format than in past months. I spent some time going through to revamp my monthly market analysis process to hopefully make the resulting graphs and analysis even more helpful and pertinent for all of us as we see how 2023 unfolds. As such, the graph above is showing the current (just finished) year of 2022 with a red line -- and the previous year of 2021 with a blue line -- and the grey line is showing a longer term trend calculated by averaging 2018 through 2021. Next up, let's look at monthly cumulative home sales... 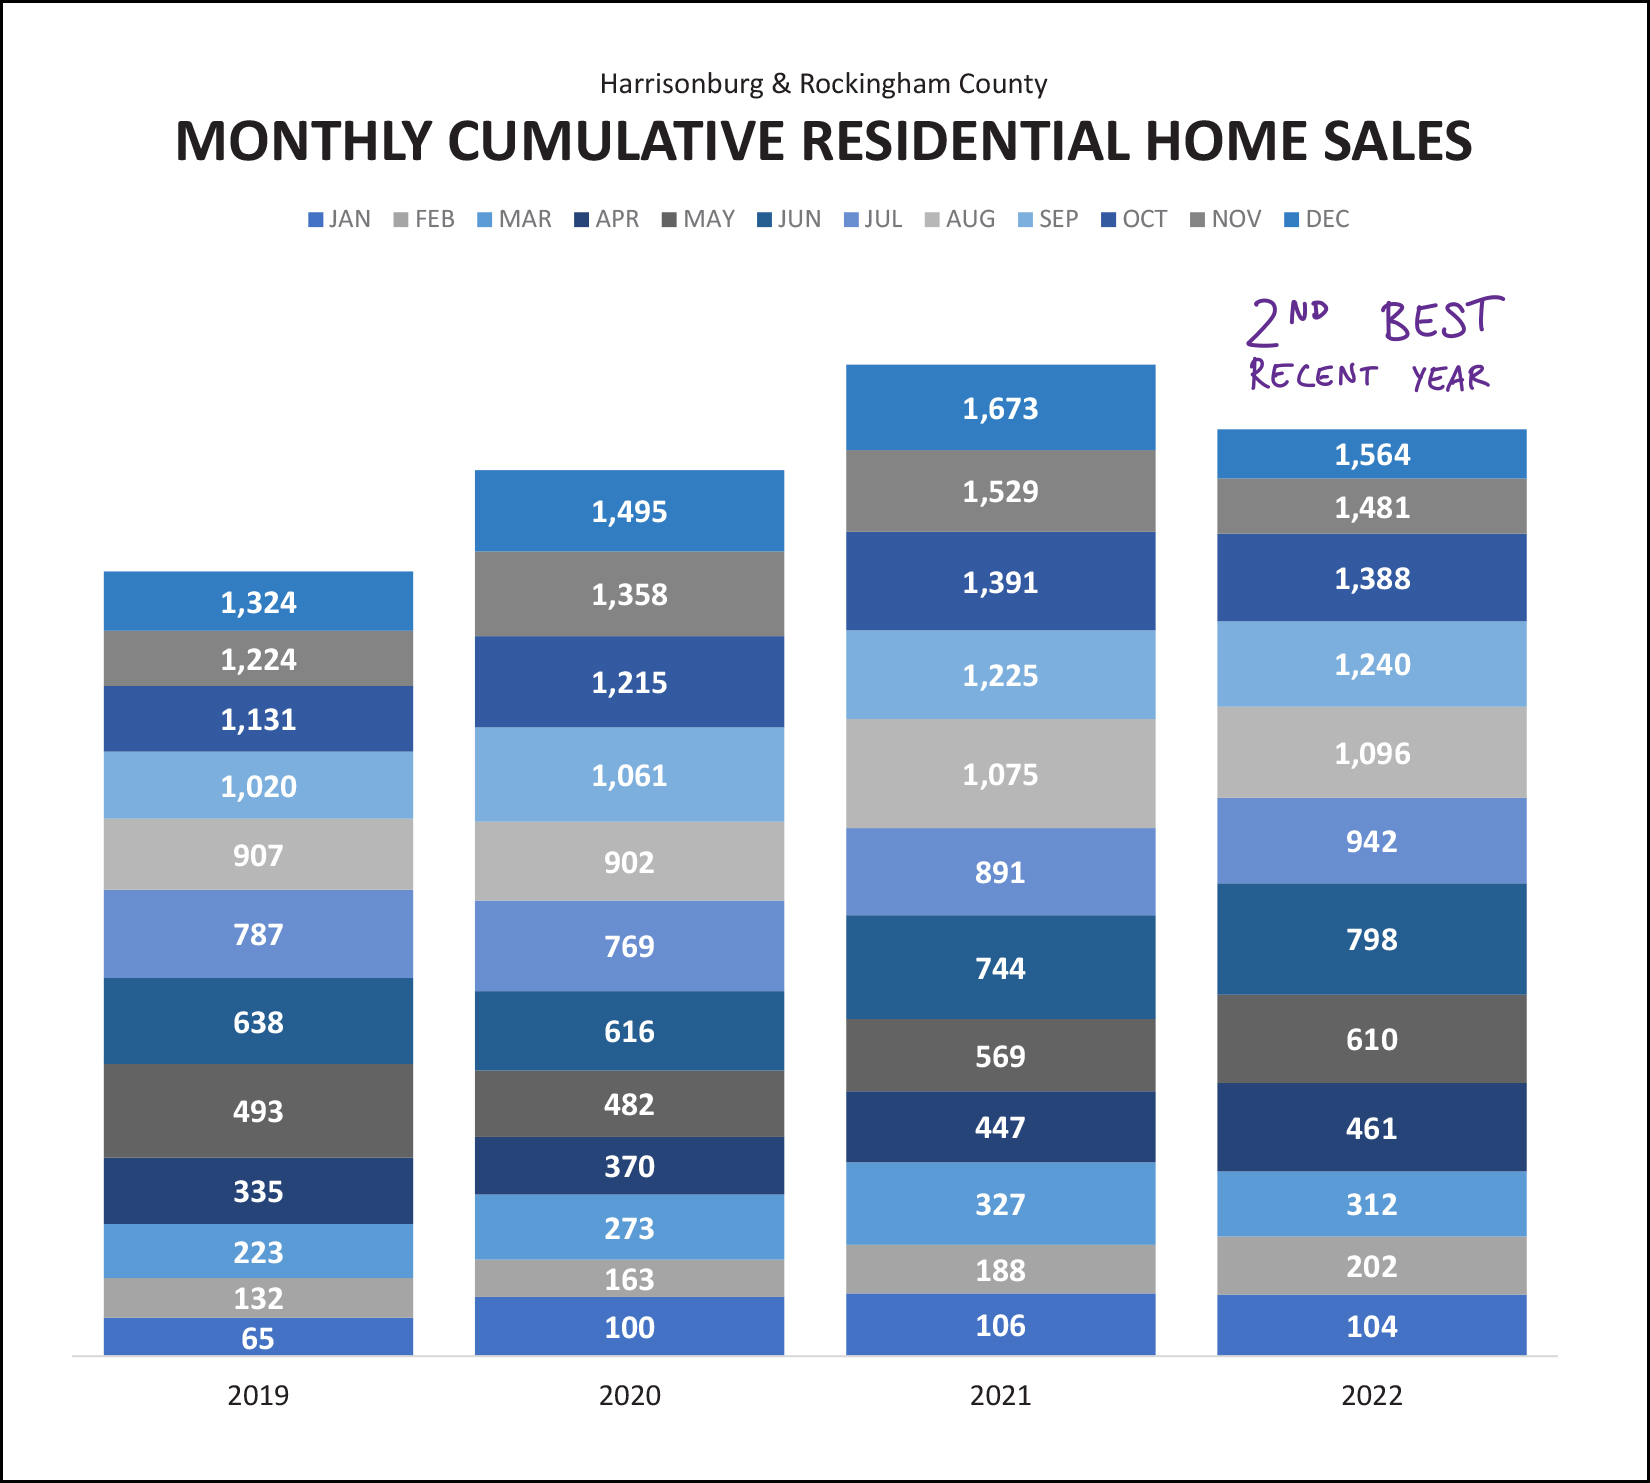 The graph above provides another illustration of the fact that 2022 was keeping pace with 2021 all the way through the end of October... and then November and December fell short. This resulted in the second strongest recent year of home sales in Harrisonburg and Rockingham County. Indeed... there were 7% fewer home sales in 2022 than in 2021... but there were well more than in 2019 and 2020! Next, let's look at general long term trends over the past few years... 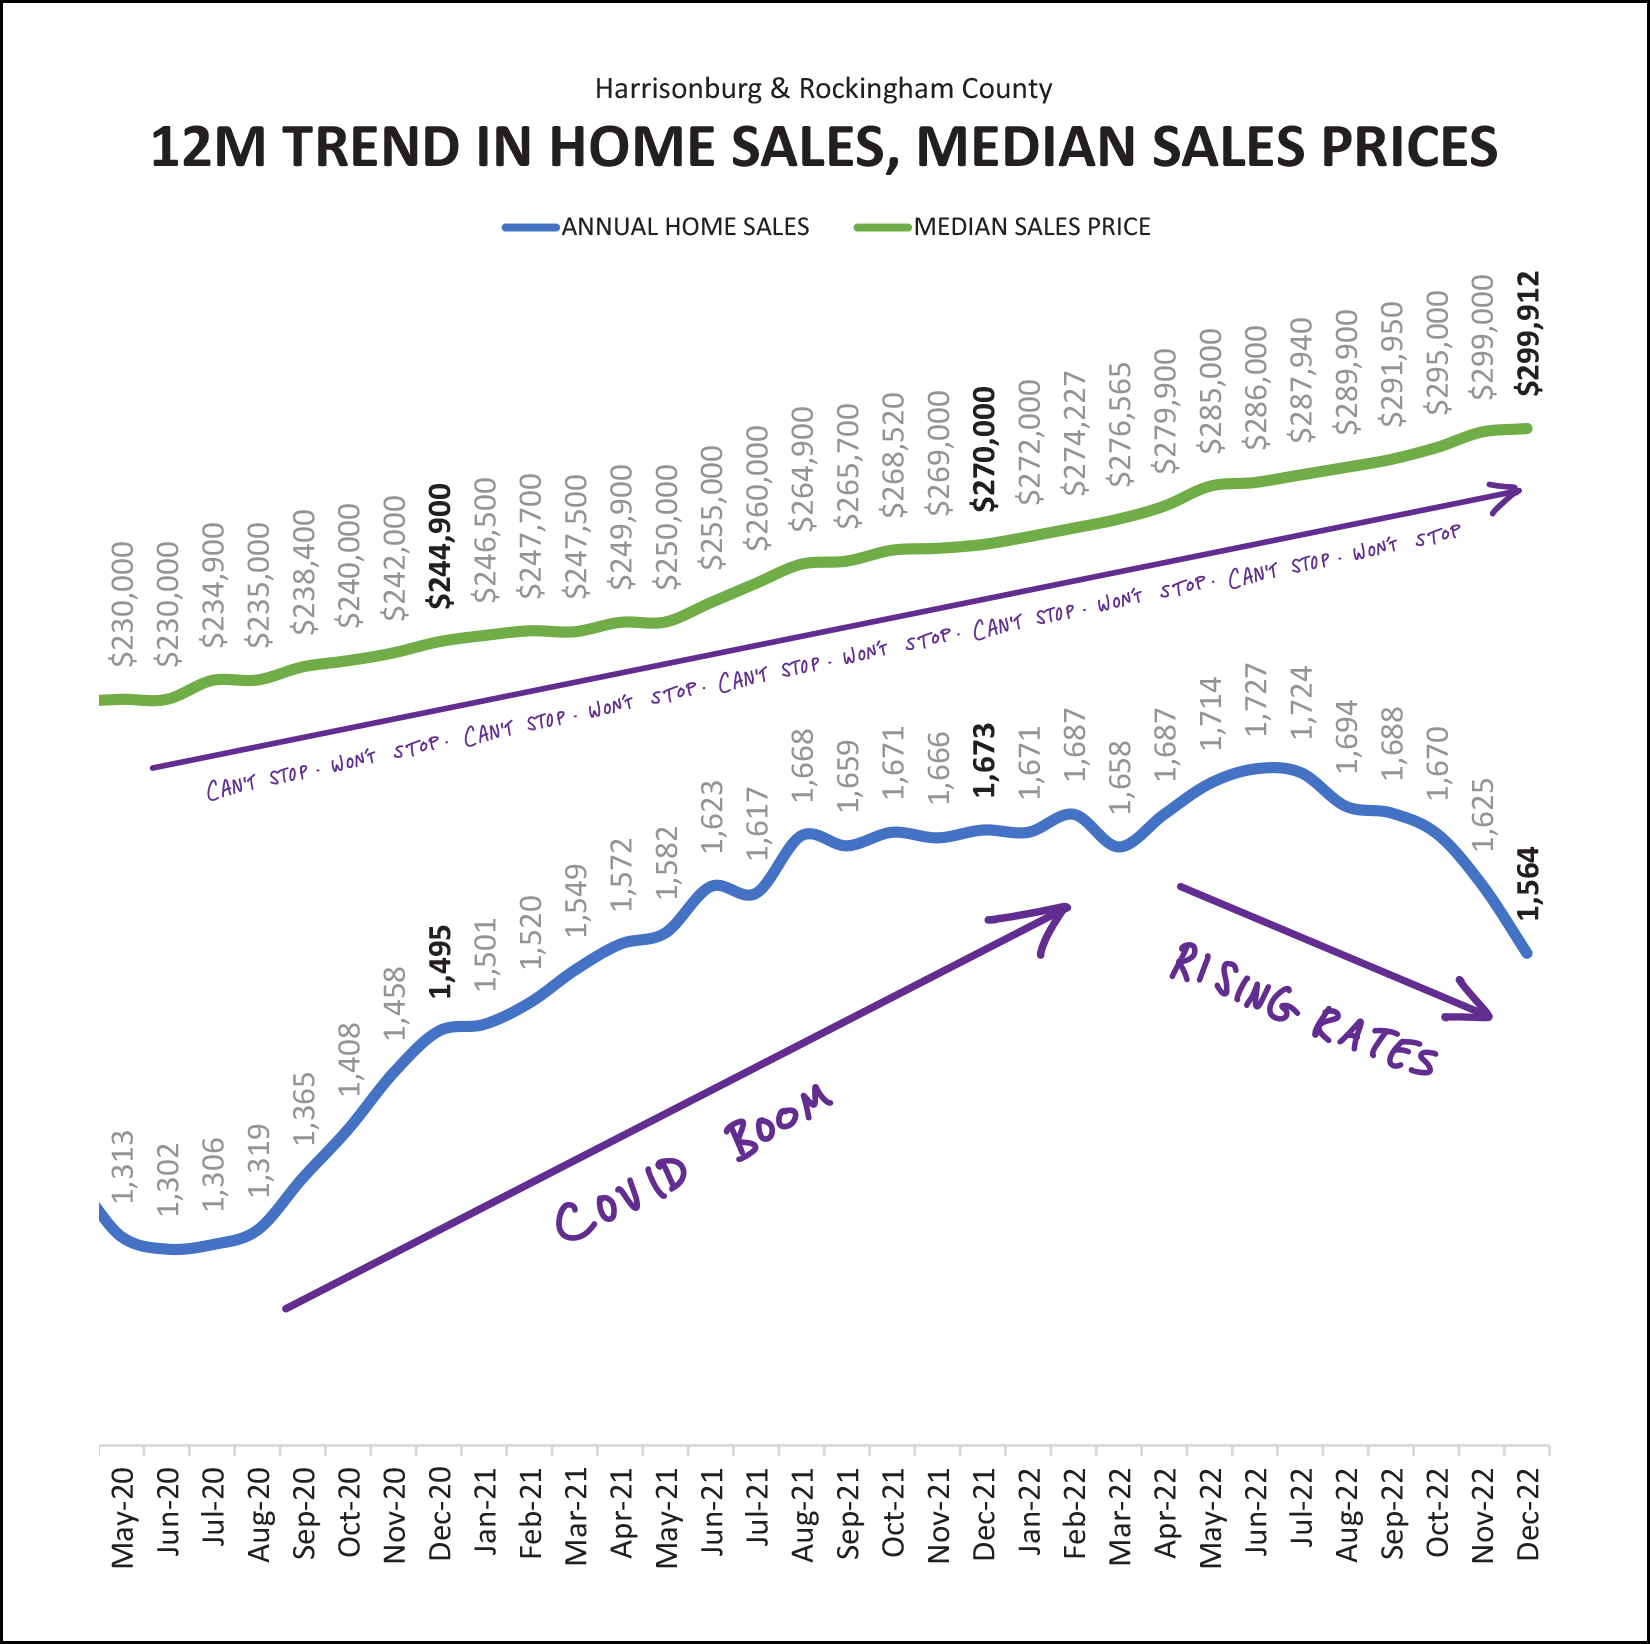 The top green line is showing the median sales price of all homes selling in Harrisonburg and Rockingham County... measured monthly by looking at the median of the previous 12 months. In tiny letters underneath someone (ok, me) wrote "can't stop, won't stop, can't stop, won't stop" -- but, I should definitely, definitely clarify that -- yes -- the median sales price could stop increasing. It didn't do so anytime in the past three (plus) years as illustrated above, but as they say, past performance is not a guarantee of future results. The bottom blue line (above) is a monthly check-in on the annual pace of home sales. During Covid the annual rate of home sales in our area shot up from around 1,300 sales per year all the way up to 1,700 sales per year... but as mortgage interest rates rose during 2022, eventually the annual pace of home sales started to decline again. Where did we finish out 2022, you might ask, within the context of the past few years? 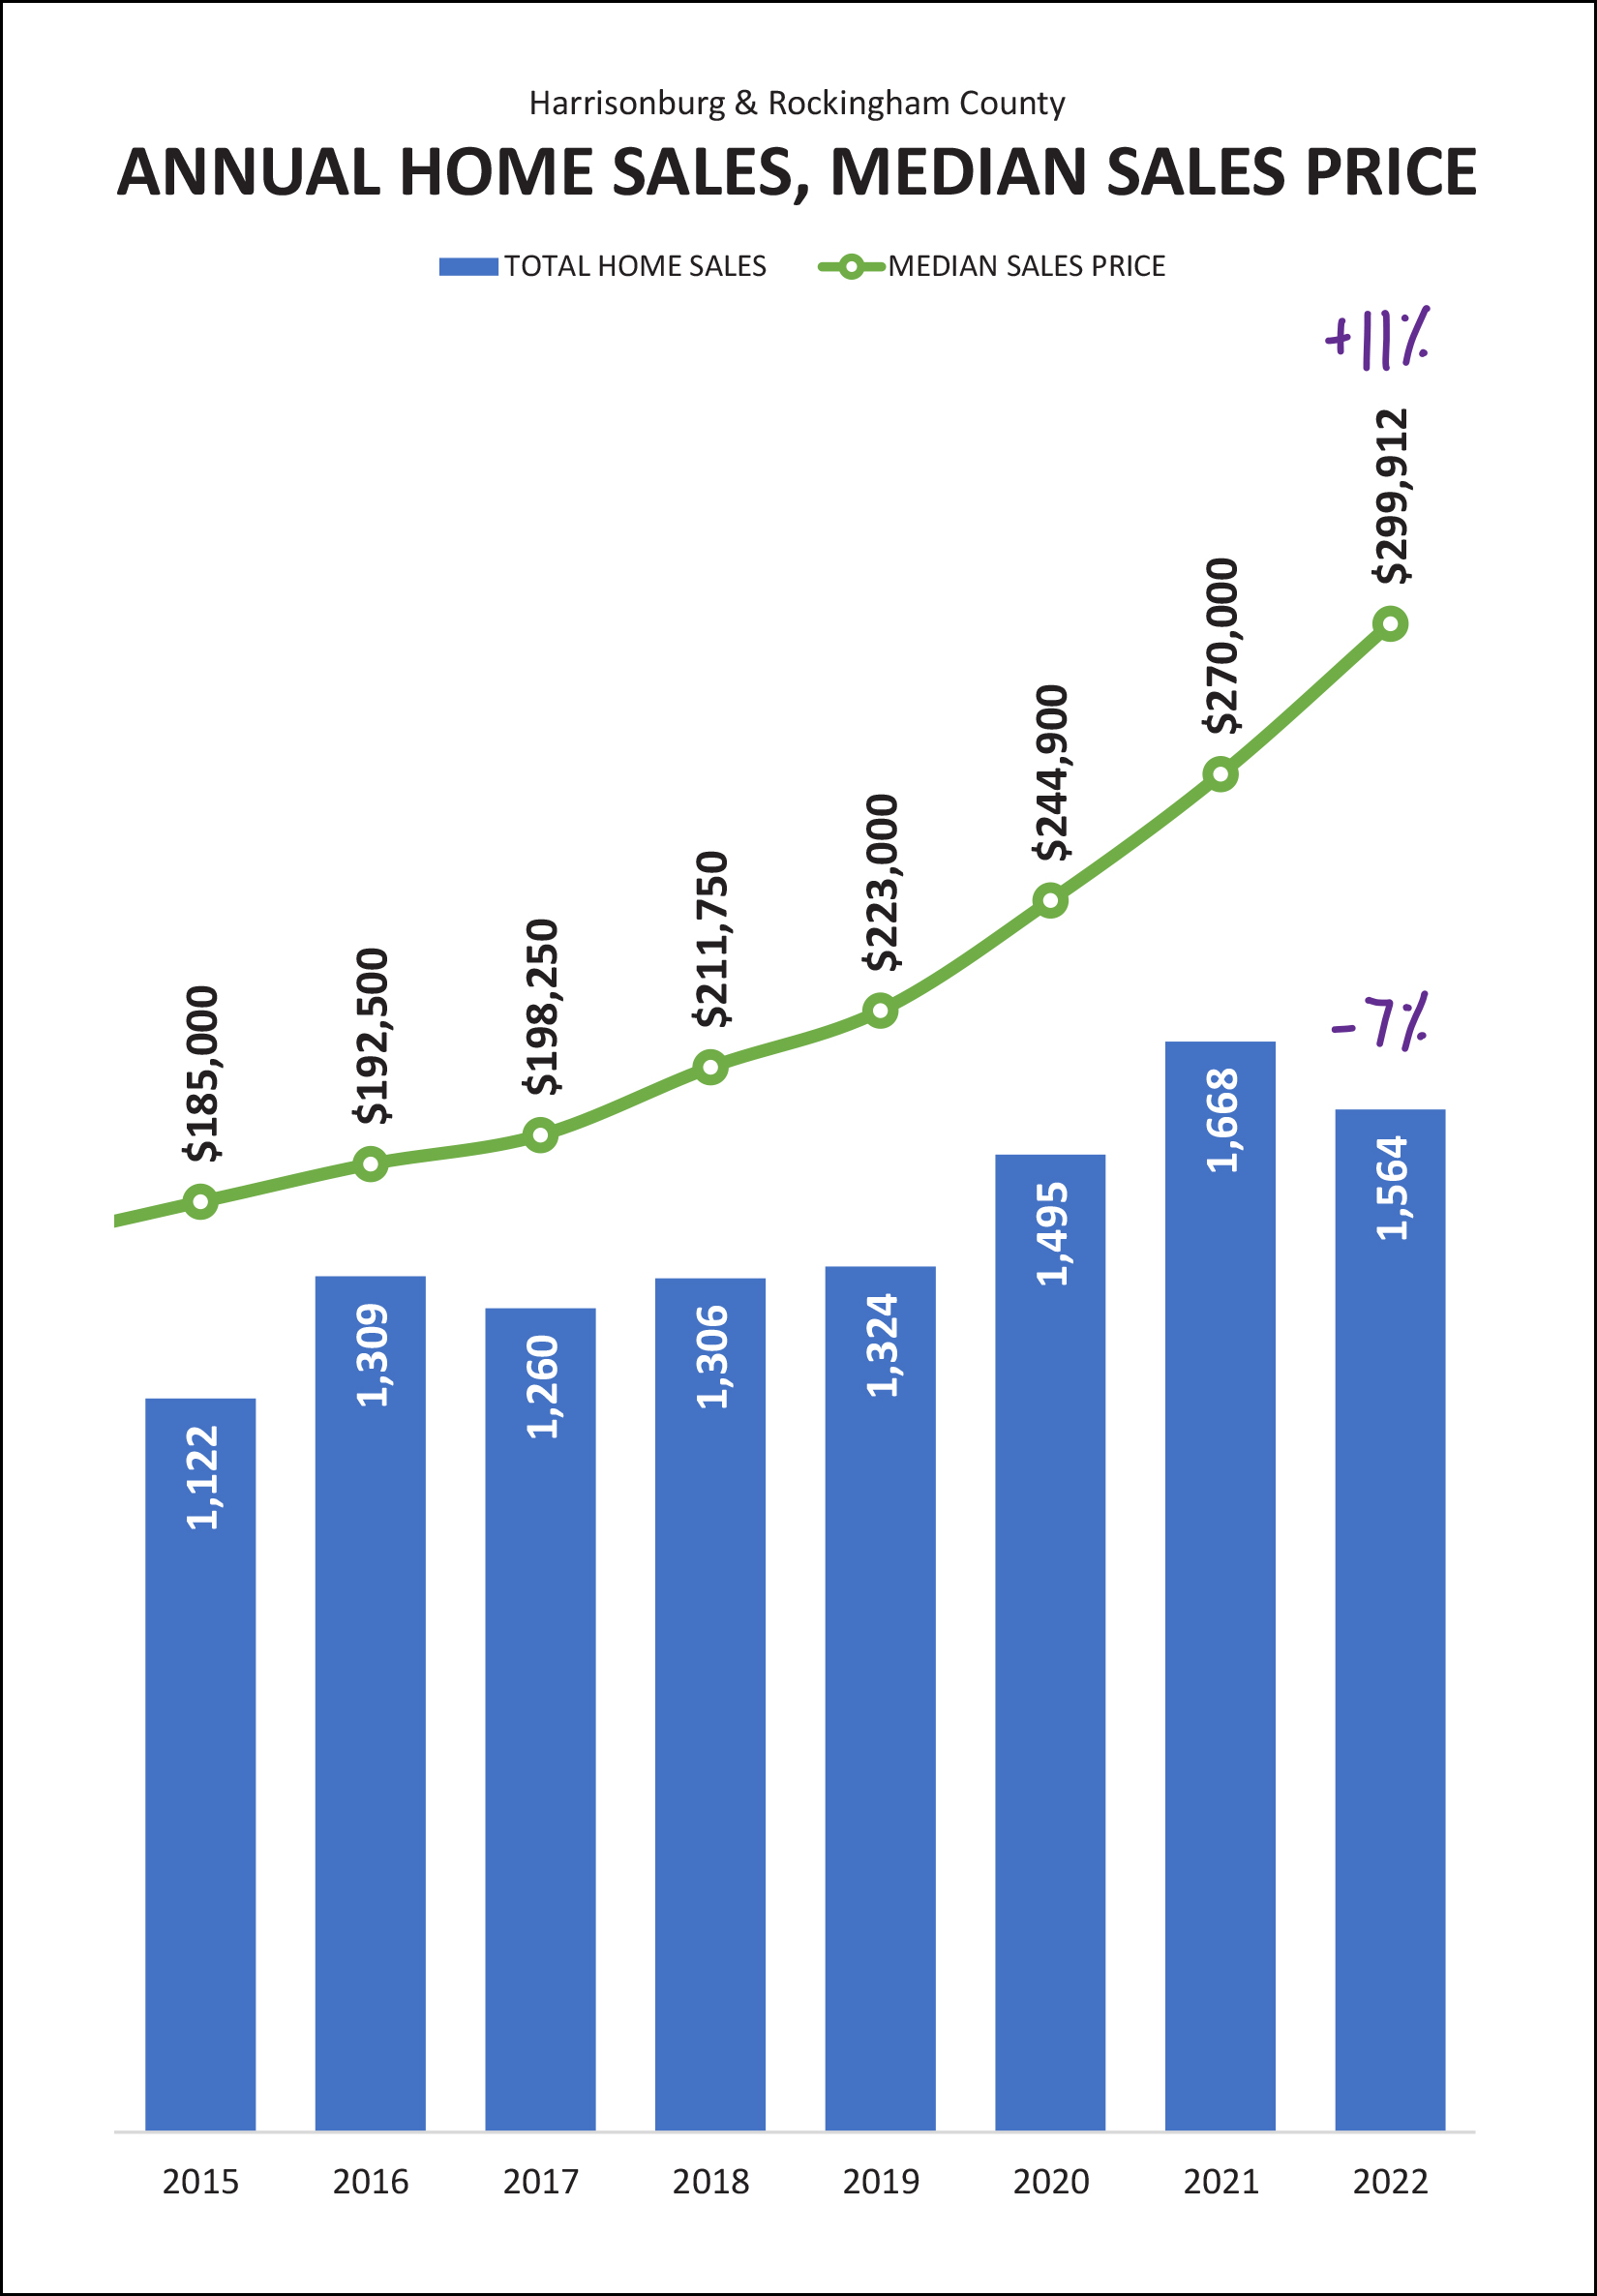 We ended up seeing 7% fewer home sales in 2022 than in 2021 -- though there were 5% more home sales in 2022 than in 2020. So, again, this past year was the second best year of home sales in recent times. You can see again here (in the graph above) that the median sales price has been aggressively climbing for multiple years. Five years ago (in 2017) the median sales price was $198,250... and it closed out 2022 just shy of $300K with a median of $299,912. This marks an 11% increase in the median sales price in 2022 after a 10% increase in both 2020 and 2021. Wow! This next one might surprise you. It surprised me, at least for a moment... 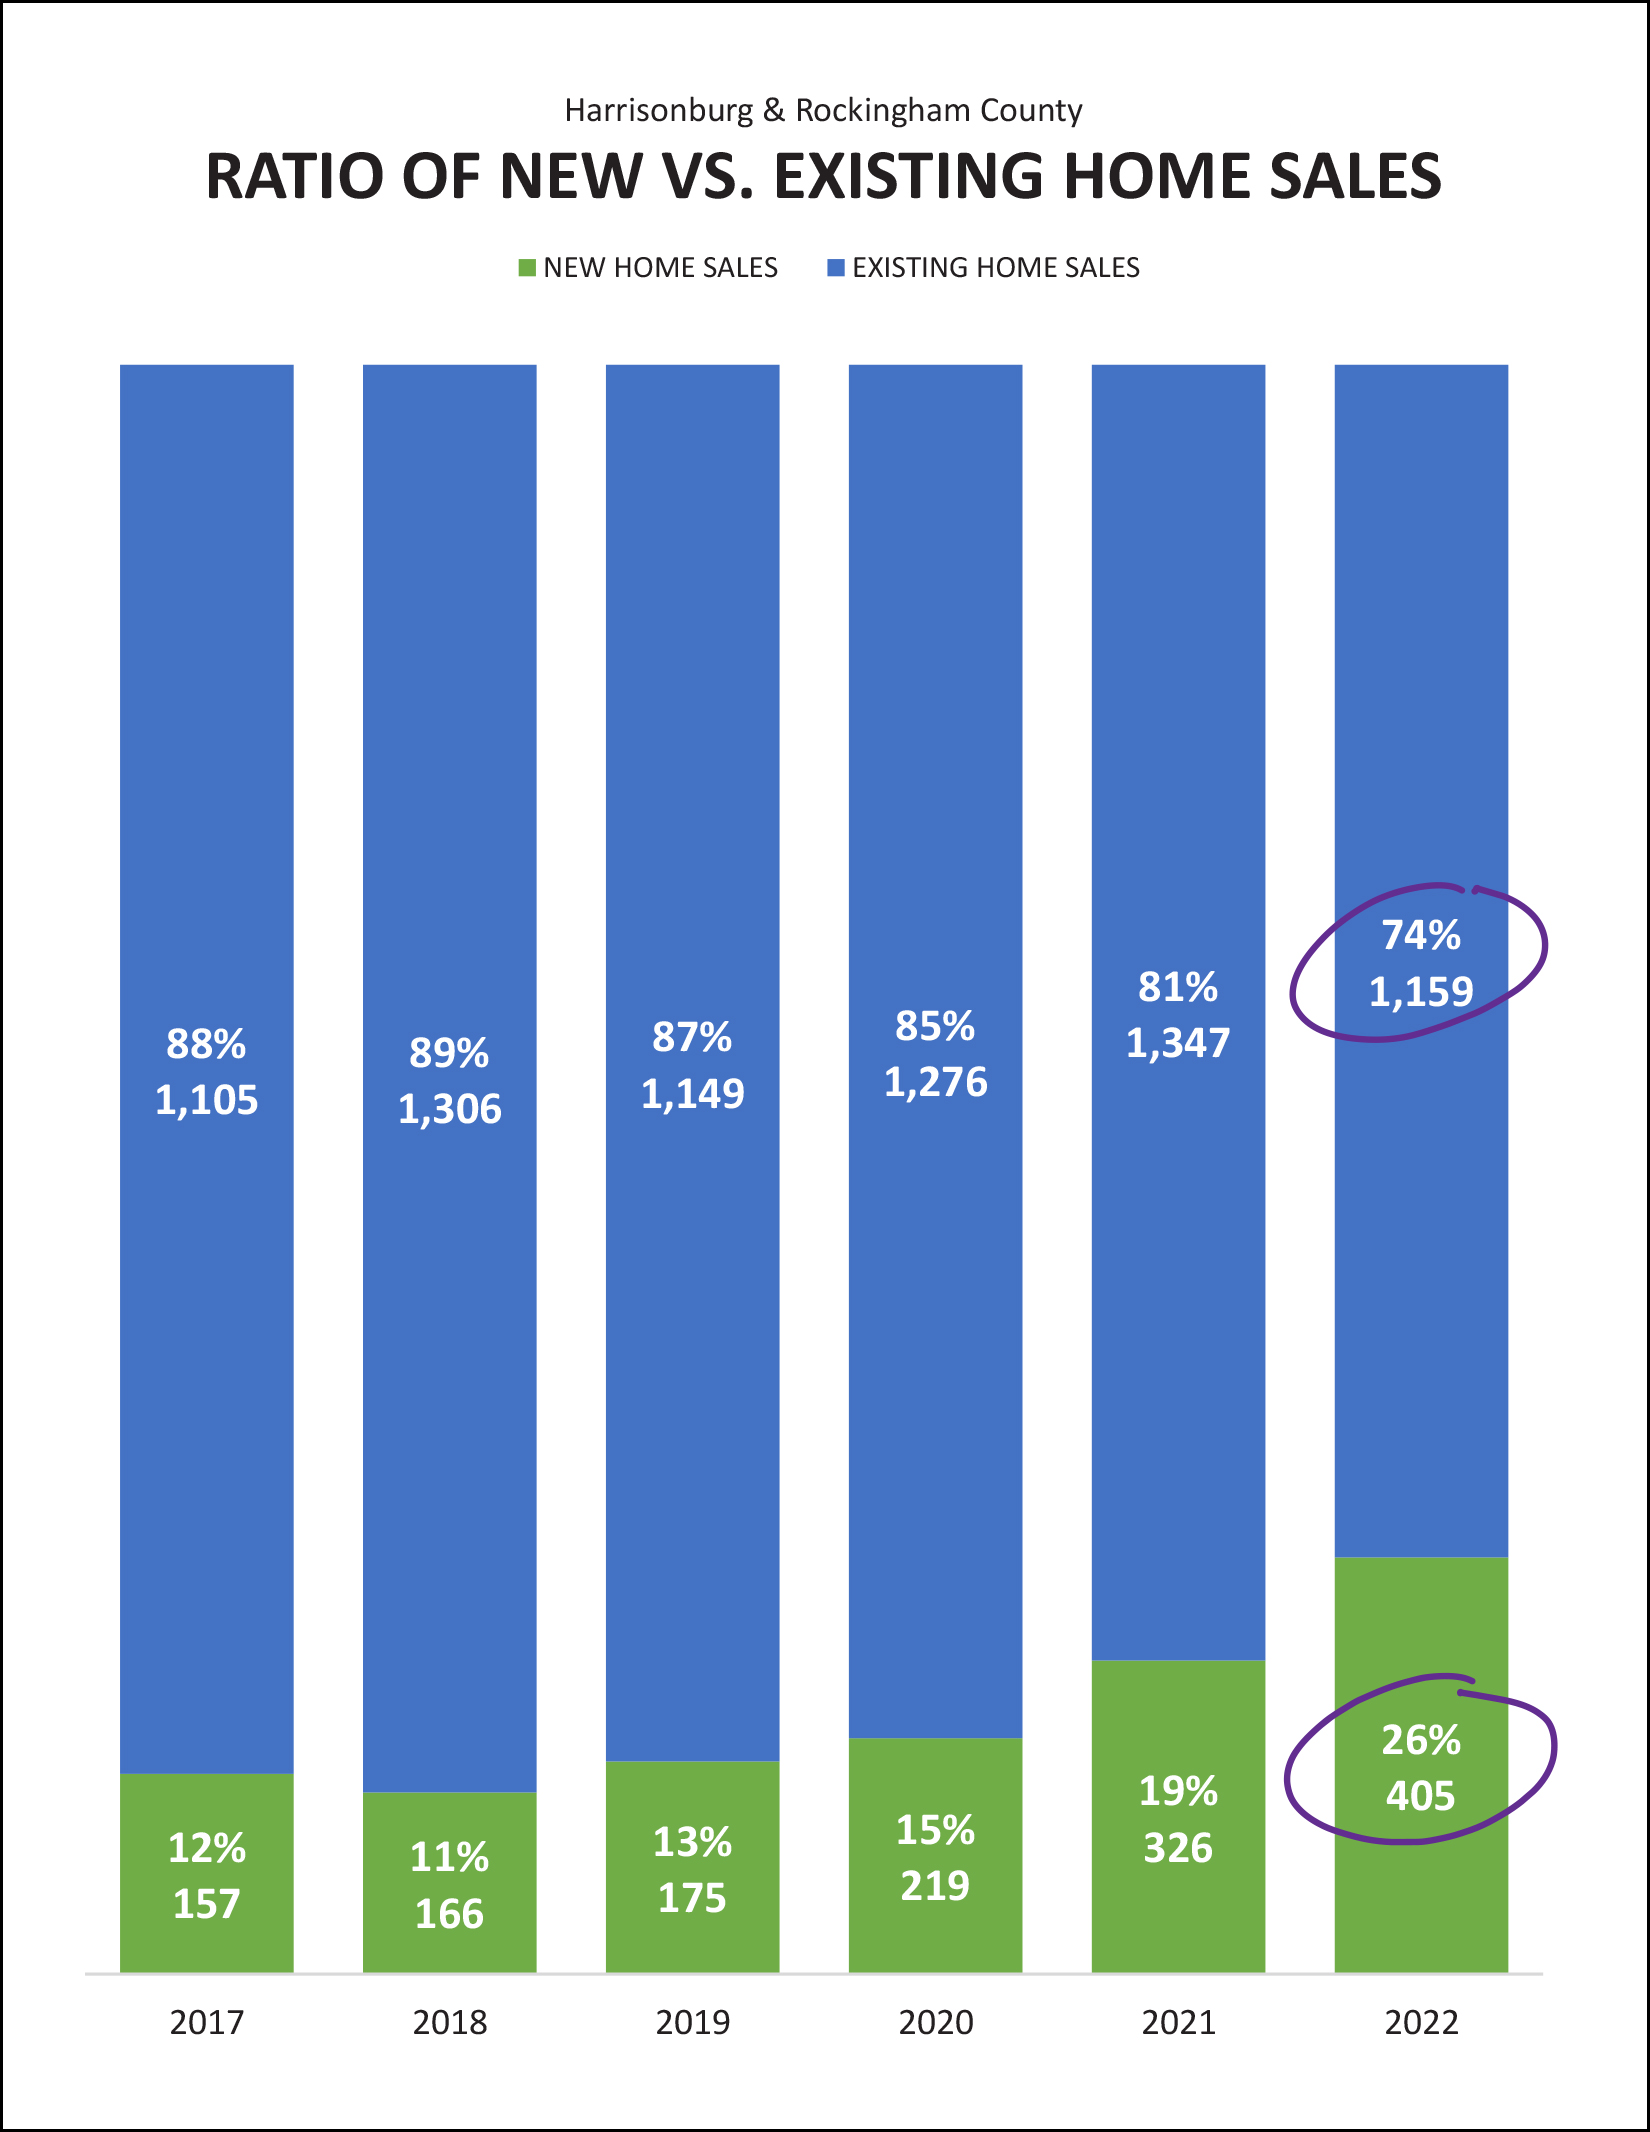 The 7% decline in home sales in 2021 was actually a much larger decline if we focus in on resale homes. There was actually a 14% decline in resale homes during 2022! We only ended up seeing a 7% decline in overall market activity because of the sale of new homes. We saw a 24% increase in new home sales in 2022. As a result (and as circled above) the balance between new home sales and existing home sales continues to shift with over a quarter of all home sales (26%) being new homes in 2022. I think there is a decent chance this ratio will be similar in 2023, or that we might see even more new home sales as plenty of homeowners will sit tight and enjoy their super low mortgage interest rate rather than selling their home. What comes next, I wonder... 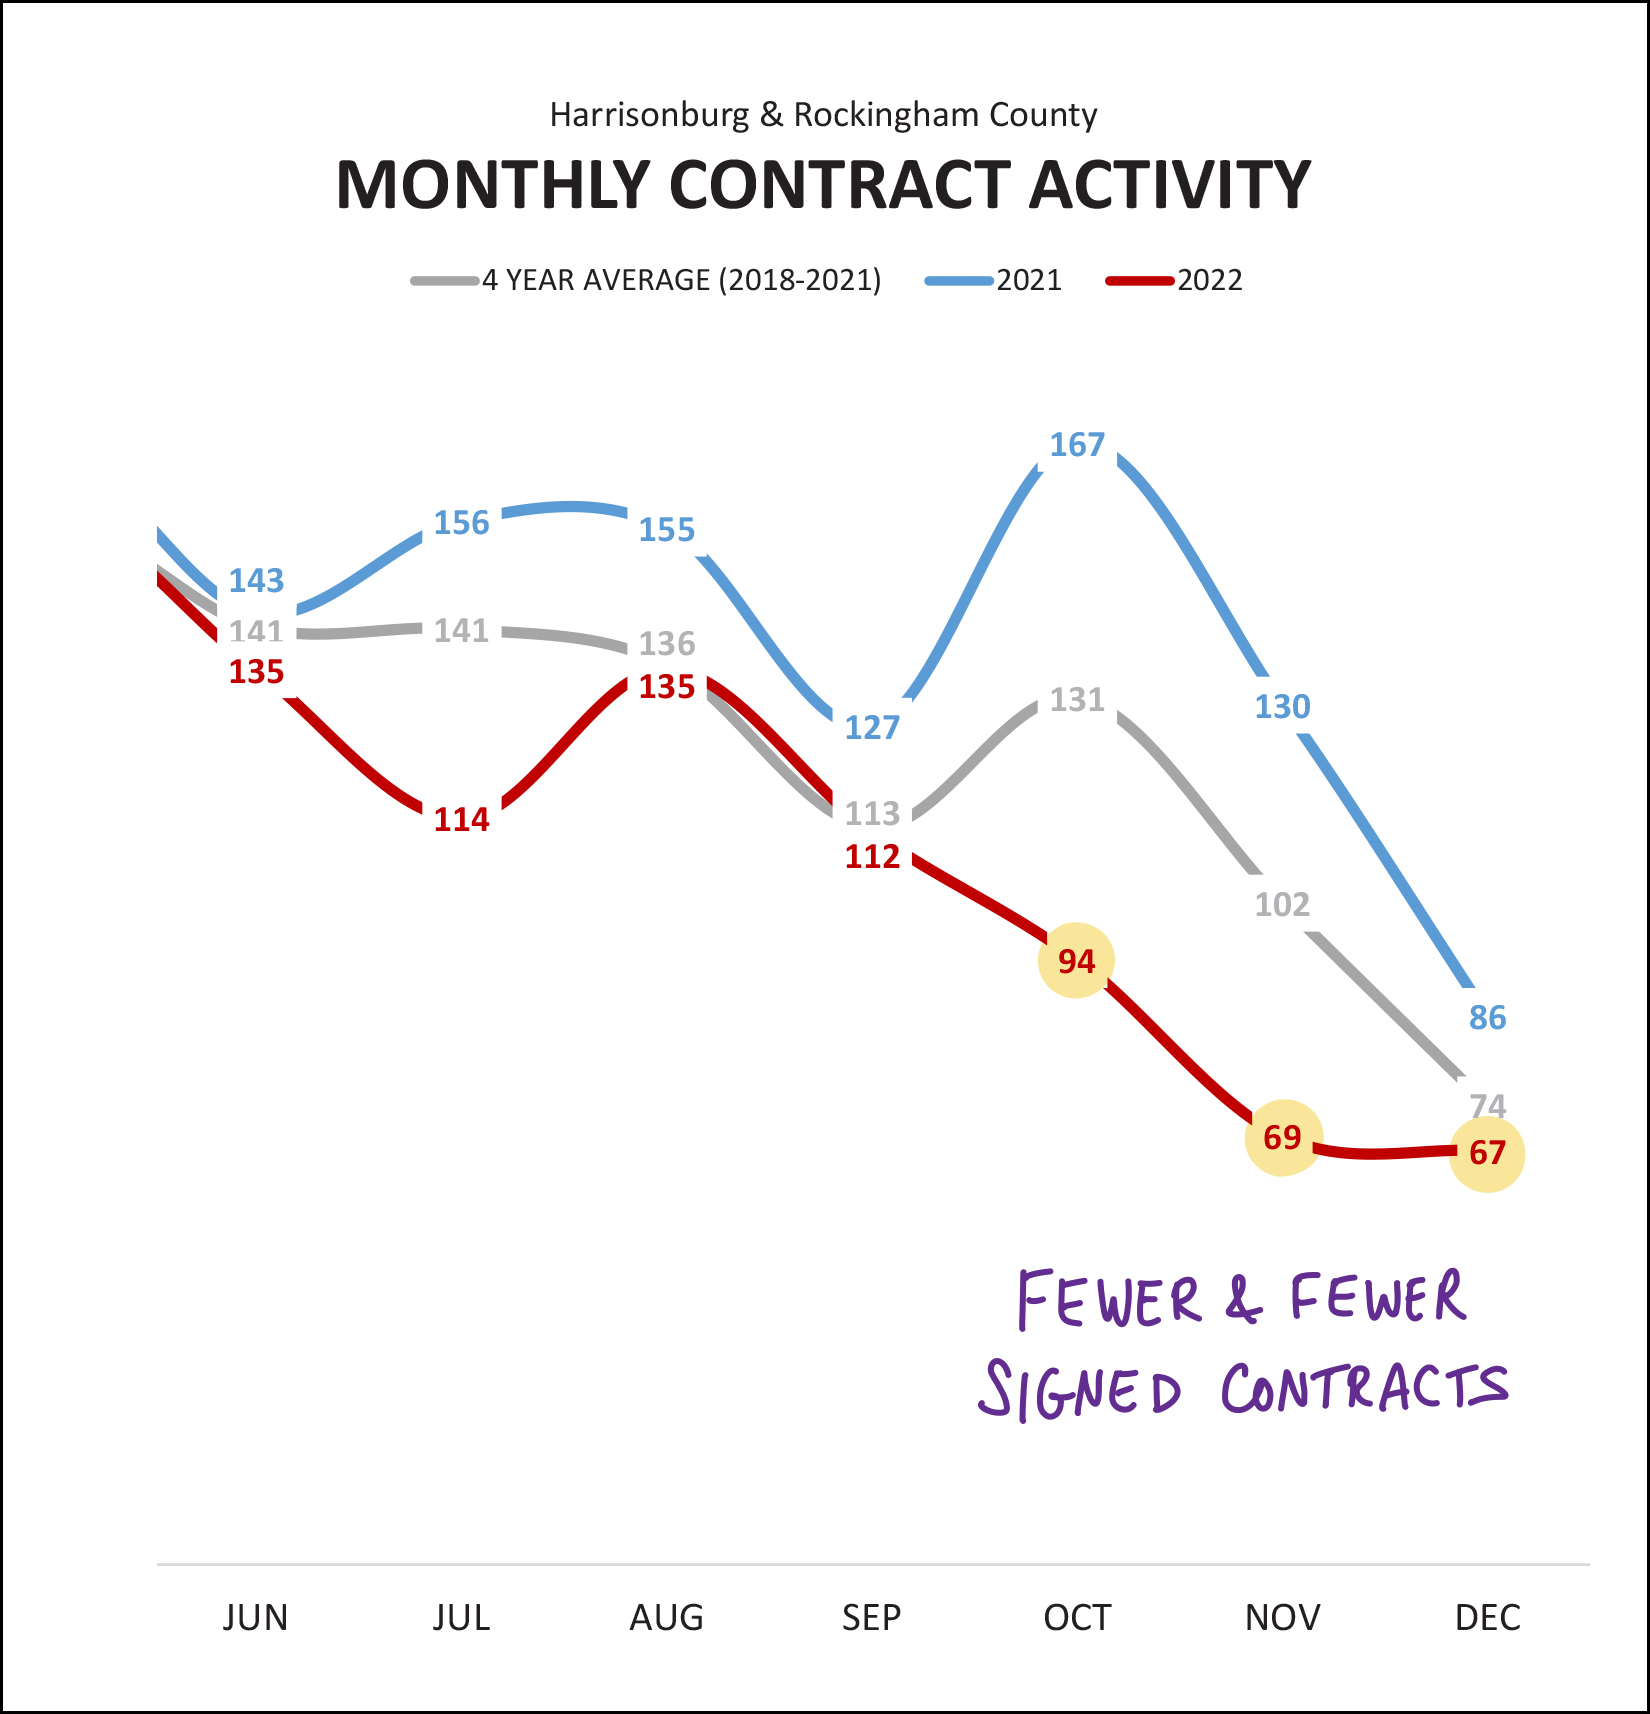 The graph above tracks how many contracts are signed (by buyers and sellers) each month... and here you can see that the slow down actually started halfway through 2022. Each month of contract activity in the second half of 2022 (red line above) was lower than the corresponding month in the second half of 2021 (blue line above) though the gap became much more pronounced in the last three months of the year. Interestingly, if we look at the typical November to December trend in contract activity per the grey line (four year average) we see that it is typical to see about 74 contracts in December... and December 2022 was only slightly below that with 67 contracts. Here's a new graph that provides a bit more insight into how many contracts are out there waiting to get to closing... 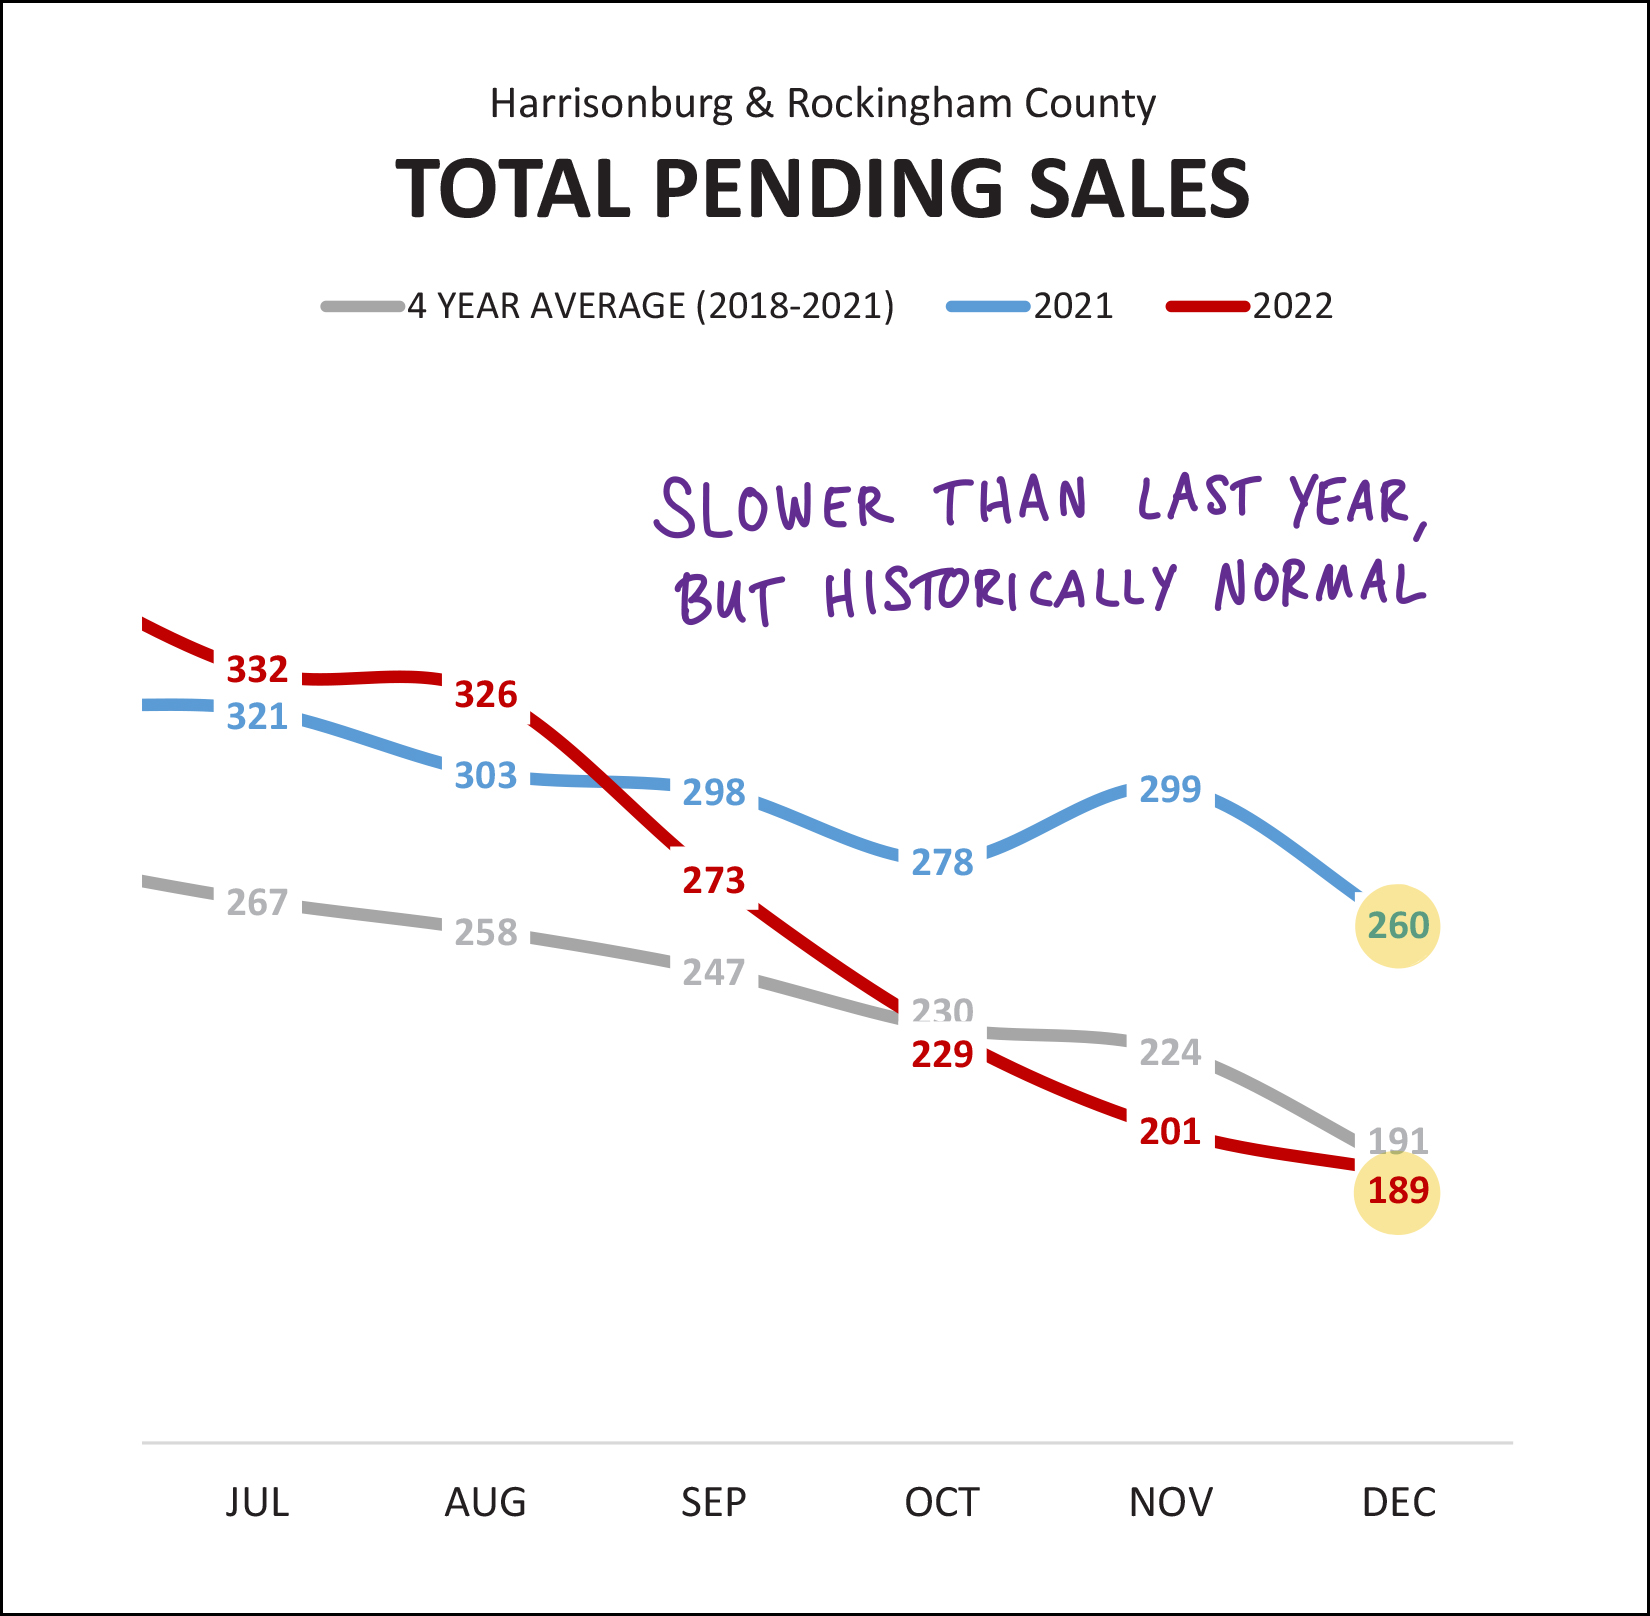 The graph above shows the number of properties that are pending (under contract) at the end of any given month. If you look at the second half of 2021 (blue line) you can see there were anywhere from 260 to 321 contracts pending from month to month. As we moved our way through 2022 the number of pending sales sank lower and lower... below that previous low of 260 all the way down to 189 pending sales at the end of the year. This graph (and the prior graph) would indicate that we will likely see a relatively slow month of closed sales in January and February. But again, looking a bit further back for context... the 189 pending sales at the end of 2022 is... just a smidgen below where we might have otherwise expected to be in a month of December. The anomaly here, it would seem, was the end of 2021 when things were still bonkers in the local real estate market due to super low mortgage interest rates among other factors. And how about those inventory levels -- they must be moving up given slower sales, right? 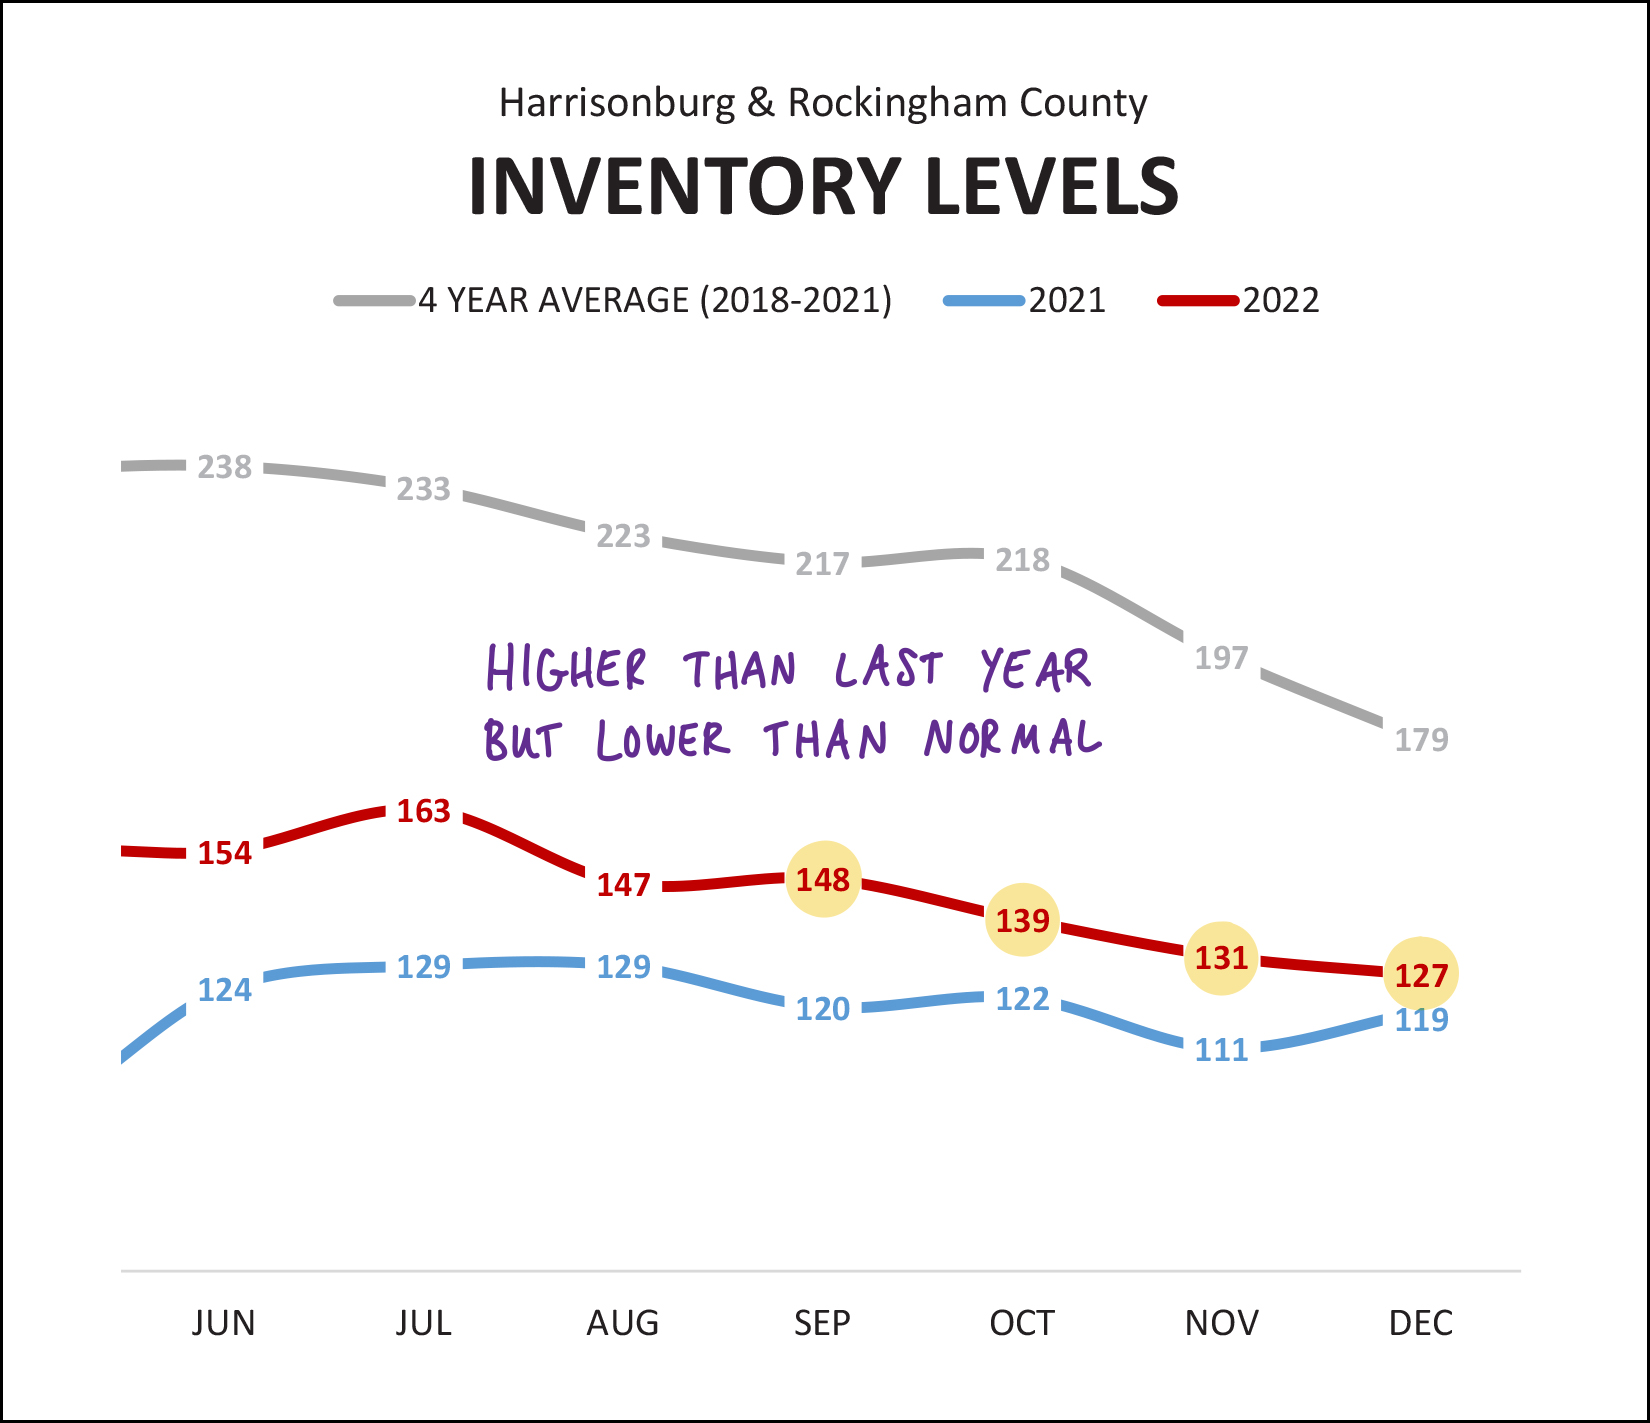 Well... maybe not. We closed out the year with 127 homes on the market in Harrisonburg and Rockingham County. Yes... this is a higher inventory level than one year prior when there were only 119 homes on the market... but it's not that much higher. Furthermore, even though the inventory levels in 2022 (red line above) were higher than in 2021 (blue line) they were still well below (!!!) the average of 2018 through 2021. These are still times over very low inventory... much to any home buyer's dismay. Oh, and how quickly are homes selling now? Slower, probably, right? 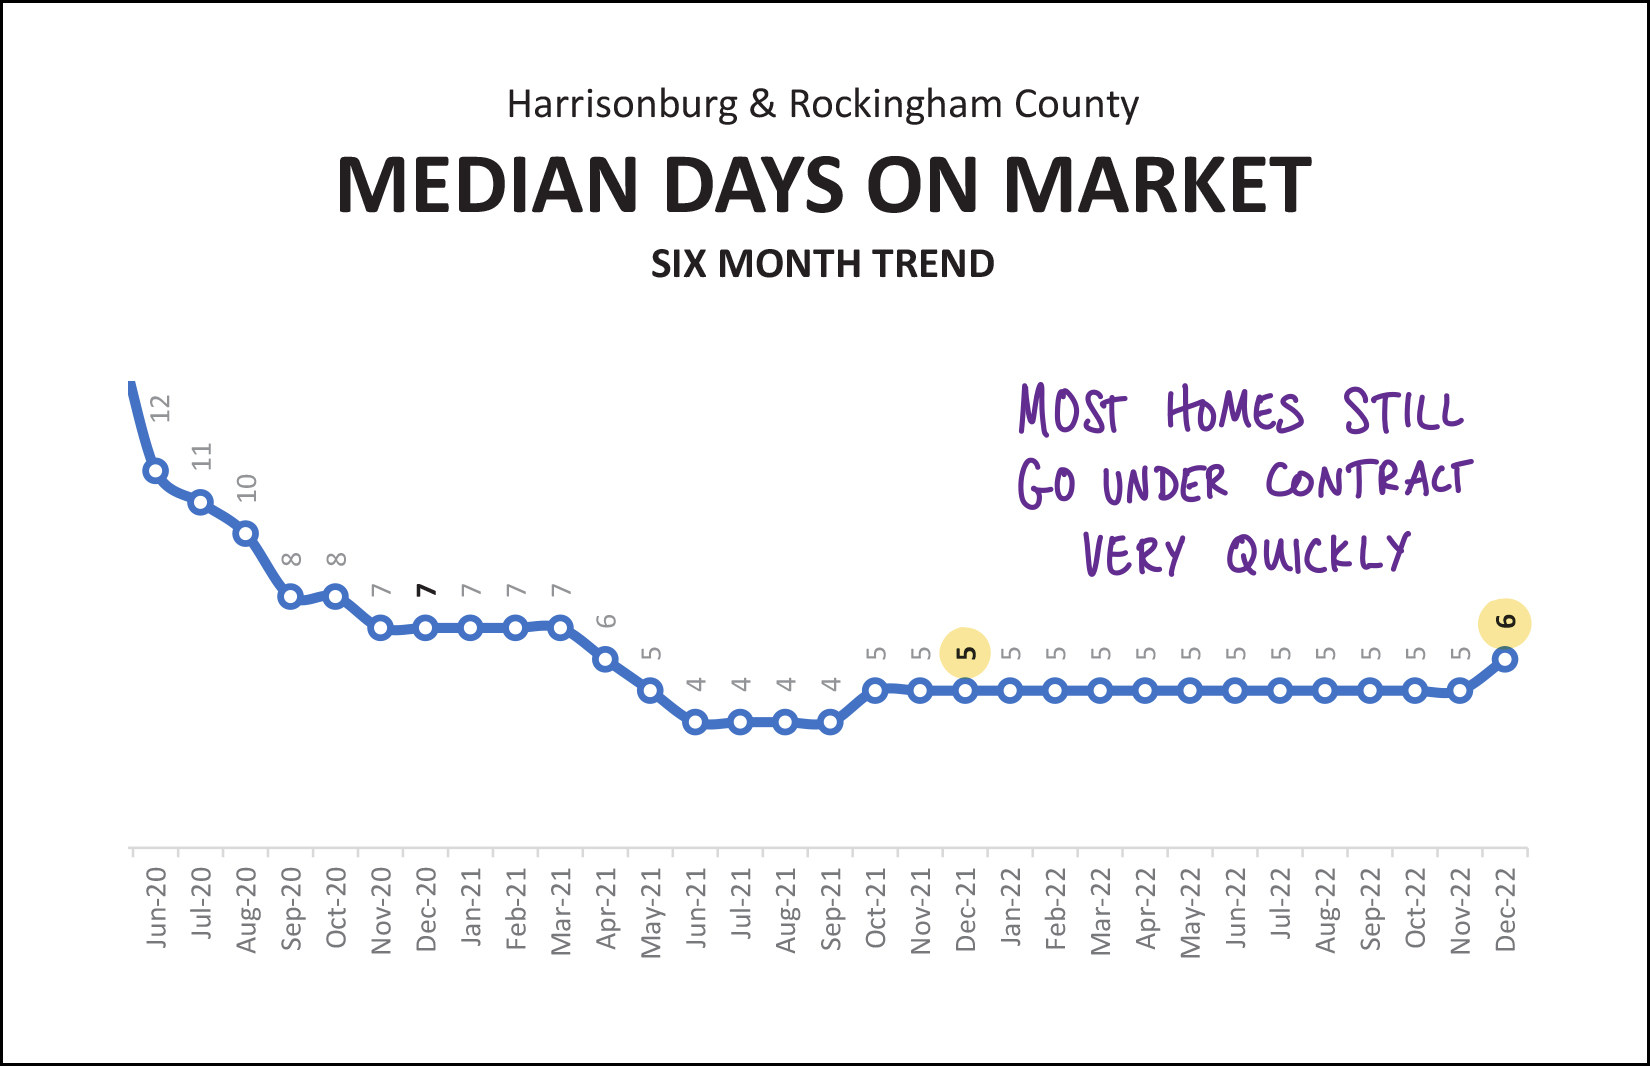 Not so much. The graph above shows the median days on market -- how quickly properties go under contract after being listed for sale -- within a six month timeframe. For over a year this metric stayed right at five days... so as to say that half of homes were under contract within five days and half took longer than five days. That has risen to... six days now. Clearly, not a significant shift, but perhaps we will see it shift further as we move forward. Of note, the median days on market two years ago was seven days... but that was after dropping steadily from double digits the summer prior. Interest rates, interest rates, all you talk about is interest rates... 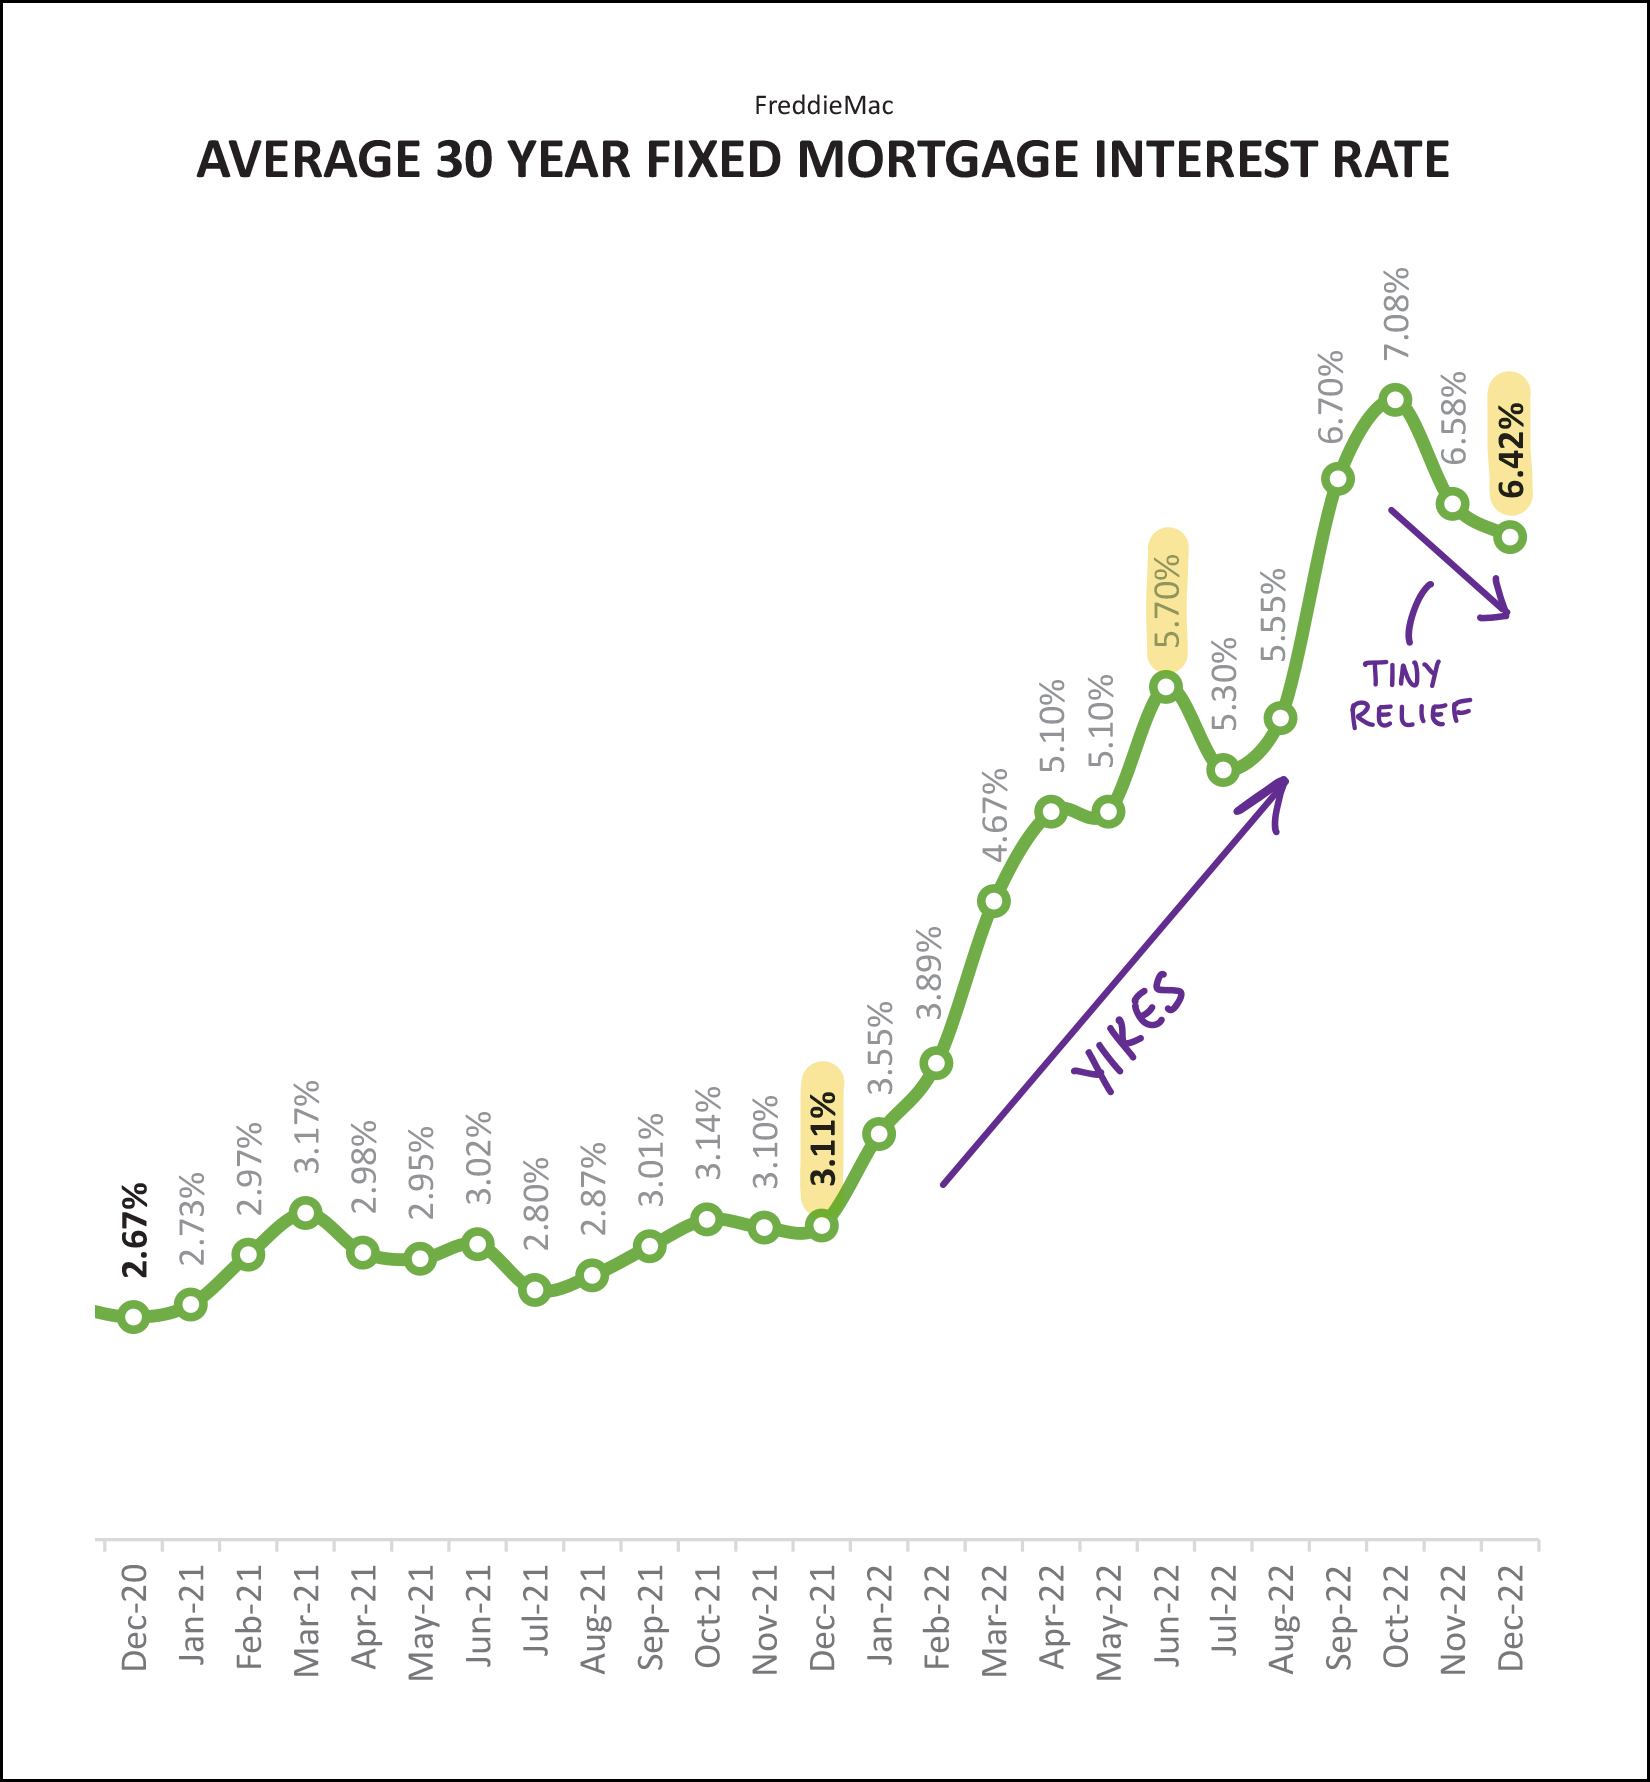 Well, yes, that's true. I have talked a lot about mortgage interest rates this month (and over the past year) because they have been rising, quickly. A year ago (as shown above) the average mortgage interest rate (on a 30 year fixed rate mortgage) was only 3.11%. We closed out 2022 with an average of 6.42%. Thankfully, these rates have continued to decline a bit further in the first few weeks of 2023... but the cost of financing a home purchase is still MUCH higher now than it was a year ago. And yes... these higher mortgage interest rates directly contributed to the slow down in home sales in the second half of 2022. Well folks, that's all for today. I hope the analysis above provides you with a bit more insight into all that has transpired in our local housing market in 2022... and a few thoughts as to where things might be headed in 2023. If you are thinking about selling or buying a home in 2023, I would be happy to assist you with that process. Yes, I spend a good bit of time analyzing our local housing market to educate our local community -- but the majority of my time is spent helping individual home sellers and home buyers. Feel free to reach out to start that conversation by emailing me or texting or calling me at 540-578-0102. I'll provide another update in about a month -- looking back at the first full month of 2023. Until then, I hope you and your family stay healthy and enjoy (???) the constant fluctuations between winter and spring temperatures we seem to be experiencing this year. ;-) Happy New Year! P.S. You can review a few more charts and graphs with further analysis of our local housing market through the close of December 2022 here. Recent Articles:
| |
| Newer Post | home | Older Post |
Scott Rogers
Funkhouser Real
Estate Group
540-578-0102
scott@funkhousergroup.com
Licensed in the
Commonwealth of Virginia
Home Search
Housing Market Report
Harrisonburg Townhouses
Walk Through This Home
Investment Properties
Harrisonburg Foreclosures
Property Transfers
New Listings


