| Newer Post | home | Older Post |
Home Prices Still On The Rise Despite Fewer Home Sales In 2023 |
|
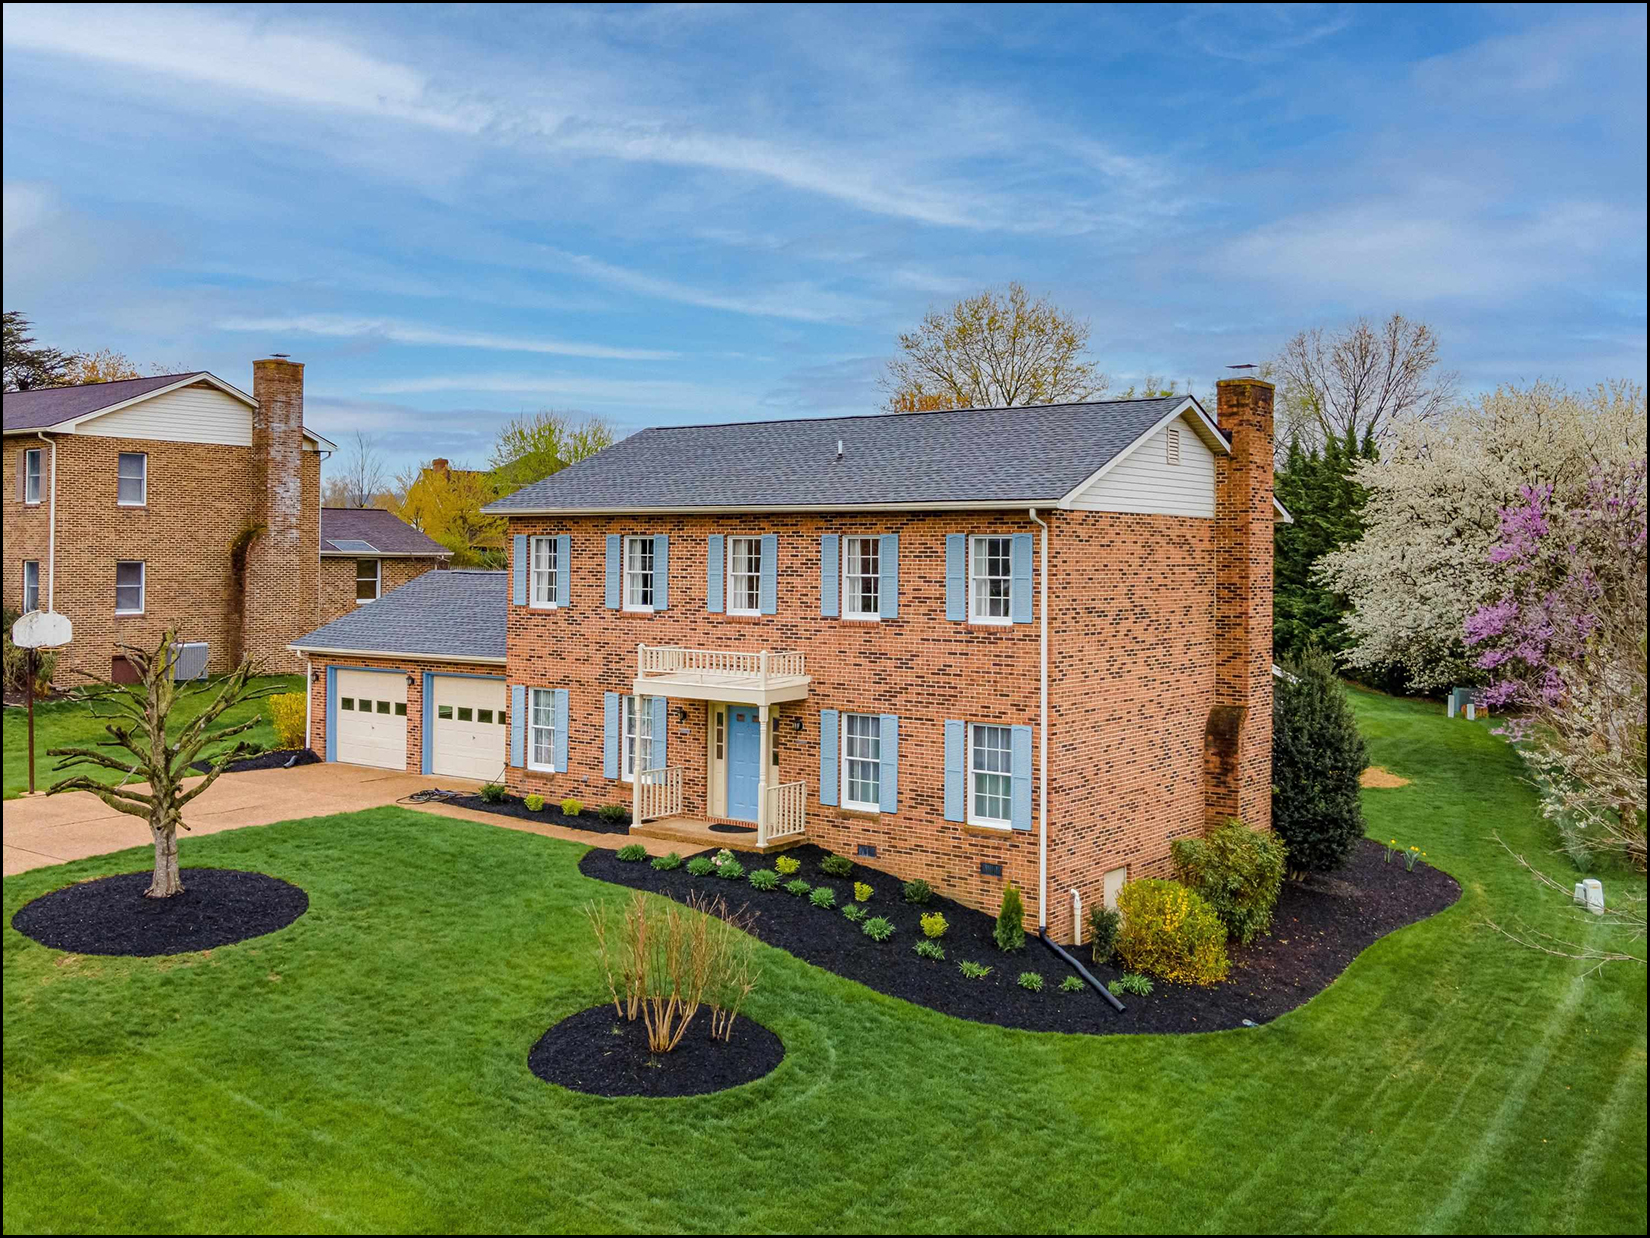
 Happy Thursday afternoon, friends! The spring real estate market is upon us -- though it looks and feels a bit different than it did over the past few years. Read on for stories of fewer home sales, rising prices and stubbornly low inventory levels. Speaking of spring... if you're looking for a home with landscaping that really pops each March, check out this beautiful, four bedroom, brick home over on Meadowlark Drive that came on the market earlier this week... On a personal note, can you spot any proud parents of a soon-to-be high school graduate in the photo below? :-) Wow, the past 18-ish years have flown by quickly. Luke will be graduating in early June and Shaena and I couldn't be more proud of this guy!  << Insert Here: Quick transition to some other topic so I can stop thinking about how old I must be if my son is about to be a high school graduate!?! >> OK, then... Each month I offer a giveaway, of sorts, for readers of this market report, highlighting some of my favorite places, things or events in Harrisonburg. Recent highlights have included Taste of India, A Bowl of Good and a Steel Wheels concert. This month... I'm giving away a $50 gift card to one of my favorite lunch (or dinner) spots downtown... Cuban Burger! I almost always order the Cuban Chop Chop with Chicken, but everything on their menu seems likely to be delicious! Click here to enter for a chance to win the $50 gift card! And now... let's move on along to the most recent data on our local real estate market. First, let's see what "fewer home sales" looks like right now... 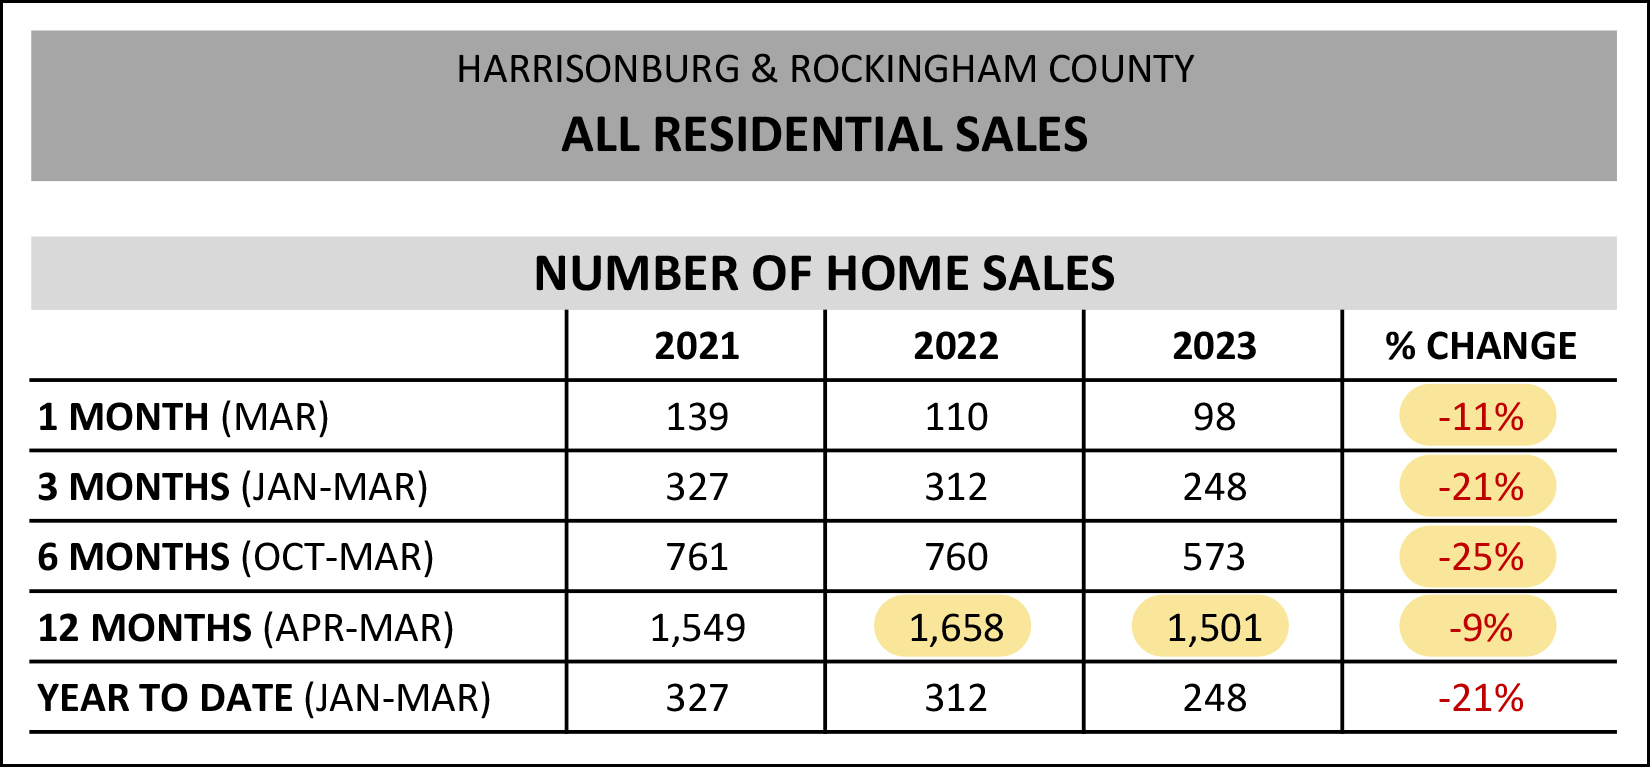 A few observations related to the chart above... [1] While the number of home sales taking place this March was 11% lower than a year ago -- that's not quite as much of a drop as we see when we look at the past three months (-21%) or the past six months (-25%). So, maybe things are picking back up -- a bit -- here in March? Maybe? [2] There have been 1,501 home sales over the past year in Harrisonburg and Rockingham County which is a 9% drop from the previous 12 months when there were 1,658 home sales. This drop of 157 home sales for the year seems almost certainly to be a one-sided supply side issue -- not enough sellers selling. You'll note later on in this report that inventory levels haven't risen by 157 homes (due to buyers not wanting to buy) so the constraint on the number of home sales is almost certainly directly tied to how many sellers want to or are willing to sell. But despite fewer homes selling, home prices keep on rising...  Yes, we could pick on the one red number on the chart above -- showing a 1% decline in the median sales price between March 2022 and March 2023 -- but the small sample size (of one month of data) means that this is not necessarily a meaningful indicator of an actual downward trend. This is made even more evident by the 10% - 11% increases in the median sales price when looking at three, six and 12 months of data in the chart above. Perhaps more importantly, yes, we're still seeing double digit annual increases in the median sales price in Harrisonburg and Rockingham County. One year ago the median sales price was $276,200. It has risen 10% over the past year, cleared $300K, and is now at $304,900. Just to refresh one's memory on what "median" signifies -- it means that half of the homes that are selling are priced at or above $304,900 and half are at or below $304,900. Prices just keep on rising! Buyers who are frustrated that they can't wait even just a day to make a decision about an offer on a hot new listing might be encouraged by these next stats...  There has been an ever so slight (ok, technically 20%) increase in the median days on market stat over the past year. A year ago homes were going under contract after a median of five days... and now that has risen to... six days. Yes, I know, that one day might not seem that significant -- but if we look at just the past three months we'll note that the median days on market has jumped up to eight days! So, some new listings are lasting an extra day (or three) on the market before they're going under contract. So, the market is slowing down... barely. It will be interesting to see if this metric continues to rise, falls again, or stays at about the same level as we move into and through the spring market. Now, as to what is actually selling, there are some interesting trends to be noted between existing homes and new homes. I have highlighted the numbers below that I think deserve attention. Here's the existing home sales data... 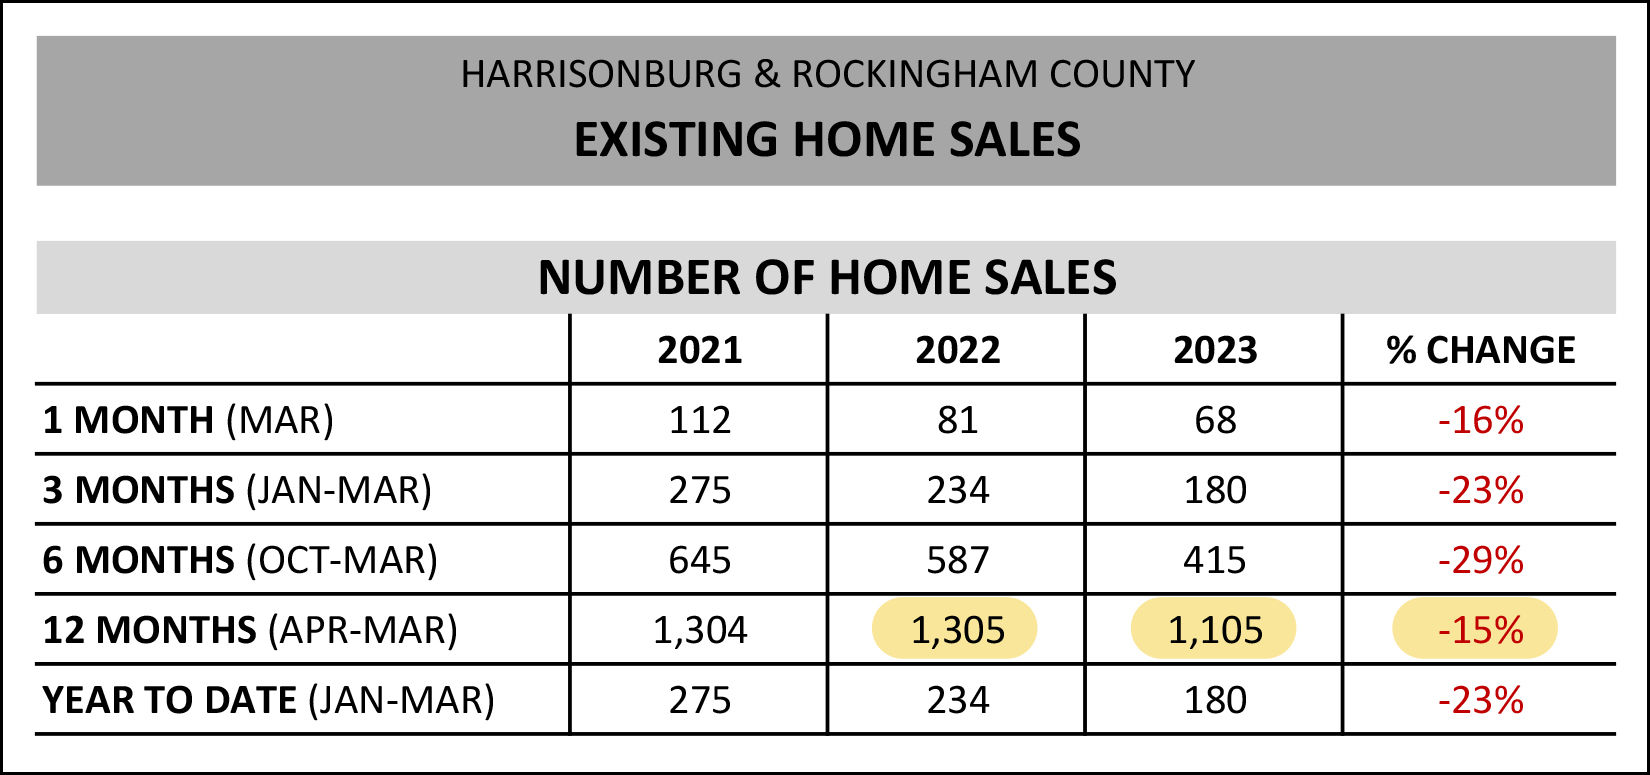 ...and here's the new home sales data... 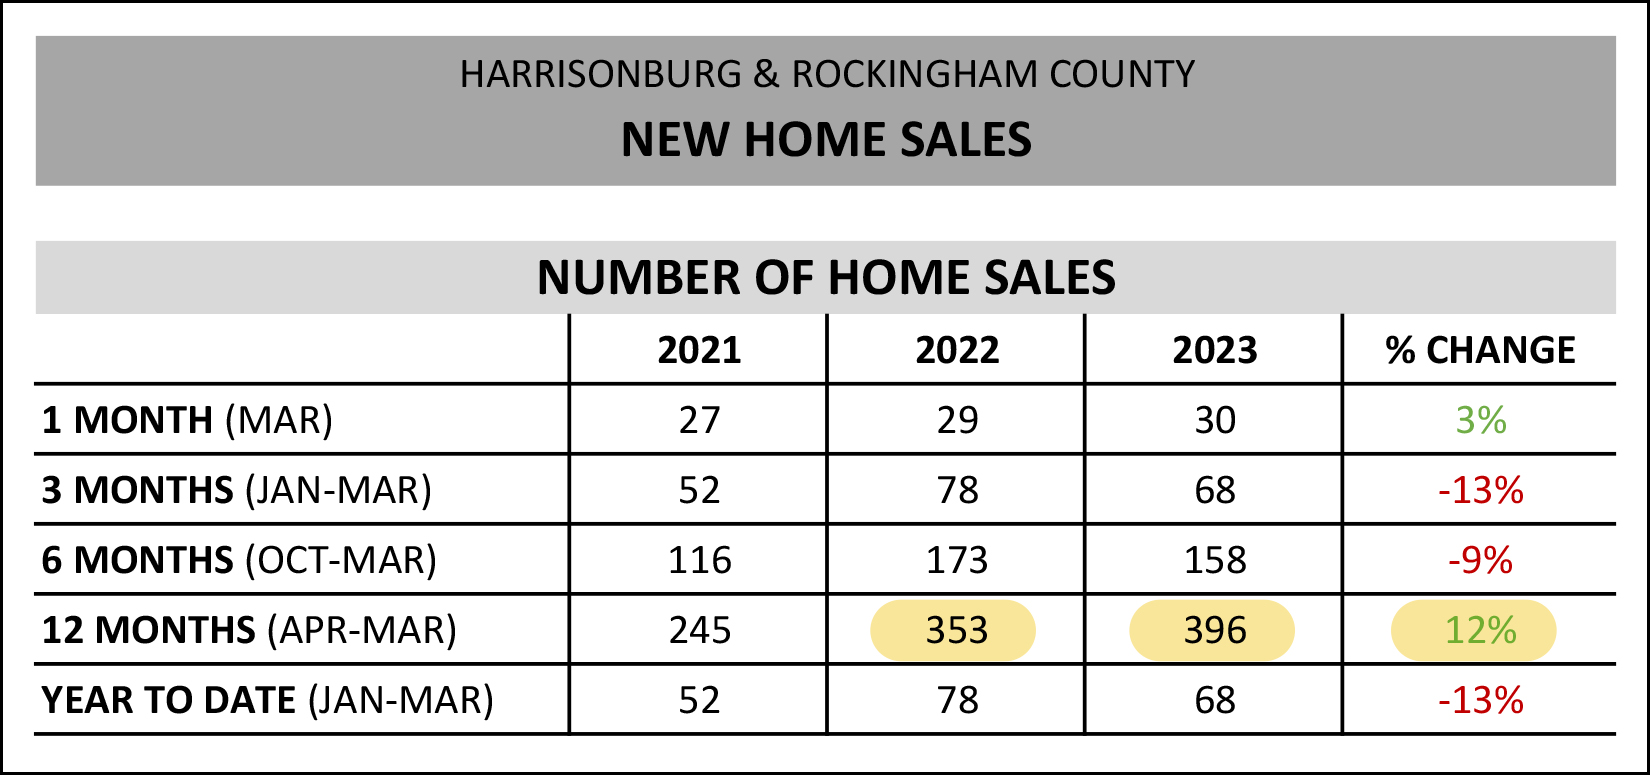 So, while the overall market has seen a 9% decline in home sales over the past year... [1] There has been a 15% decline in existing home sales. [2] There has been a 12% increase in new home sales. If you want to buy a home that is of the property type, size, price and location of one of our area's new home communities -- these trends work in your favor. If you want to buy an existing home (not a new home) in an established neighborhood -- these trends aren't all that exciting. There haven't been 9% fewer homes to buy over the past year -- there have been 15% fewer homes to buy!?! Now, circling back to the monthly data... 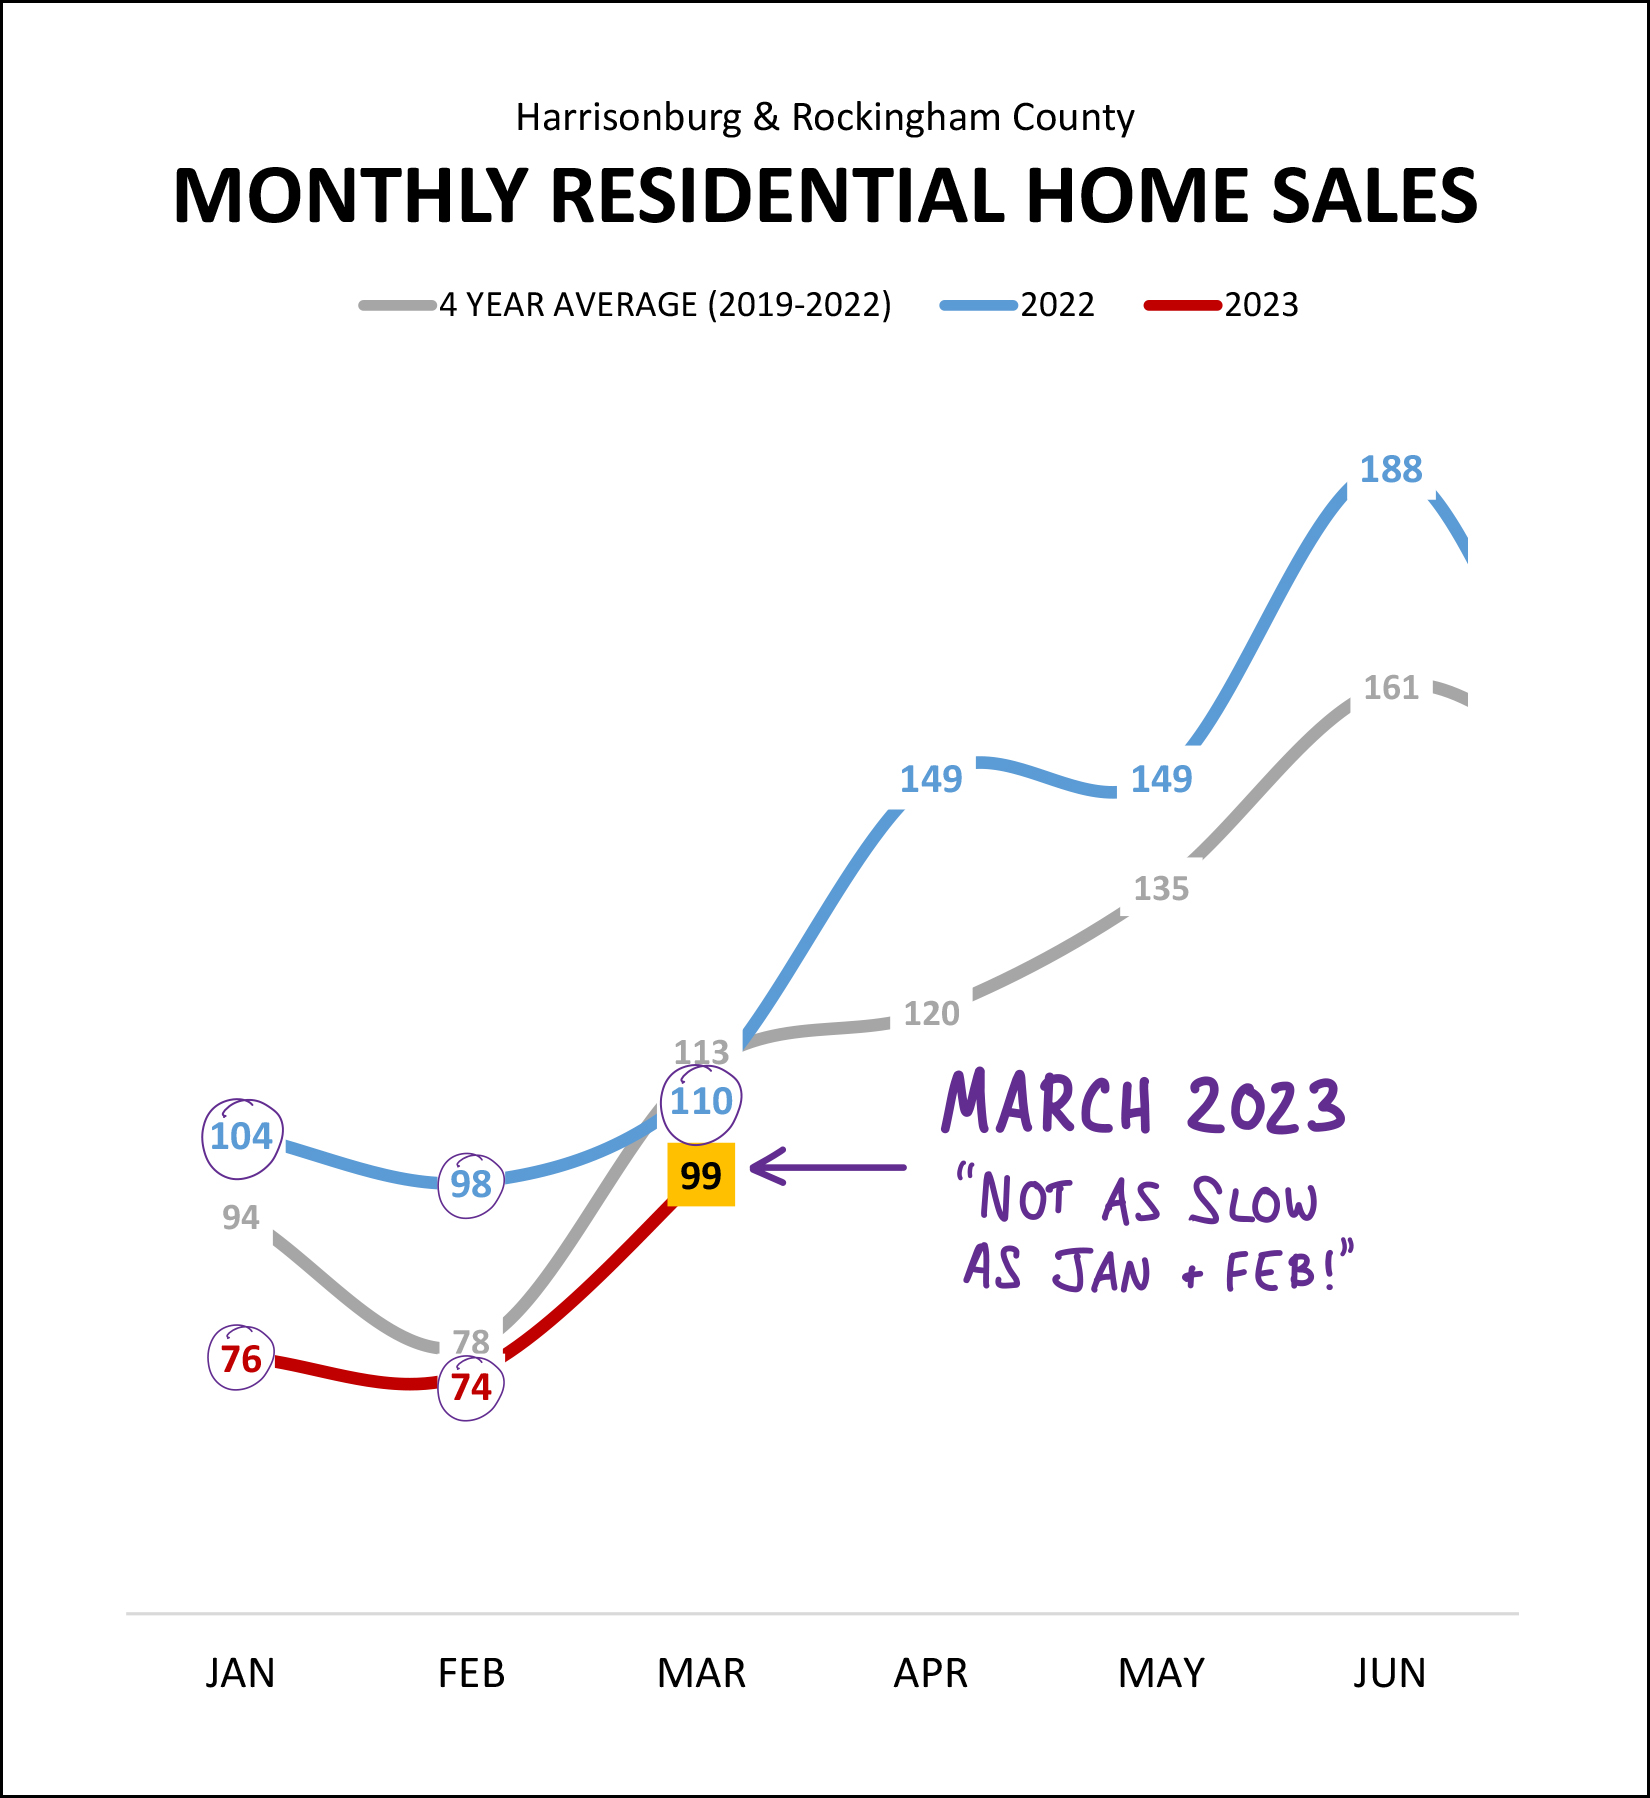 March was... not as slow as January and February!?! ;-) We saw significantly fewer home sales this past January and February as compared to the same month last year. January sales were 27% below the prior year. February sales were 24% below the prior year. March sales were only... 10% below the prior year! So, I suppose that's a bit encouraging... we're starting to see a slight increase in monthly home sales... though yes, we're definitely still well behind 2022. And for anyone who likes a good participation trophy... 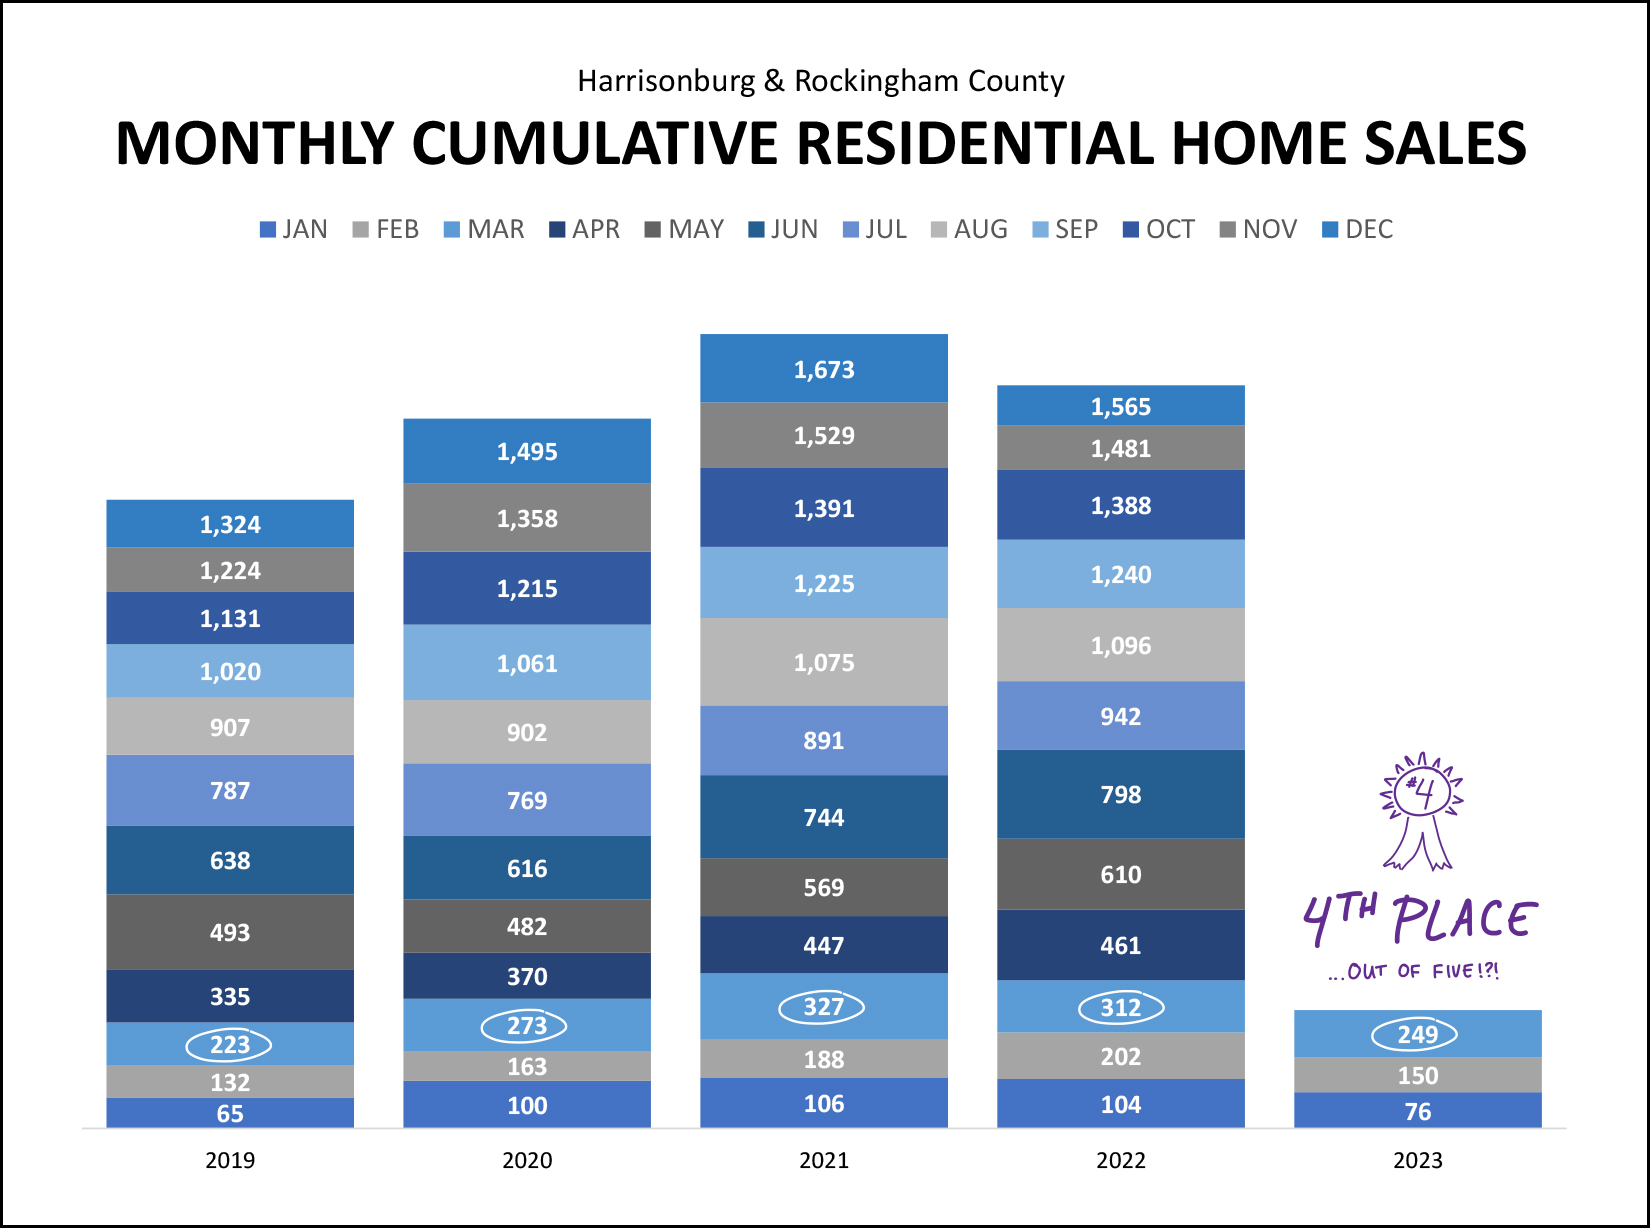 ... First Quarter Home Sales In 2023 came in at... 4th Place... oh, out of five contestants! Indeed, the 249 home sales we have seen in the first quarter of 2023 was fewer than we saw in 2020, 2021 and 2022. We are slightly ahead of the first quarter of 2019, though, so there's that... Looking at the big picture of our market over the past few years, in visual form... 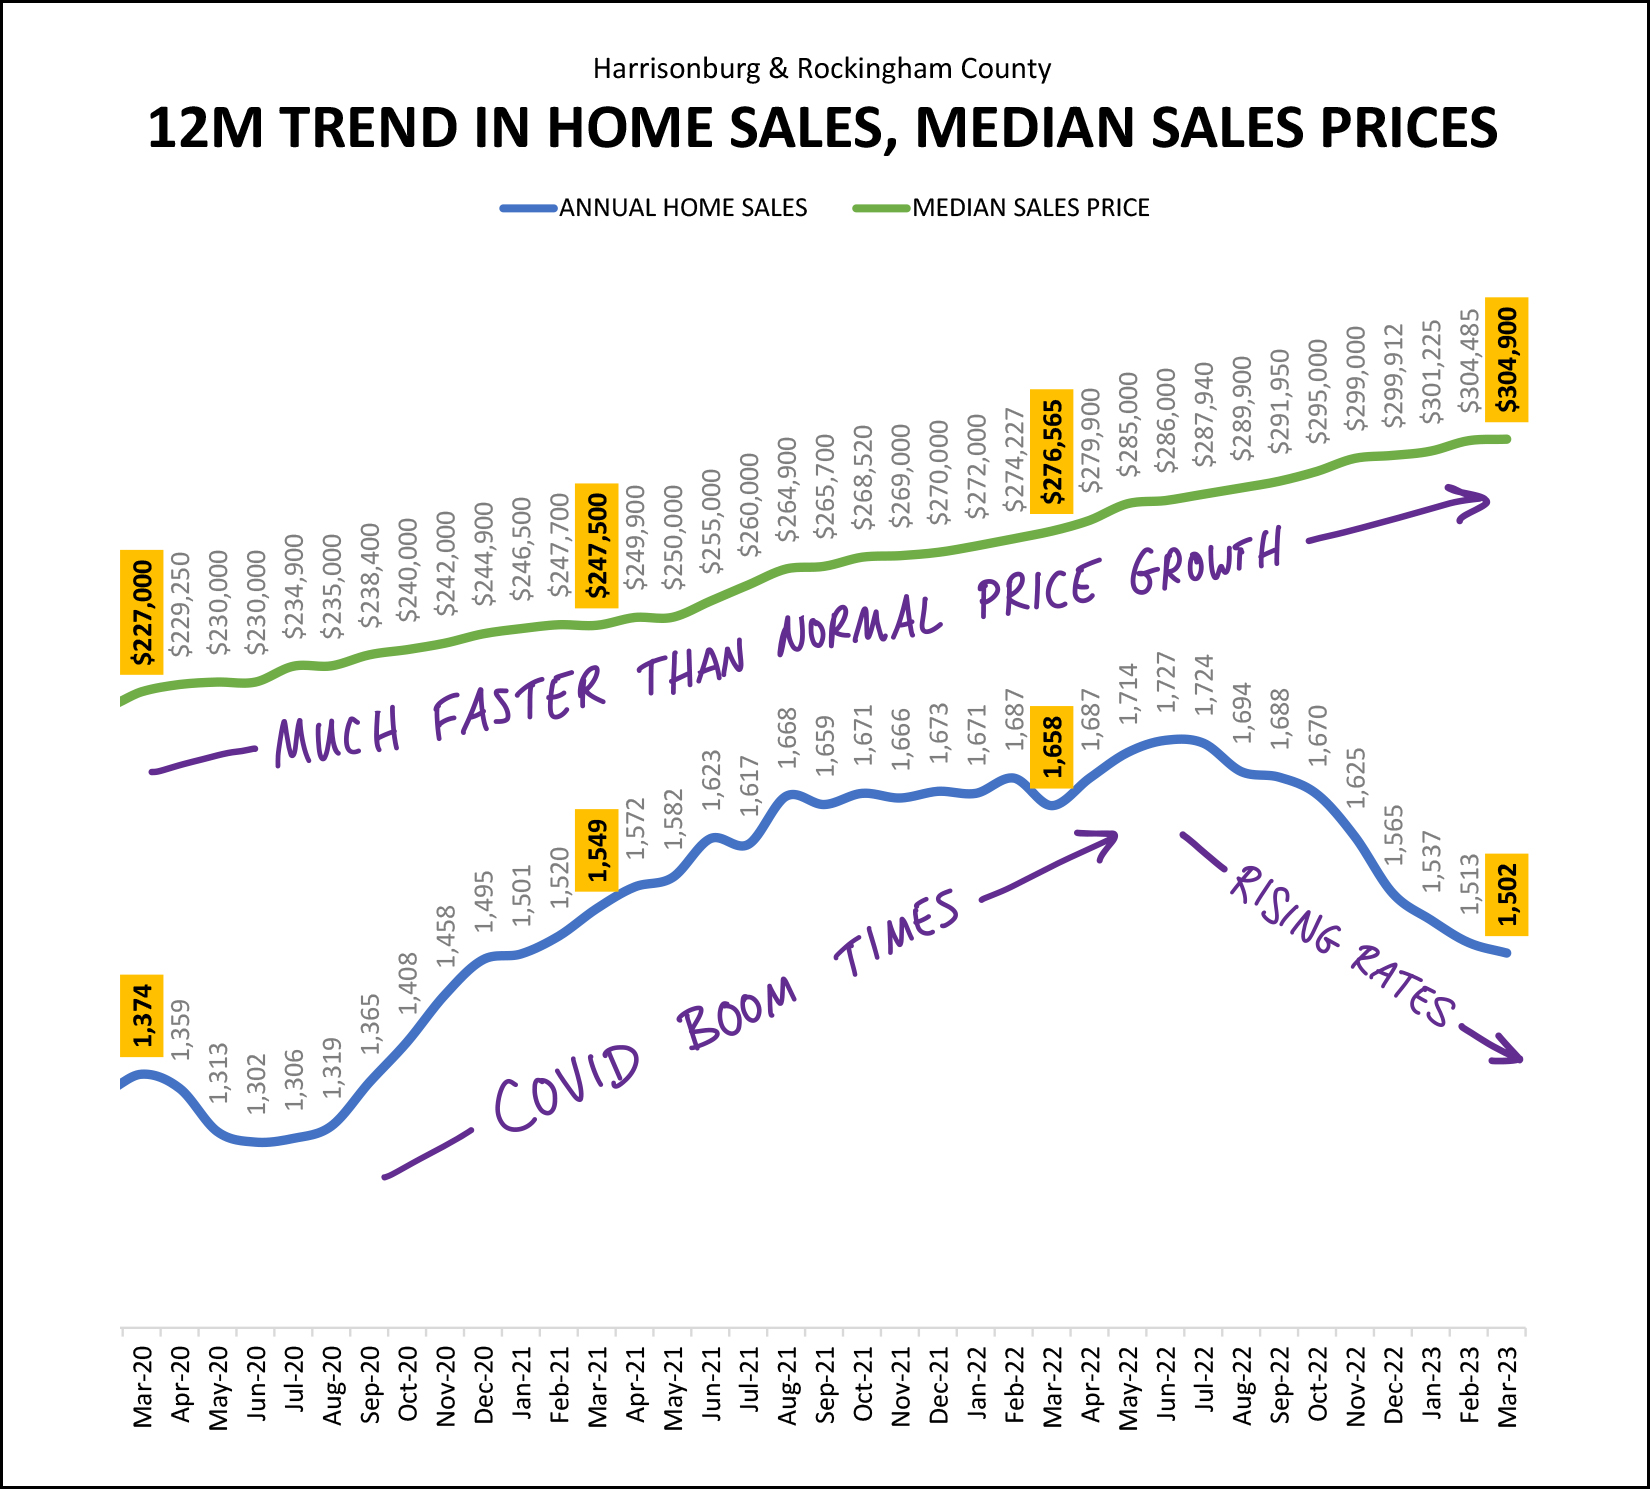 There are two main things to note in the graph above... [1] Home prices have been increasing at a much faster pace than is historically normal. We're in the third year in a row of double digit (per year) increases in the median sales price in our area. [2] After a two year boom in the number of homes selling (due to Covid and super low interest rates) we are now almost a year into a steady decline in annual home sales (from 1,727 per year to 1,502 per year) mostly related to rising mortgage interest rates. Now, let's look ahead by looking behind... 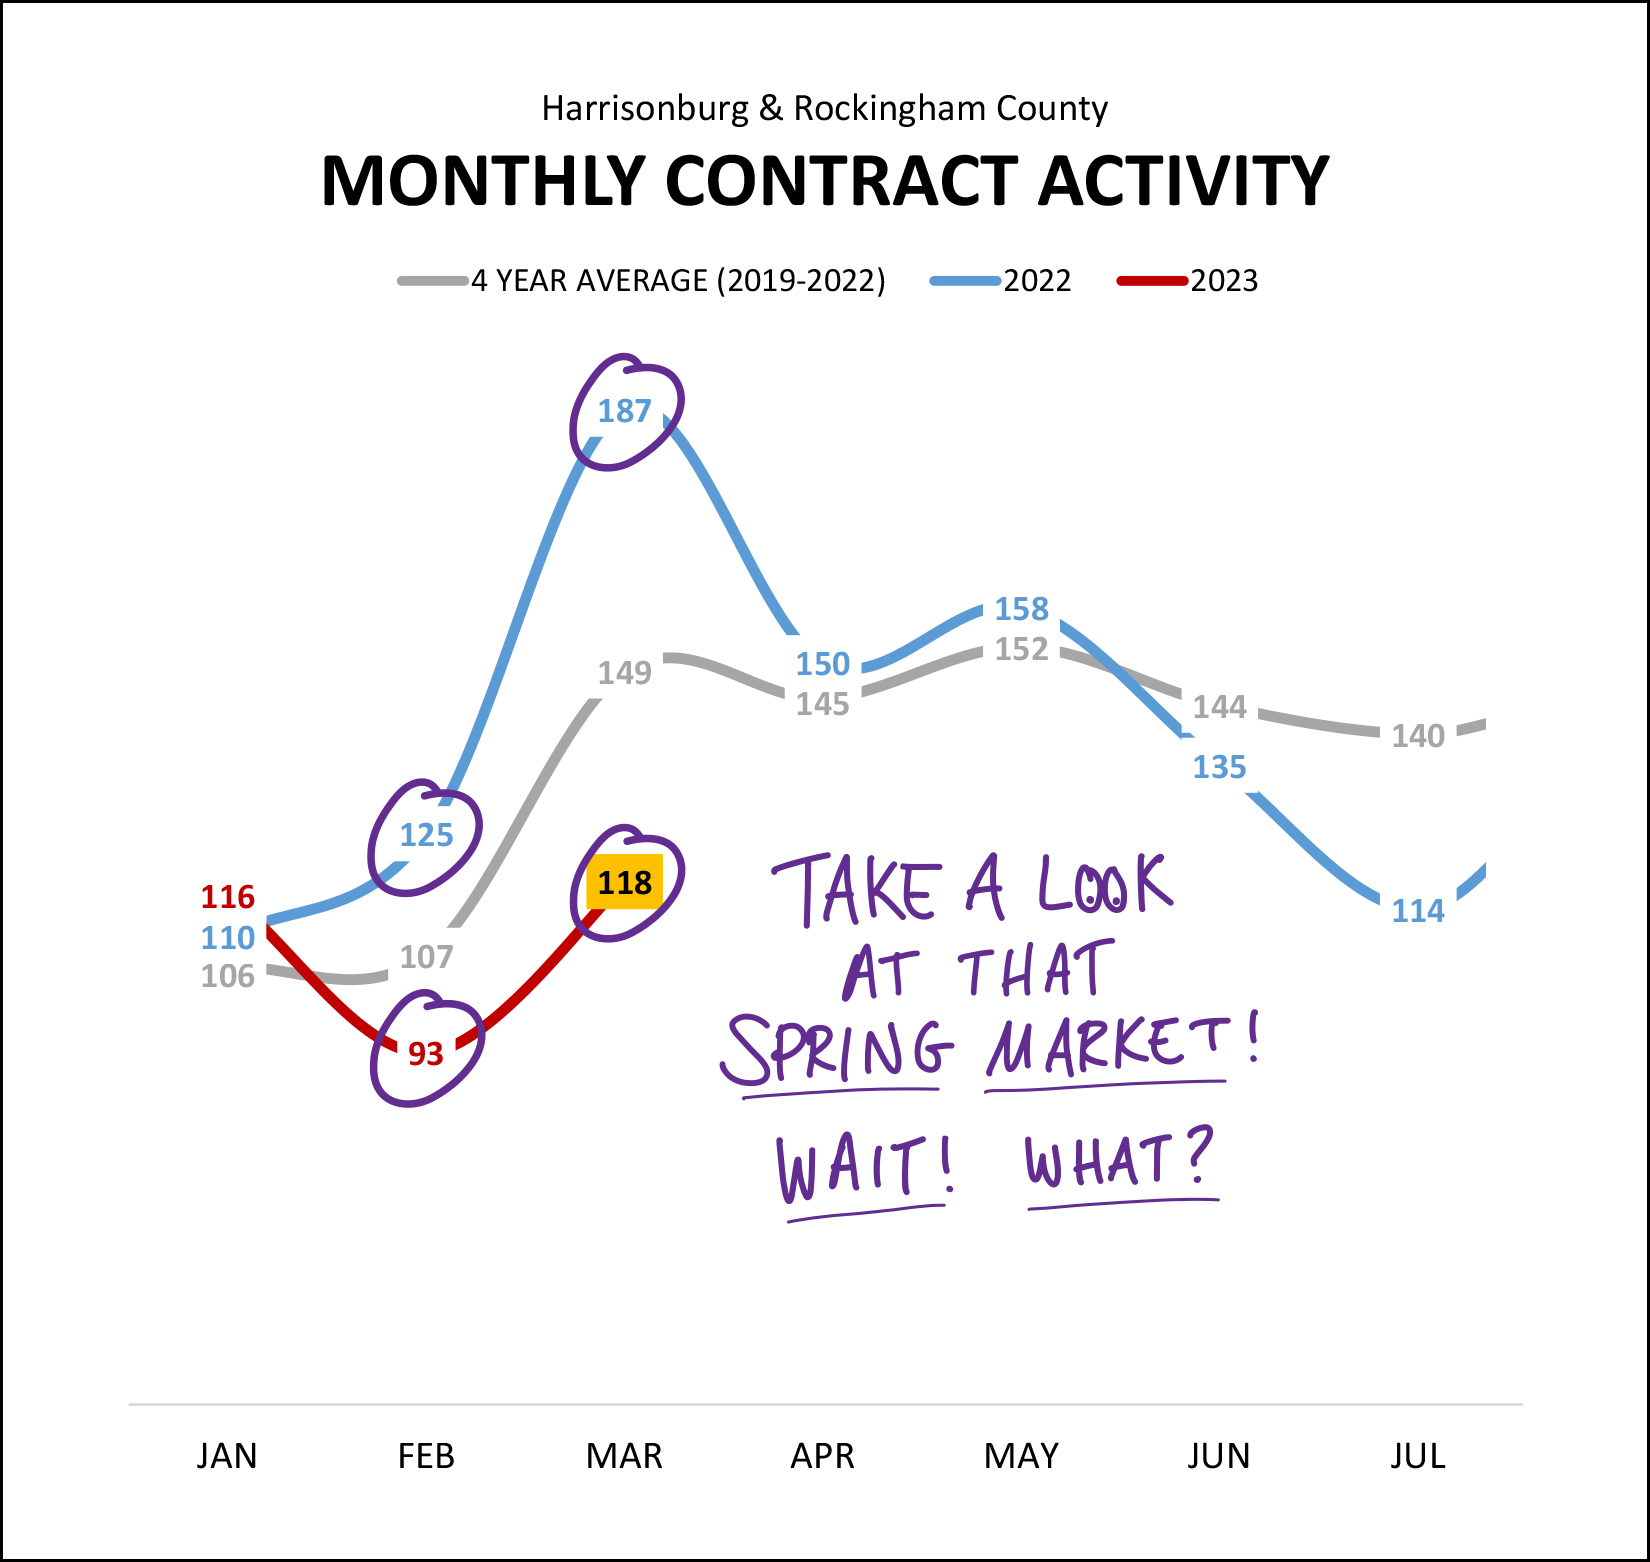 Home sales this month are most directly influenced by contracts last month. So, how did things go in the March market? Lots of sellers listing their homes for sale? Lots of buyers contracting to buy homes? Well... not really. [1] Contract activity declined 26% in February 2023 compared to February 2022. [2] Contract activity declined 37% in March 2023 compared to March 2023. So, yeah, the spring market (sooo many listings, sooo many contracts) doesn't quite seem to be showing up this year like it did last year. Maybe the buyers (and much more importantly, the sellers) will start showing up in April? Unsurprisingly, several slow months of signed contracts brings on a lower than ever number of pending sales in Harrisonburg and Rockingham County... 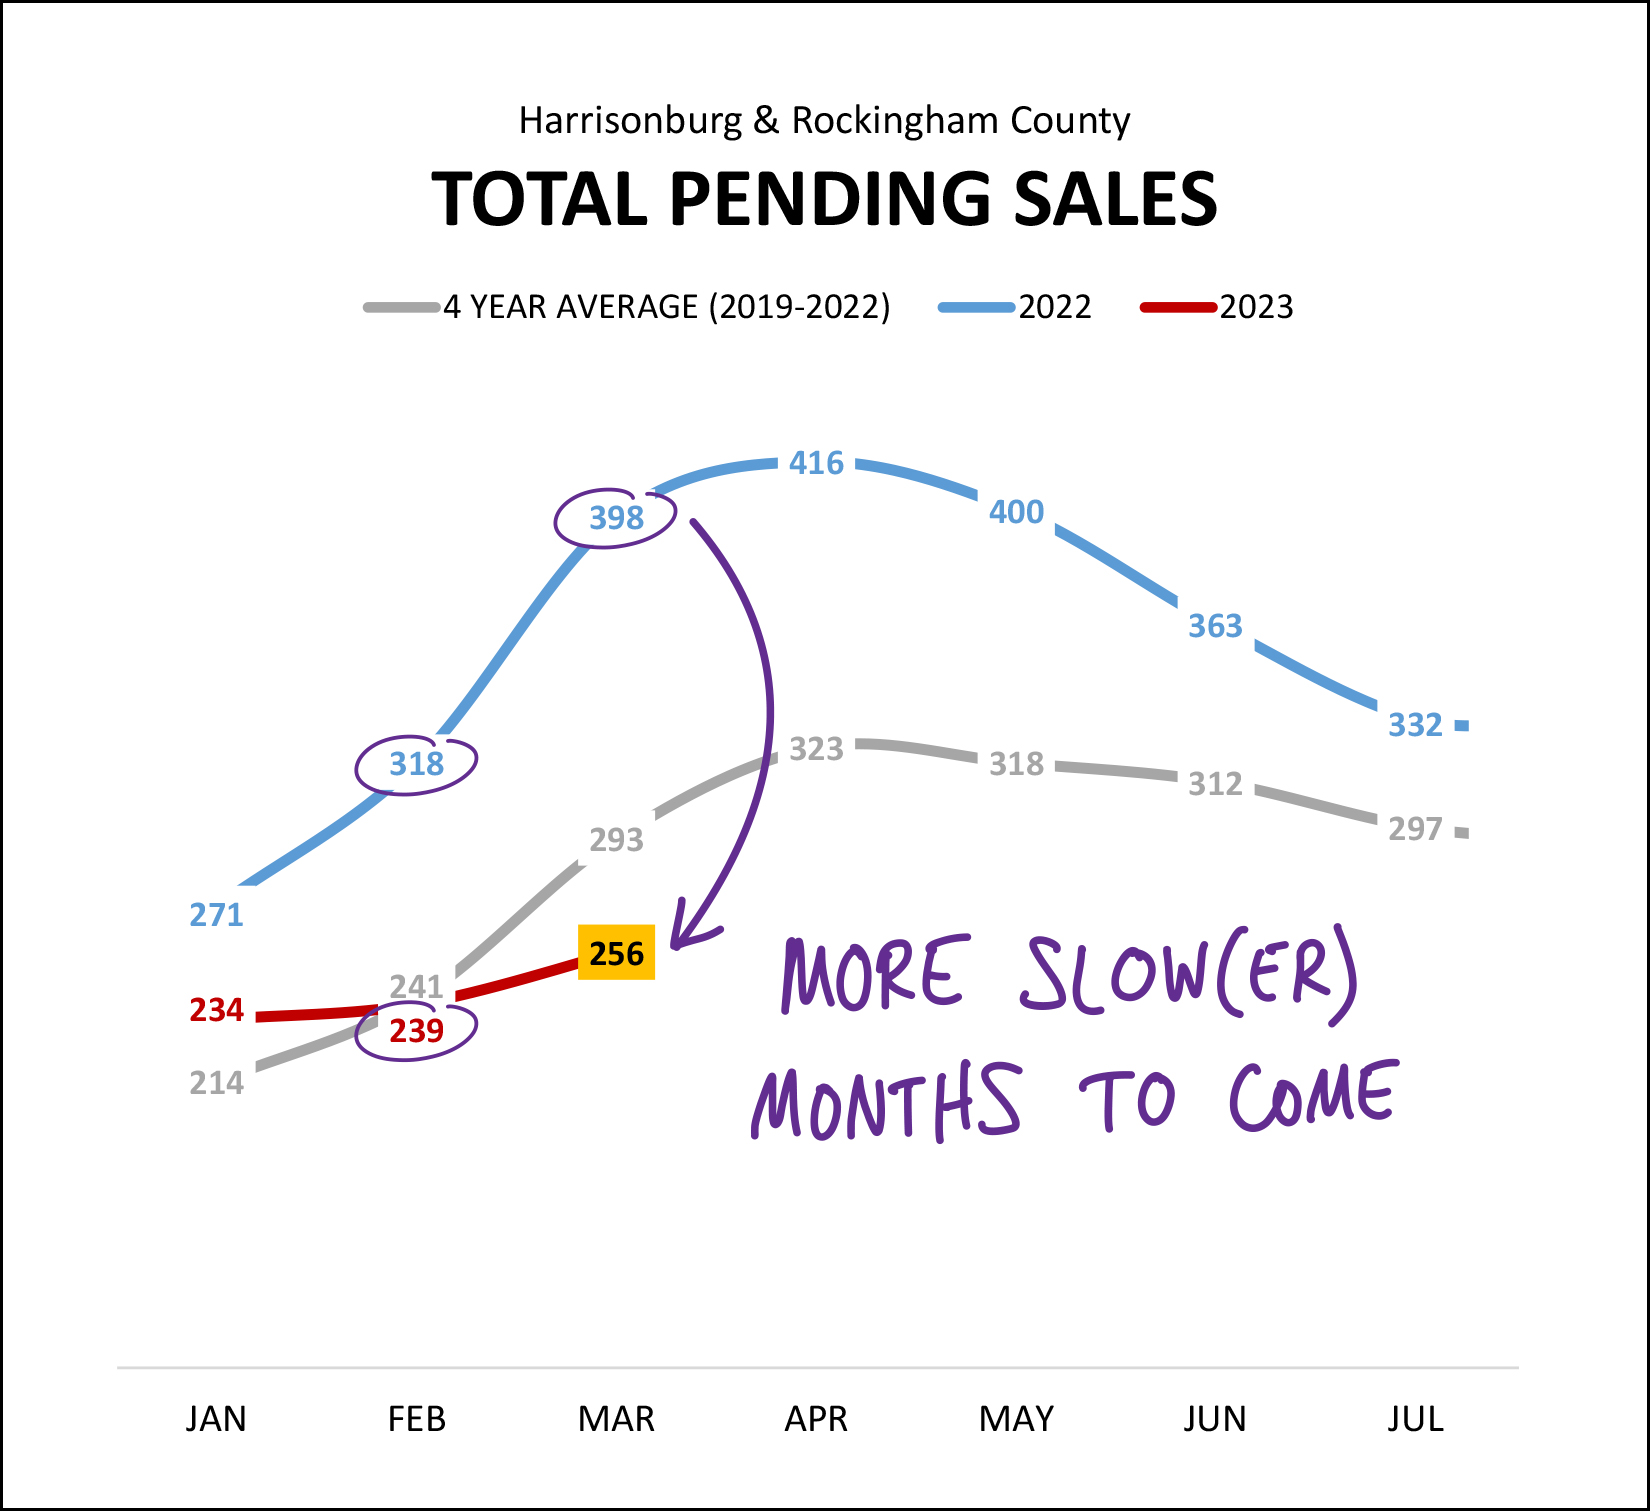 There are 256 homes currently under contract in Harrisonburg and Rockingham County. One year ago there were 398 (!!!) homes under contract. Over the past four years we've seen an average of 293 homes under contract at this time of year. So, yeah, based on the low number of pending sales right now, we are likely to see at least another month or two (or more!?) of slow(er) months of home sales. Why have there been so few homes going under contract? Are the listings pouring onto the market and buyers are just deciding not to buy? If that were the case, we'd see inventory levels starting to climb, so, let's take a look... 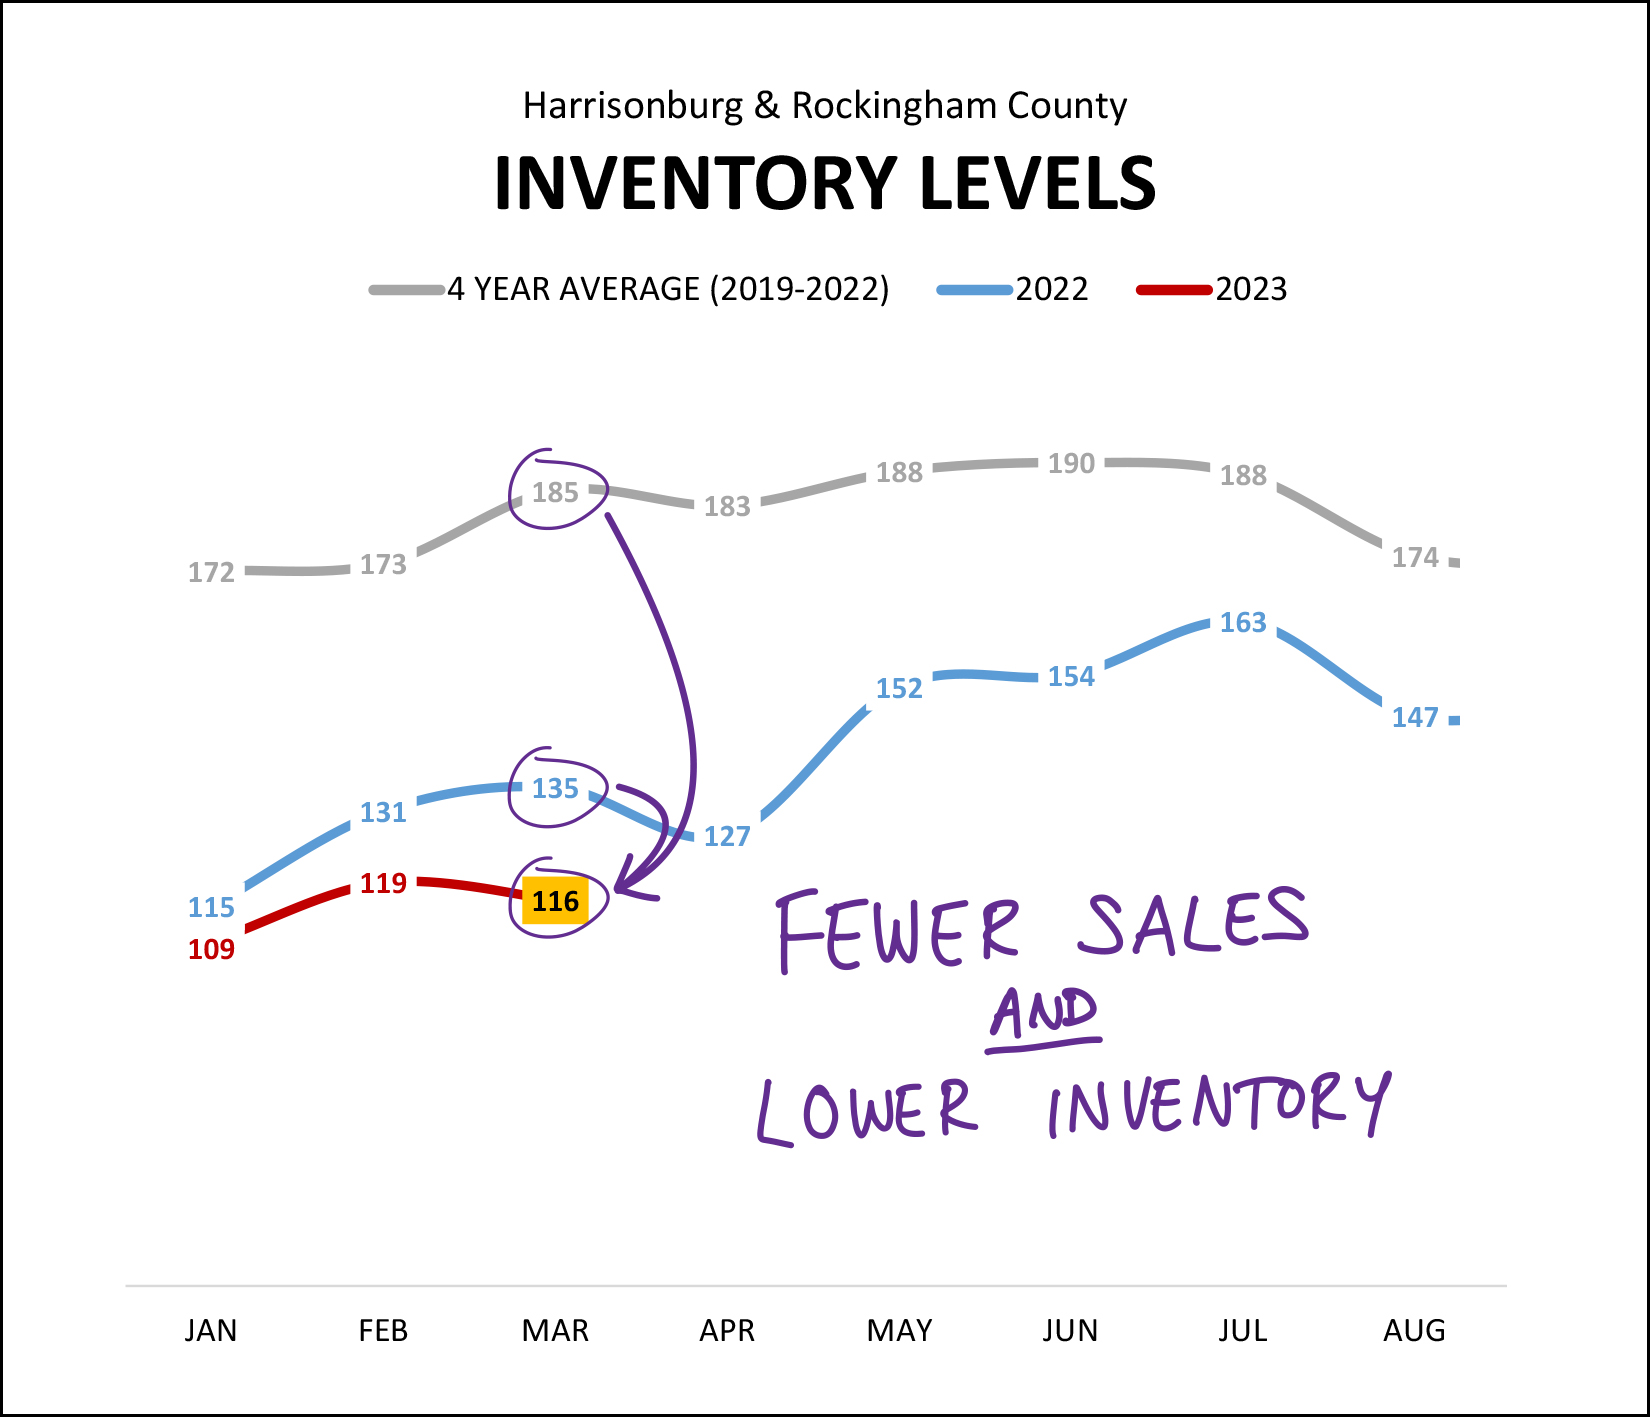 In fact, no, inventory levels are not rising. They are staying stubbornly low. There are 116 homes on the market right now (for sale, not under contract) in Harrisonburg and Rockingham County. This is compared to 135 being on the market a year ago at this time... and an average of 185 being on the market over the past four years at this time of year. So, buyers seem to not be buying because... there's nothing to buy. Or, at least, there's less to buy. Plenty of homes (-9% year over year) are still selling, but this decline in sales activity seems to still be entirely related to sellers not selling, and not related to buyers not buying. And yet, despite inventory levels staying super low, we are actually seeing a slightly change in how quickly homes are going under contract... 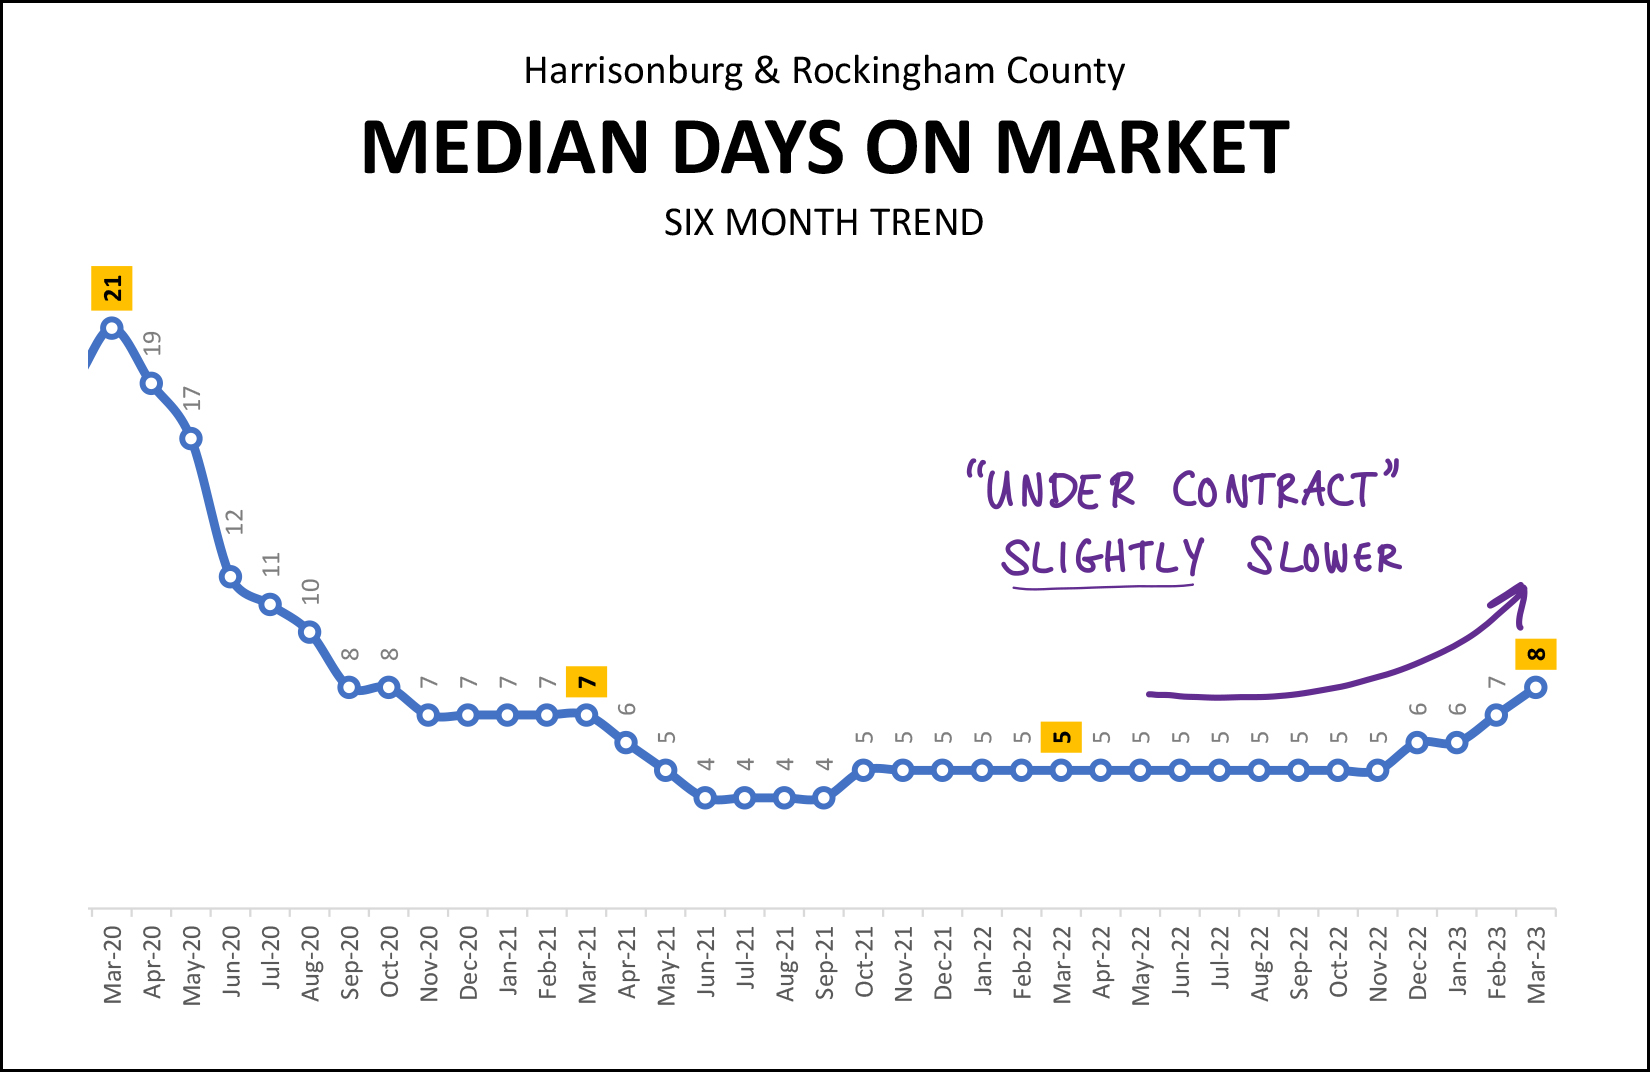 Over the past six months the "median days on market" has been eight days in Harrisonburg and Rockingham County. That means that half of the homes that have sold were under contract within eight days of hitting the market and half were under contract in eight or greater days. The change here is a slight increase from five days up to eight days over the past few months. We were seeing a median days on market of six days or less for almost two straight years (April 2021 - January 2023) but that is starting to drift upwards a bit. So, (some) listings are lasting an extra day or two (or three) on the market right now -- though these days on the market levels are still well below long term historical norms. Maybe it's taking buyers an extra day or two to make an offer because they have to keep checking in with their lender because rates are constantly jumping up and down from week to week and month to month? 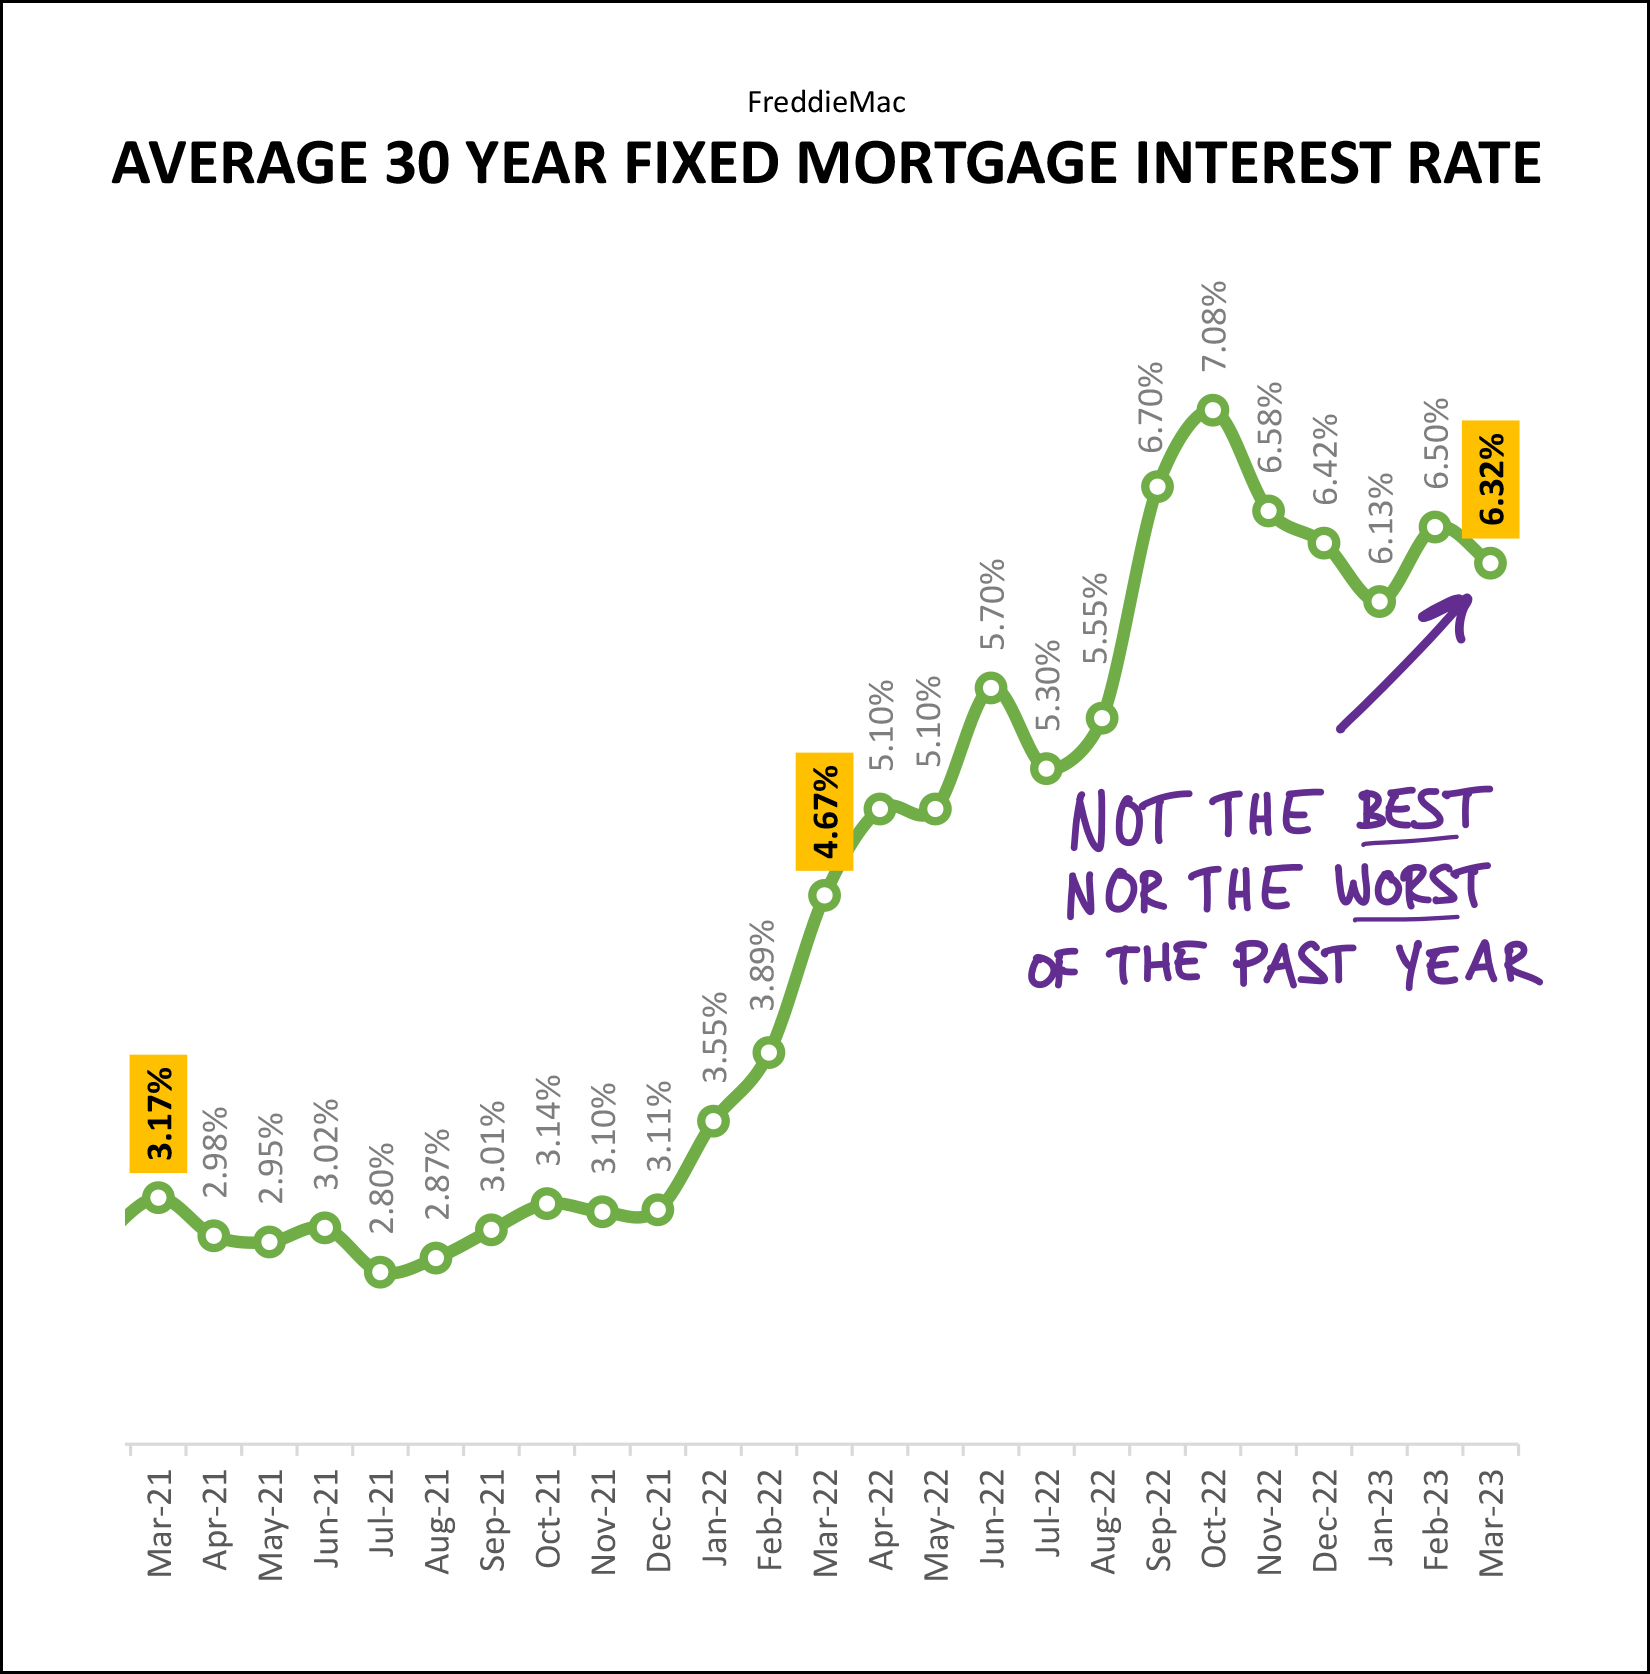 Rates dropped in March, after rising in February, after dropping in January -- you get the picture. We're currently seeing mortgage interest rates that are definitely and absolutely not the best we've seen in the past year -- but that also are a good bit below the worst that we've seen in the past year. Where mortgage interest rates go from here is anyone's guess -- but I'm thinking they will continue to fluctuate on a weekly and monthly basis for much of 2023. OK! That was a lot of data, and charts and graphs, oh my! If you made it all the way to the end, thanks for reading and I hope you are feeling more informed than ever as to the latest trends in our local housing market. If you're thinking about selling your home this spring or summer -- all of the would-be buyers of Harrisonburg and Rockingham County would REALLY like you to decide to do so. ;-) Let me know if you'd like to set up a time to walk through your home together to talk about preparations, pricing, timing, etc. If you're hoping to buy a home this spring or summer -- I'd be delighted to be in your corner helping you navigate this rapidly moving, competitive market. Let's chat about what you're hoping to buy, get you connected to a local lender to become pre-approved, and then let's try not to develop a twitch as we keep checking for new listings again, again, again and again. That's all for today, folks. I hope the balance of your month of April goes well and that you aren't struggling too much with the seasonal allergies that seem to affect so many of us at this time of year. I think the beauty of the blooming flowers and trees generally outweigh the not-so-exciting allergy symptoms that I'm currently working through. Be in touch anytime if I can be of help to you -- with real estate or otherwise. You can reach me most easily at 540-578-0102 (call/text) or by email here. P.S. If you want even more charts and graphs than I have included above, you'll find them here. Recent Articles:
| |
| Newer Post | home | Older Post |
Scott Rogers
Funkhouser Real
Estate Group
540-578-0102
scott@funkhousergroup.com
Licensed in the
Commonwealth of Virginia
Home Search
Housing Market Report
Harrisonburg Townhouses
Walk Through This Home
Investment Properties
Harrisonburg Foreclosures
Property Transfers
New Listings

