Archive for October 2023
A Return To The Question Of Whether To Take Your House Off The Market For The Holidays |
|
 For a few years now, just about every new listing was going under contract in a matter of days, regardless of the time of year it was listed for sale. Big house, small house, high price, low price, good condition, not so good condition, big yard, small yard, flat driveway, steep driveway, optimistically priced, realistically priced, listed in April, listed in December -- everything was going under contract quickly. But now, some homes are coming on the market and are NOT going under contract right away. It might have even been 30, 60 or 90 days that some have been on the market without a buyer making an offer. Some such sellers are now returning to the question of whether to take their property off the market for the holidays. After all, if we aren't having many showings, maybe it makes sense to take the house off the market for a few months and start afresh in early Spring? It will be interesting to see if inventory levels drop as we get past Thanksgiving and/or as we get past Christmas. In years gone by we would often see these houses that were coming off the market for the holidays either vanishing in mid/late November (just before Thanksgiving) or in mid December (just before Christmas). | |
The Spotswood High School District Has The Highest Priced Current Listings |
|
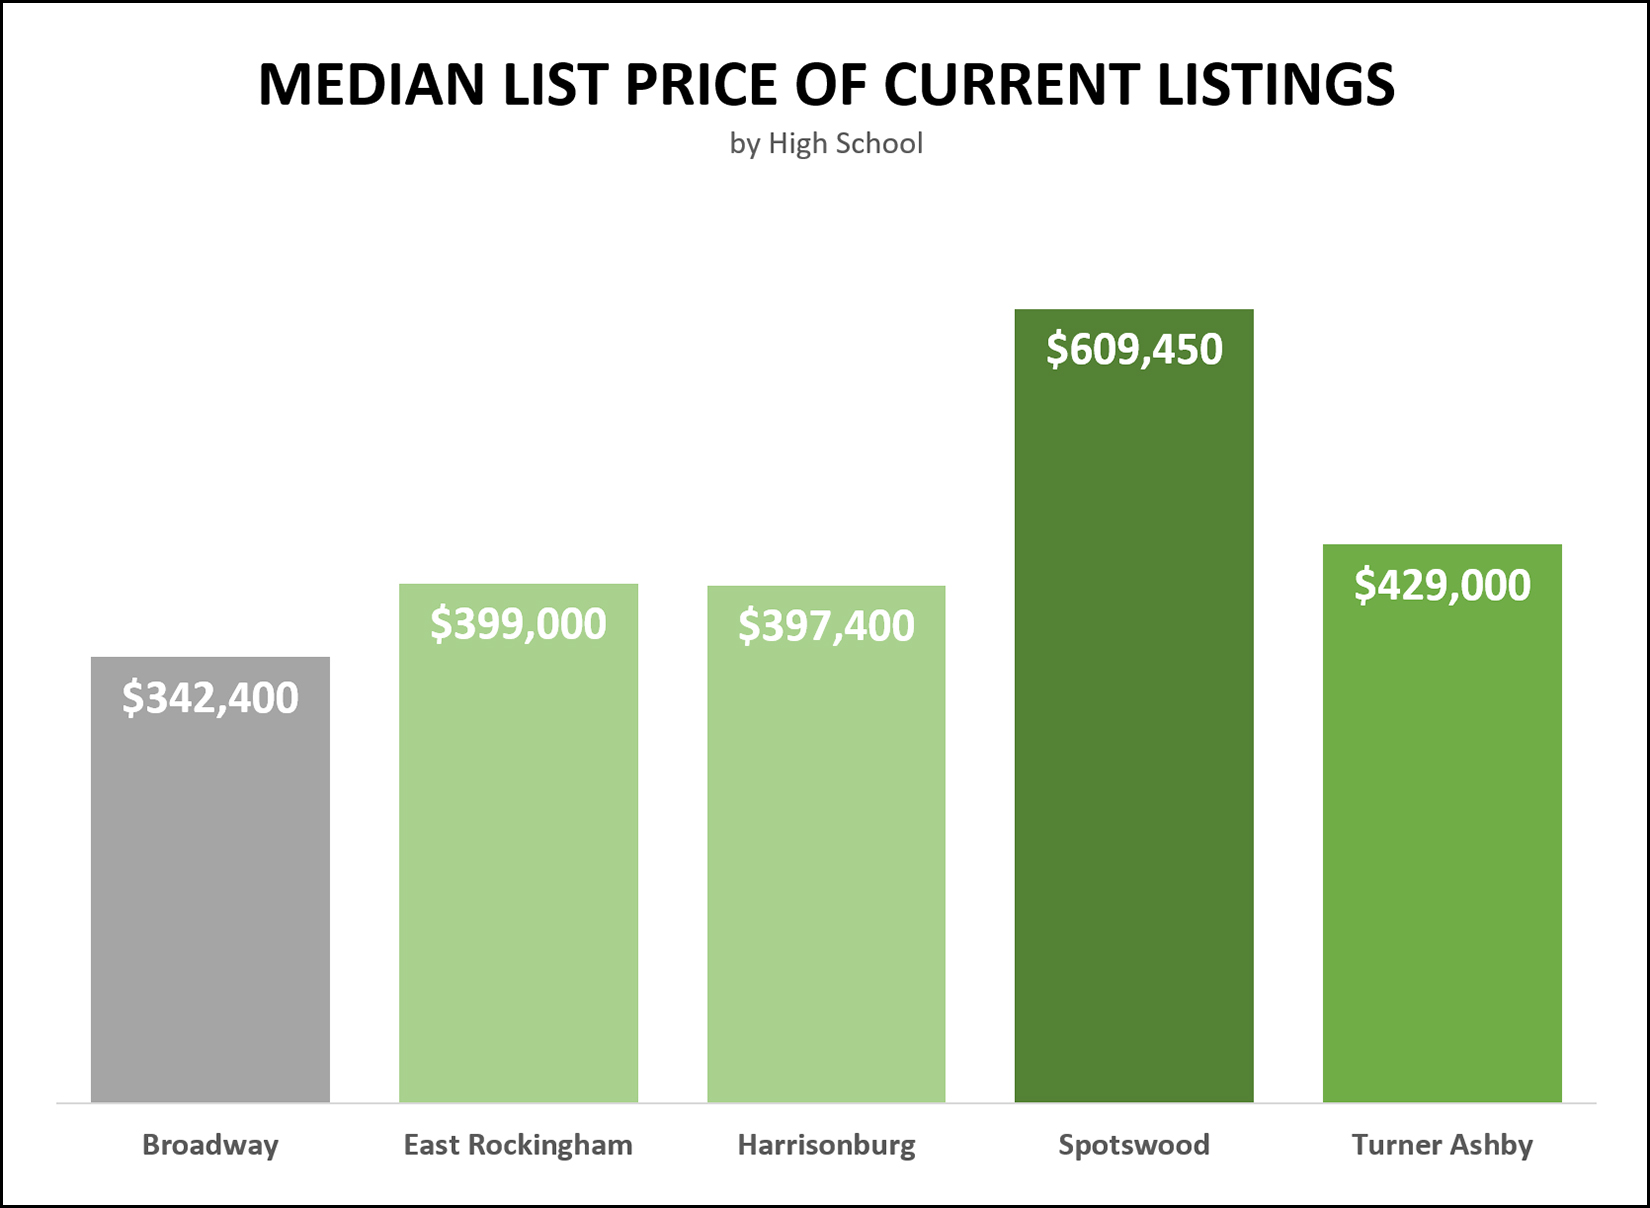 The graph above takes a look at the list prices of current listings of resale (not new) homes for sale in Harrisonburg and Rockingham County. The price shown is the median list price, so as to say that... In the Broadway High School district, half of the current listings are priced at or above $342,400 and half are priced at or below $342,400. Likewise... In the Spotswood High School district, half of the current listings are priced at or above $609,450 (!) and half are priced at or below $609,450. | |
Contract Activity Up Five Percent In October 2023 And Other Also Accurate Headlines |
|
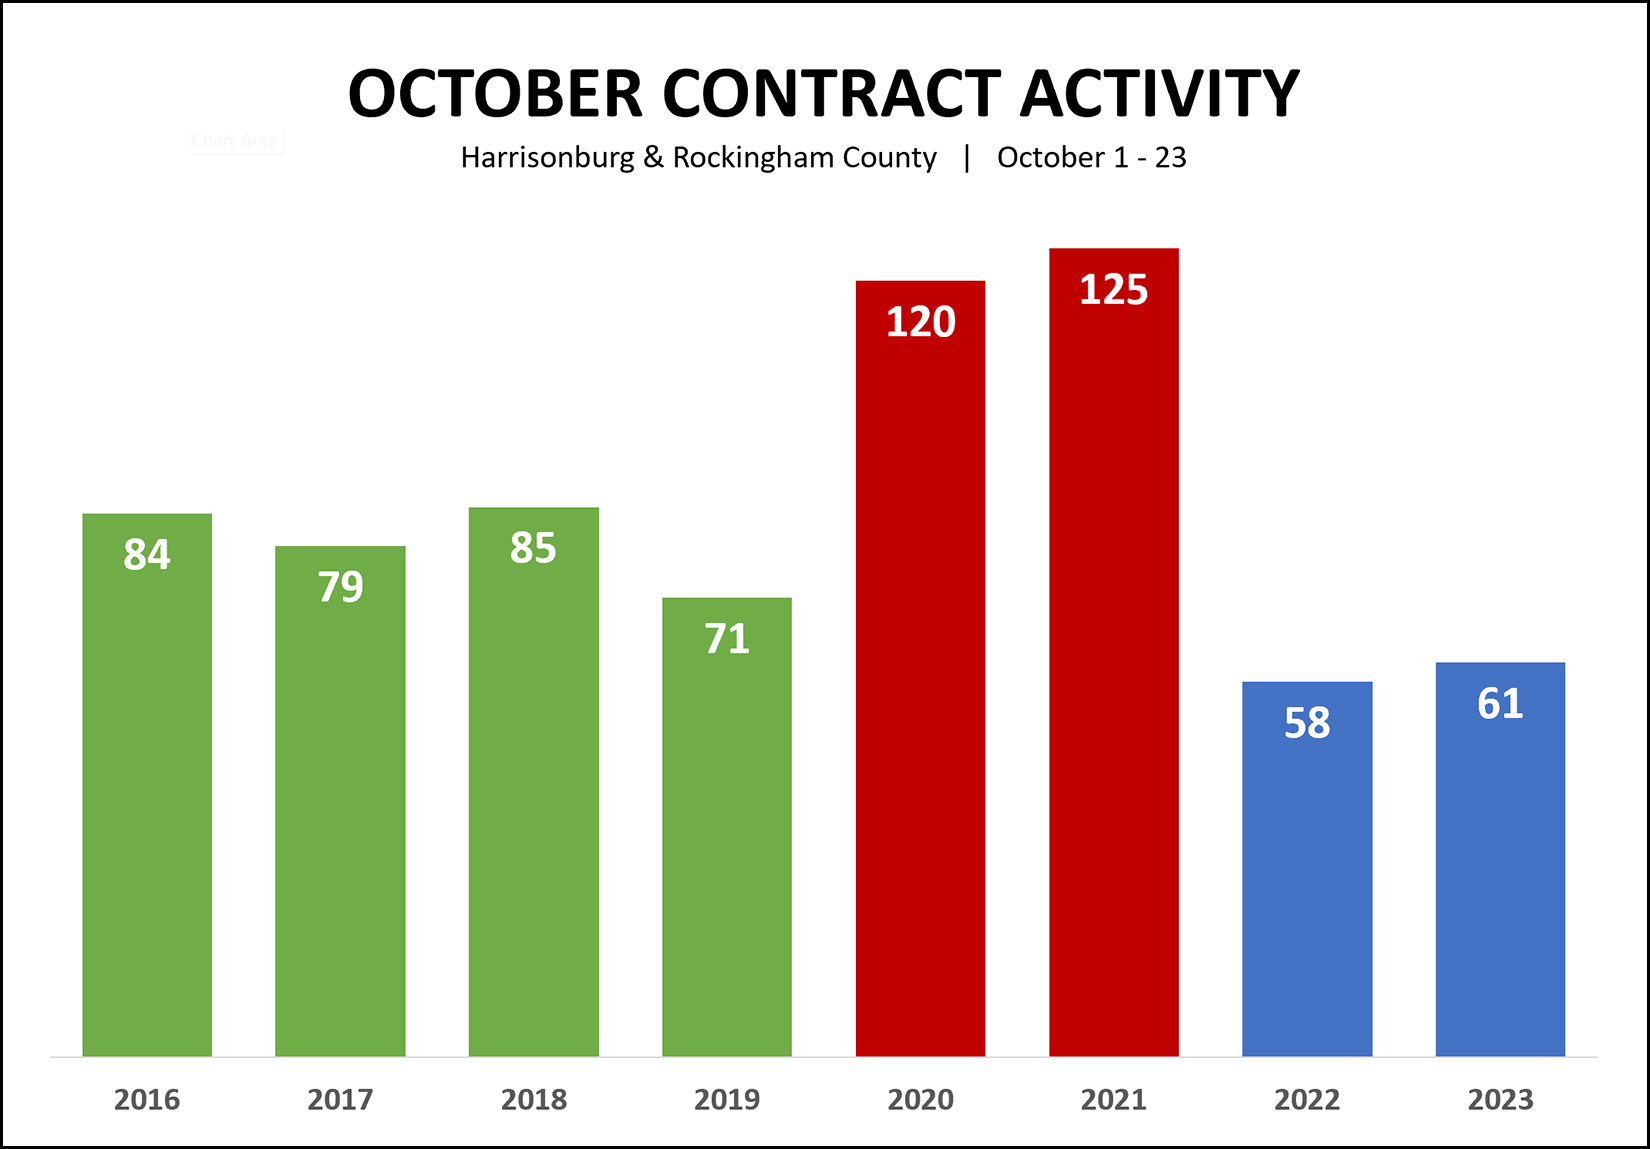 These are all true... [1] Contract Activity Up 5% In October 2023 Compared To October 2022. [2] Contract Activity Down 51% In October 2023 Compared To October 2021. [3] Contract Activity Down 24% In October 2023 Compared To Pre-Covid Norms. Without numbers, I'd summarize them all as follows... October contract activity is about on par with last October, a decent bit slower than pre-Covid levels and much, much lower than during the home buying (and selling) frenzy of the Covid times of 2020 and 2021. | |
How Much Growth Are We Seeing In Harrisonburg And Rockingham County? |
|
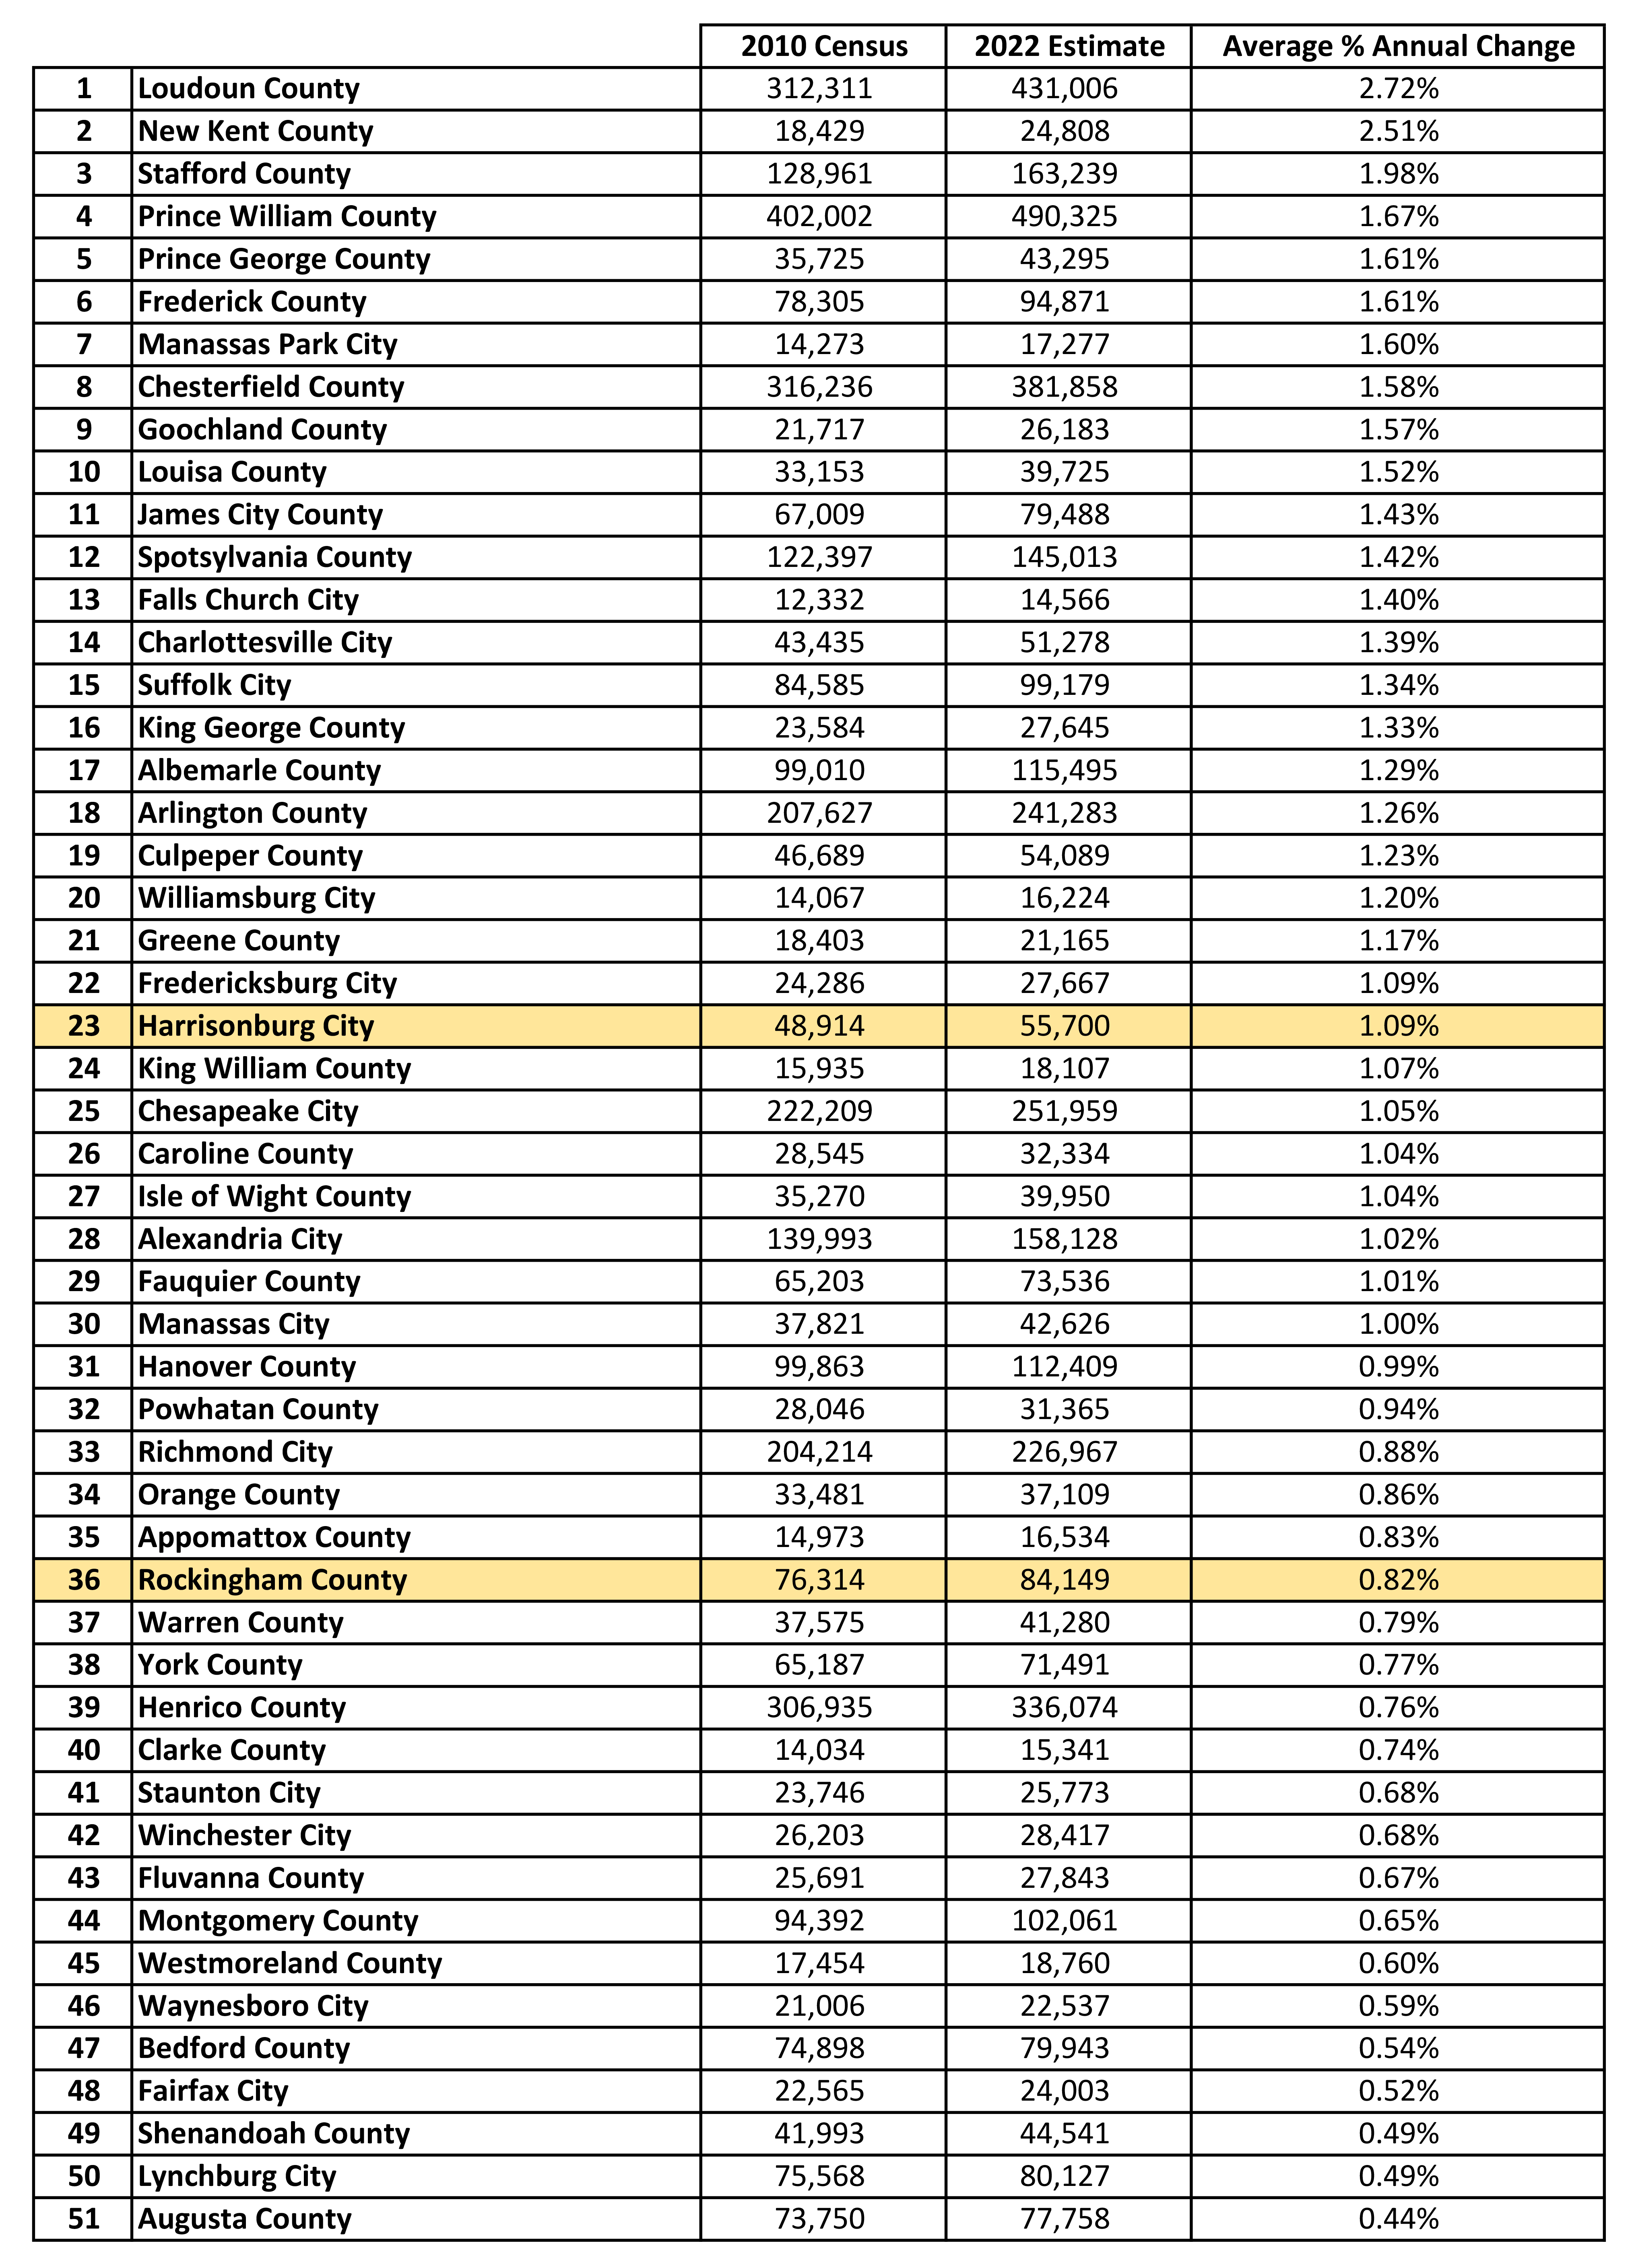 Some localities in Virginia, such as Loudoun County, are growing quite quickly. Loudon County is tops on the list for population growth over the past 12 years as shown above. The average annual growth rate shown above is calculated by comparing 2010 census data with 2022 population estimates, all from the Weldon Cooper Center. What do we learn from the data table above? [1] The population of City of Harrisonburg has grown an average of 1.09% per year over the past 12 years. [2] The population of Rockingham County has grown an average of 0.82% per year over the past 12 years. [3] Our growth rate (and our population) are quite a bit lower than Loudoun County, which is tops on the list above. The population of Loudoun County has grown by an average of 2.72% per year over the past 12 years and is now estimated to be 431,006. [4] The City + County population is currently around 139,849. [5] If the City maintains the current 1.09% growth rate, it will grow from 55,700 to about 62,069 over the next decade. [6] If the County maintains the current 0.82% growth rate, it will grow from 84,149 to about 91,289 over the next decade. [7] Combining the City and County numbers above, current trends point to our area's population growing from 139,849 to 153,358 over the next decade. [8] Put differently, this potential growth over the next decade (139,849 to 153,358) equates to about 1,351 new people in the City or County each year. All of that (above) relates to how much we have been growing in the recent past -- and how much we are likely to grow in the near future. But as to if we should be growing, and how much we should be growing, that is a very different question with plenty of potential opinions and perspectives depending on who you ask. | |
How Should Harrisonburg and Rockingham County Think About The School Impact Of Previously Approved, Unstarted, Residential Developments? |
|
 In reviewing a recently proposed rezoning request for a new residential development, I found this insightful comment from Rockingham County Public Schools... "This property is located in the Spotswood High School District. RCPS estimates this would generate an additional 25 students at Cub Run Elementary, 13 students at Montevideo Middle School, and 16 students at Spotswood High School. With proposed redistricting in the next year, each school will have the capacity to handle this increase in enrollment. However, it should be noted, that we estimate the cumulative effect of this development and others approved in the last 3 years once all are 100% built out would bring Cub Run near capacity." The last part is interesting and I don't know how the County plans to handle this situation... "However, it should be noted, that we estimate the cumulative effect of this development and others approved in the last 3 years once all are 100% built out would bring Cub Run near capacity." I believe this dynamic exists in both the City and County at the moment. If most or all residential developments that have been approved are built in the next few years then quite a few schools would likely be at or over capacity. I'm not sure how the County (or the City) should factor that dynamic into decisions about whether to approve additional proposed developments. Should the County and City assume that all approved developments will be built soon, and hesitate to approve more based on the theoretical potential cumulative impact of the developments that have not begun? Should the County and City ignore the potential cumulative impact of developments that have not begun and evaluate each new rezoning proposal based solely on the direct impact on schools for that one development? Perhaps they need to be somewhere in between these two extremes? Most new developments -- on their own -- won't cause a school or schools to be beyond capacity. If all approved and proposed new developments are built within the next few years it seems likely that some or many schools would be at or beyond capacity. But many (most?) approved developments have not been started... it is unclear if or when many of them will be developed. | |
The Influence Of Mortgage Interest Rates On Who Will Buy Or Sell |
|
 Mortgage interest rates -- and whether they are high, or low, or higher, or lower -- are not the only or even the primary factor affecting any given real estate market -- but they do play a role. Between May 2019 and March 2022, when 30 year fixed mortgage interest rates were below 4%, many (many!) buyers were pulled into the market. They were eager to buy a home while the cost of money so low. They were excited by how much house they could buy within their budget. They were delighted by how low of a mortgage payment they would have based on these low rates. Since September 2022, while 30 year fixed rate mortgage interest rates have been above 6%, many buyers are sitting on the sidelines, unable or unwilling to pay the mortgage payment that would be associated with purchasing a home and financing it at 6% or 7% or 8%. The pool of would-be home buyers has shrunk considerably AND the pool of would-be home sellers has shrunk as well. Homeowners who might sell are reconsidering selling as that would often involve paying off a mortgage with a rate below 4% and then financing a new purchase with a rate above 7%. But... looking ahead... will rates have to get all the way back down to 4% or below to spur a solid increase in the number of buyers in the market? Maybe not. Mortgage interest rates have now been above 7% for two months. It seems likely that they could stay above 7% well into 2024. But when rates do start declining -- at some point -- home buyers will likely start returning to the market in solid numbers as they decline. We were below 4% for three years... so 6% and 7% seem quite high. If stay above 7% for a year... then 6% won't seem bad at all! Whether mortgage interest rates are high or low seems to mostly be understood or felt within a recent context of where rates have been for the past year or two. Just as current (above 7%) mortgage interest rates are keeping some or many buyers out of the market -- I suspect once we get back down into the 6% range we will likewise start to see buyers pulled back into the market and sellers considering the sale of their home after all. | |
Why Has The Median Sales Price Of Attached Homes Increased 20% In A Year? |
|
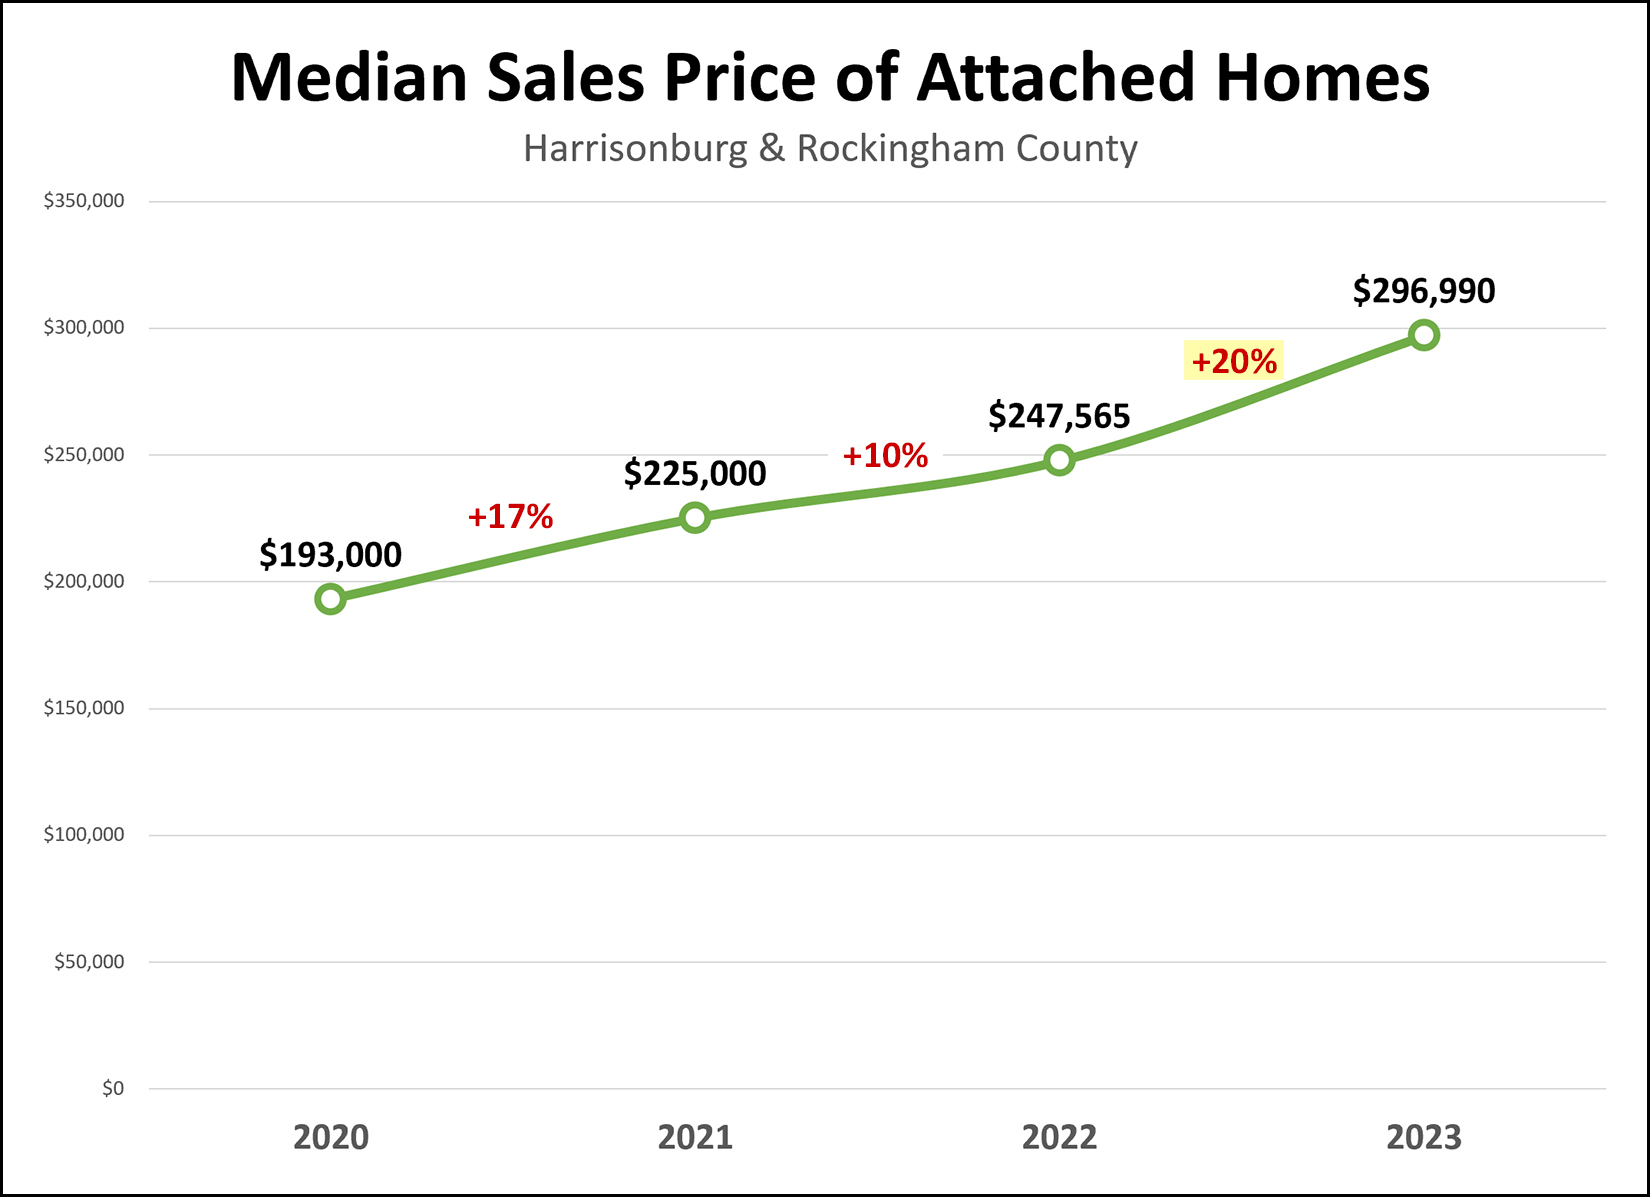 Spoiler alert - I have no concrete answers to the question above. :-) The median sales price of attached homes (duplexes, townhomes, condos) was $247,565 in 2022. Thus far in 2023, the median sales price is $296,990. This marks a 20% increase in the median sales price of attached homes over the past year. How could this be? The overall median sales price in our market (detached homes and attached homes) has risen 10% in that same timeframe -- so why has the median sales price of attached homes risen 20% rather than 10%? My theory - which I have now proven to be wrong - was that the median sales price was rising because we were seeing more new attached homes selling in 2023 at higher prices, causing the median sales price to rise. Certainly, if 20% of attached homes were new homes in 2022 and 40% were new homes in 2023 then it would not be surprising to see the median sales price rise since the prices of new homes are almost always higher than the prices of resale homes. But, here's what the data actually shows... 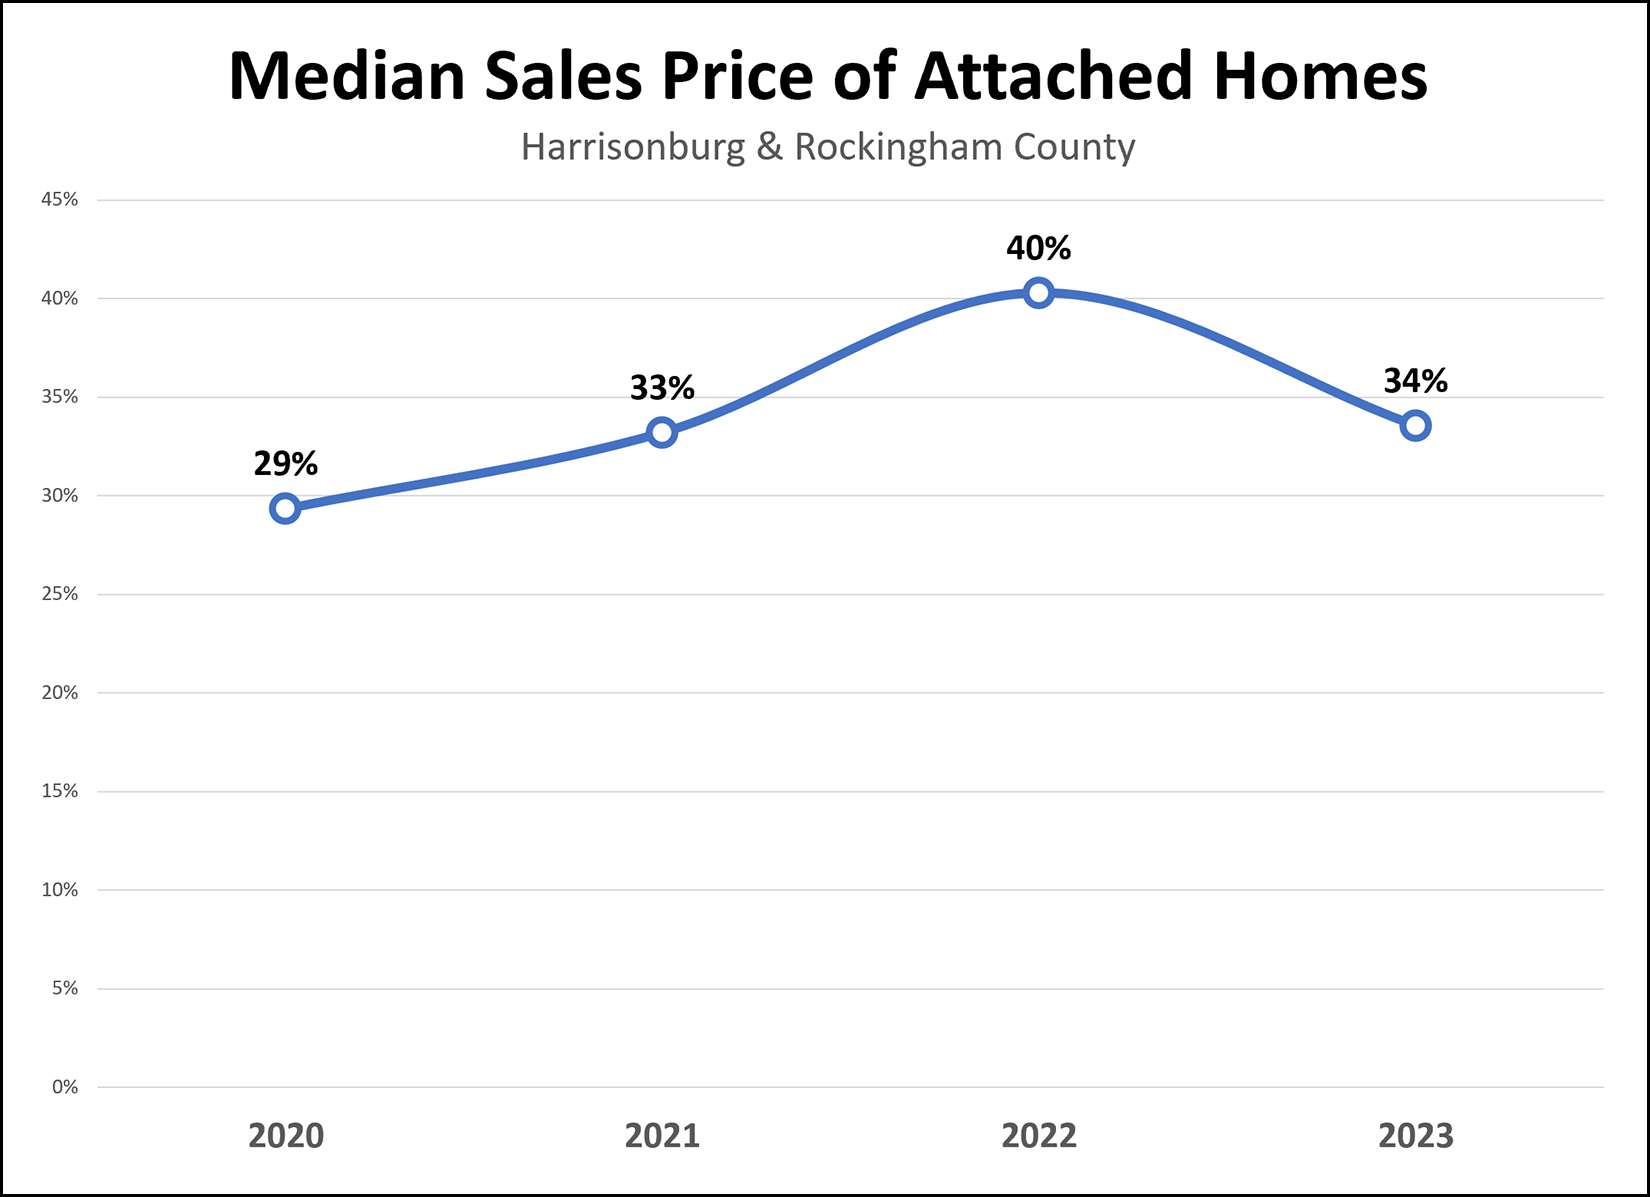 So, again, comparing attached home sales in 2022 and 2023... 2022 - median sales price of $247,565 with 40% being new homes 2023 - median sales price of $296,990 with 34% being new homes So, it seems we can't necessarily attribute the unexpectedly high (20%) increase in the median sales price of attached homes in 2023 to a larger portion of those home sales being new homes. Darn. Theory #1 has been refuted. Anyone have any other theories? | |
The Annual Pace Of Home Sales Has Fallen 27% Since June 2022 |
|
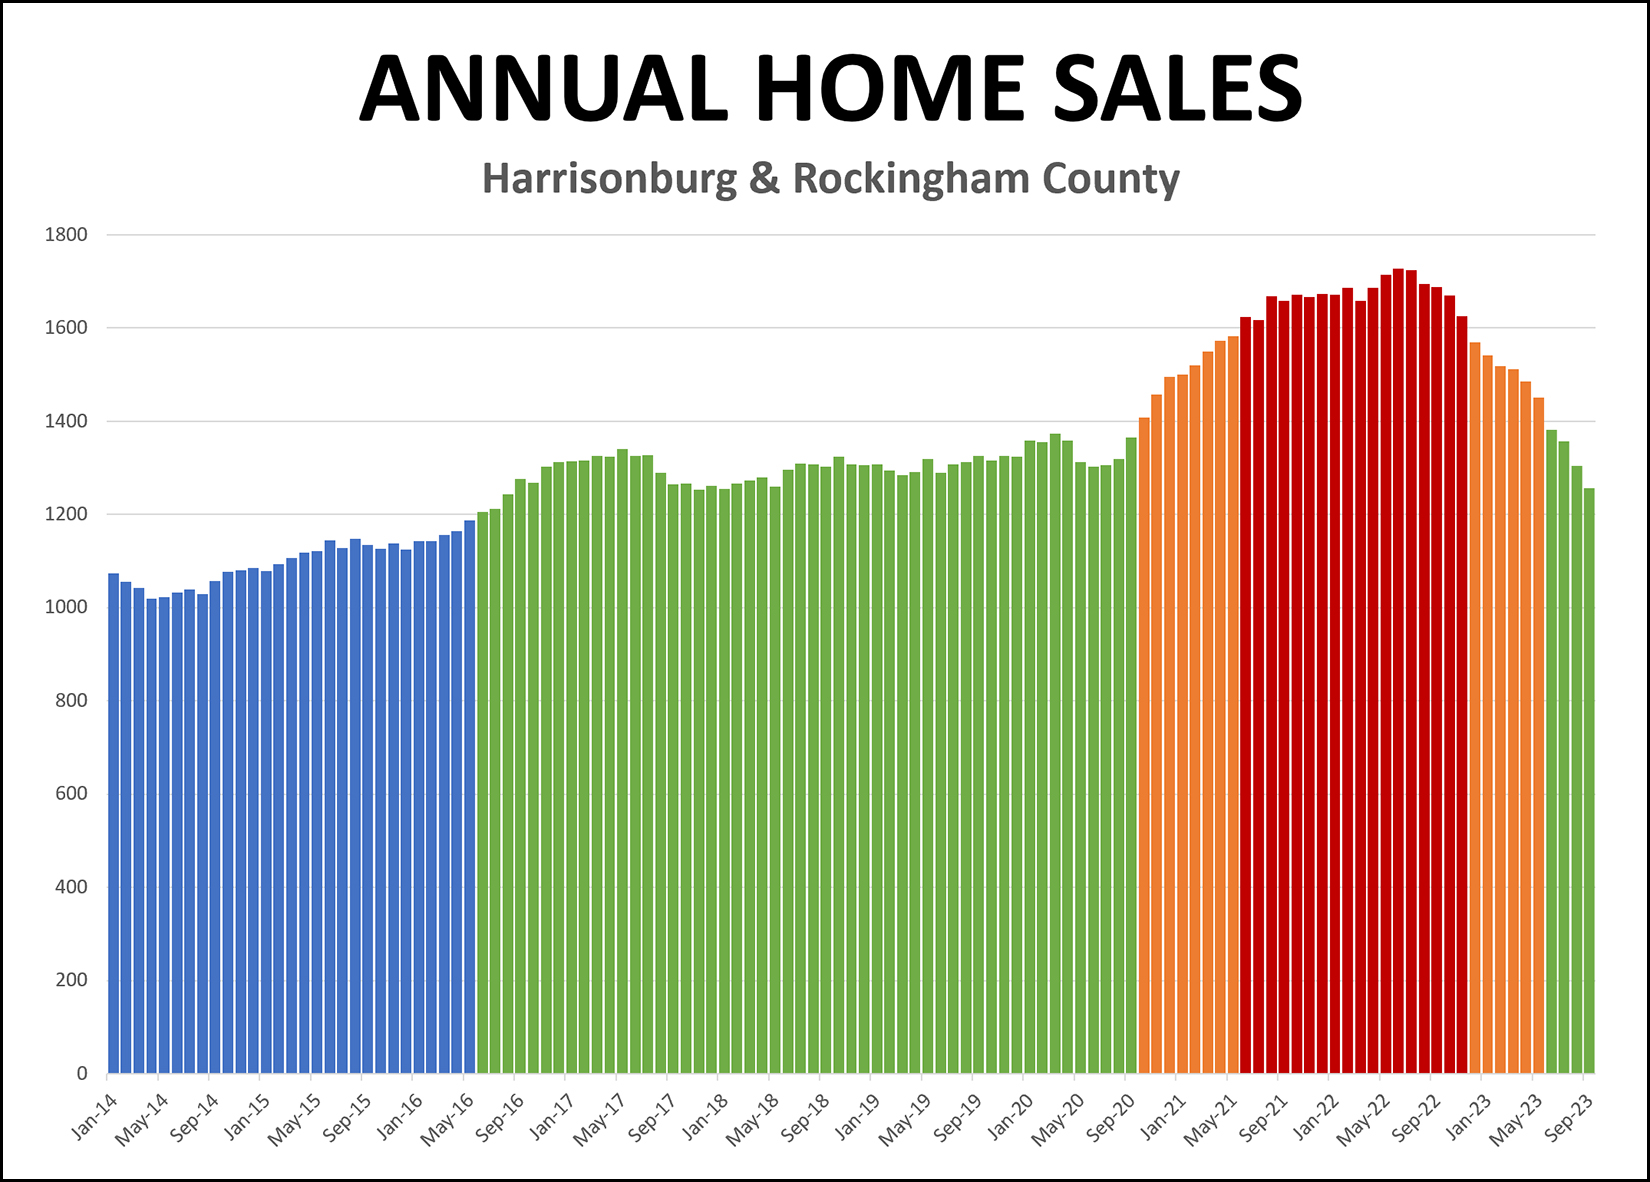 In June 2022 the annual pace of home sales activity in Harrisonburg and Rockingham County peaked at 1,727 home sales in the previous 12 months. Now, as of the end of September, the annual pace of home sales has dropped back down to 1,256 home sales in the past 12 months. That decline from 1,727 annual sales down to 1,256 annual home sales marks a 27% decline in the number of homes are selling in a year's time in Harrisonburg and Rockingham County. But... it may just be a retreat from a historically odd time. Prior to the onset of the COVID-19 pandemic, we had been seeing between 1,200 and 1,400 home sales per year for about four years... from 2016 through 2020. Those years are marked by the wide swath of green bars on the graph above. Prior to 2016 we were seeing fewer than 1,200 home sales a year, as shown by the blue bars on the graph above. But then, in 2020... [1] COVID-19 happened, and overnight everyone was asking their home to serve more purposes than ever. Students were learning from home. Adults were working from home. [2] Mortgage interest rates dropped below 3% and mostly stayed there for a year and a half. The two factors above (among others) fueled our local housing market (and many others) to rise to new heights -- as shown by the orange and red portions of the graph above. But by mid 2022, mortgage interest rates were rising, and then rising again, and then rising some more... all while home prices were continuing to rise to unprecedented new heights. So, perhaps it is rather unsurprising that we have seen a 27% decline in the annual pace of home sales as of the end of September. Two notes... [1] Being in the 1,200 to 1,400 range we are in what was a normal range for home sales for 2016 - 2020. [2] It is likely that the annual pace of home sales will fall further, possibly below 1,200. This will put us back in the normal range for home sales for 2014 - 2016. | |
Leighton Place, To Include 150 Townhomes And 180 Apartments Proposed On Stone Spring Road Across From Preston Lake |
|
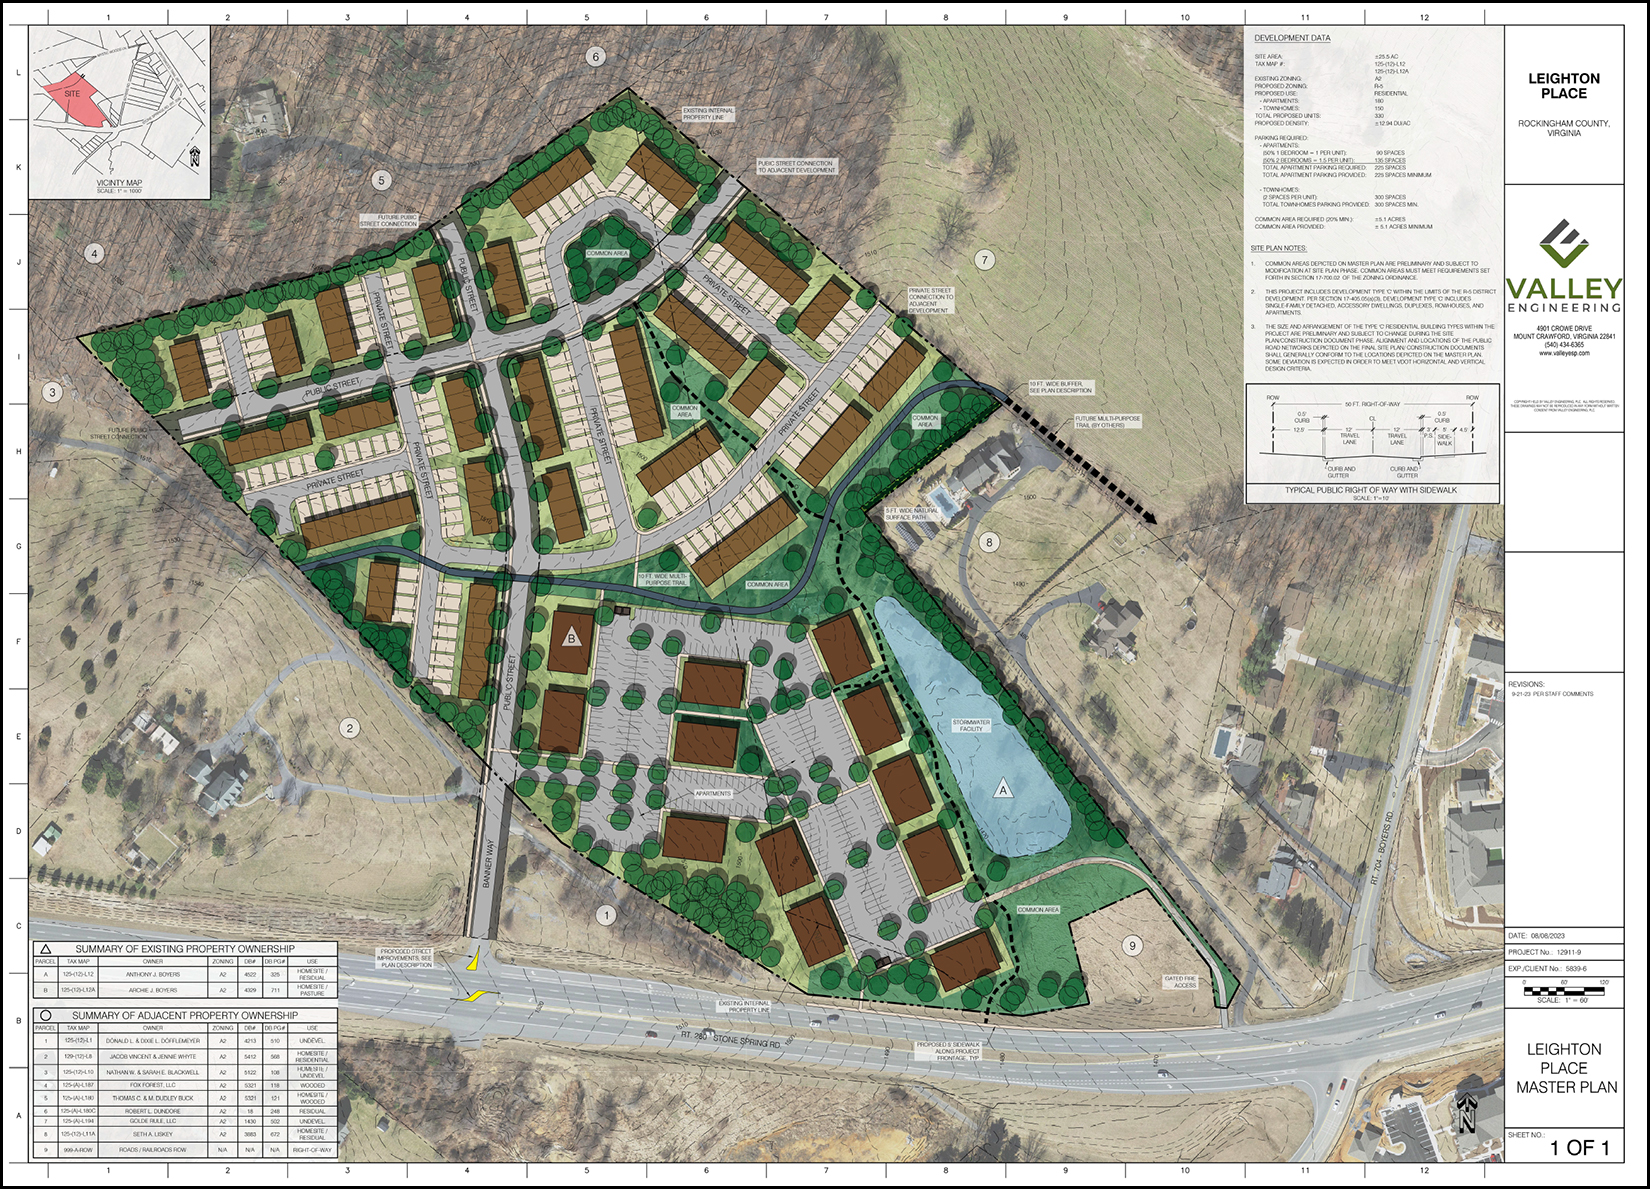 We may soon see another residential development near the intersection of Stone Spring Road and Spotswood Trail. Two parcels totaling 25.5 acres are currently zoned A-2 but a developer is proposing that they be rezoned R-5 to allow for the construction of 330 residential units to include 150 townhouses and 180 one and two bedroom apartments. Here's where the new development is being proposed... 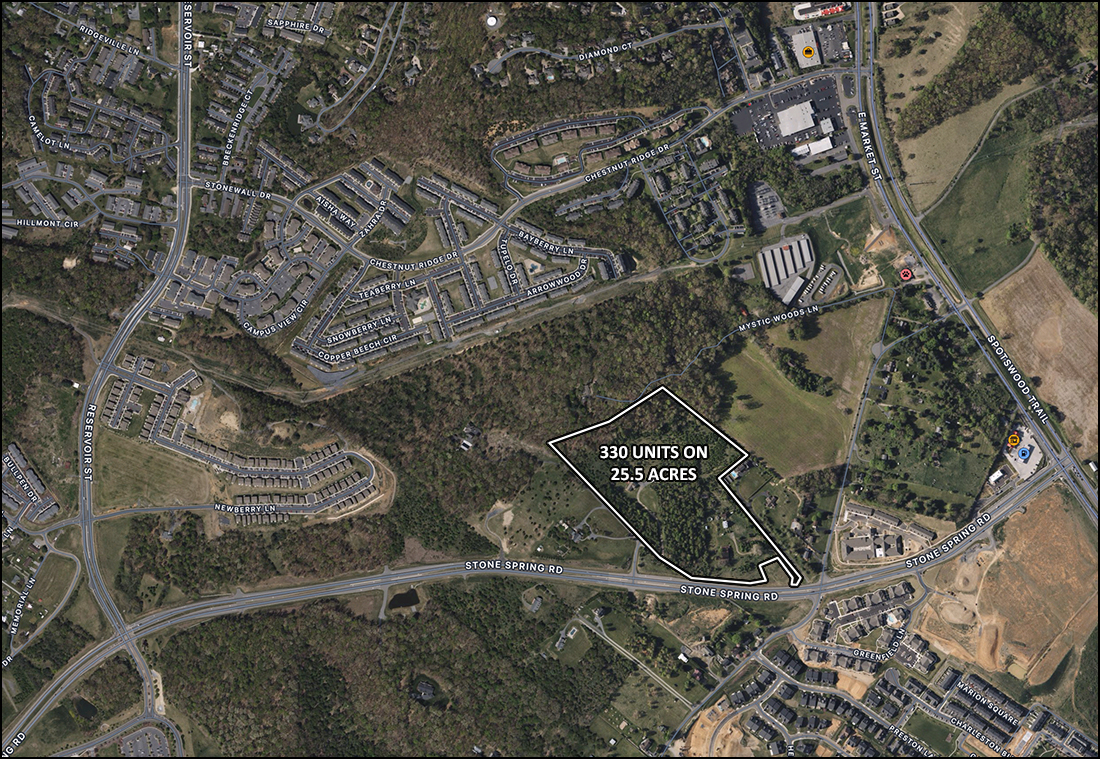 The rezoning application and other documents prepared by the County can be viewed here. This new proposed development -- Leighton Place -- is immediately adjacent to the 280 unit rental community, Stone Ridge Crossing, that was approved last month by the Board of Supervisors. | |
Fewer Home Sales, Rising Inventory Levels And Possible Slowing In Sales Price Gains |
|
 Happy October, Friends! October is one of my favorite months of the year... for quite a few reasons... 1. Cool mornings, warm afternoons and then cool evenings again. 2. Beautiful changing colors of fall leaves. 3. Pumpkin pie! 4. My birthday. ;-) 5. Coaching middle school volleyball. 6. Apple cider. 7. Watching JMU football games. Goodness, there have been some stressful ones this season, though not this past weekend!  Is October a favorite month for you as well? What would be on your list? While you're building your own list of all the reasons why October is amazing, let me mention my monthly giveaway, of sorts, for readers of this market report, highlighting some of my favorite places, things or events in Harrisonburg. Recent highlights have included Taste of Thai, Merge Coffee and Jimmy Madison's. This month I am giving away a $50 gift certificate to Hank's Grille, located in McGaheysville. I enjoyed a delicious meal this weekend of pork BBQ with baked beans and macaroni and cheese on the side, rounded out with some pecan pie. If you haven't been to Hank's Grille, you should go check it out... whether you win the gift certificate or not! Click here to enter to win a $50 gift certificate! And now... on to the data, and charts and graphs... 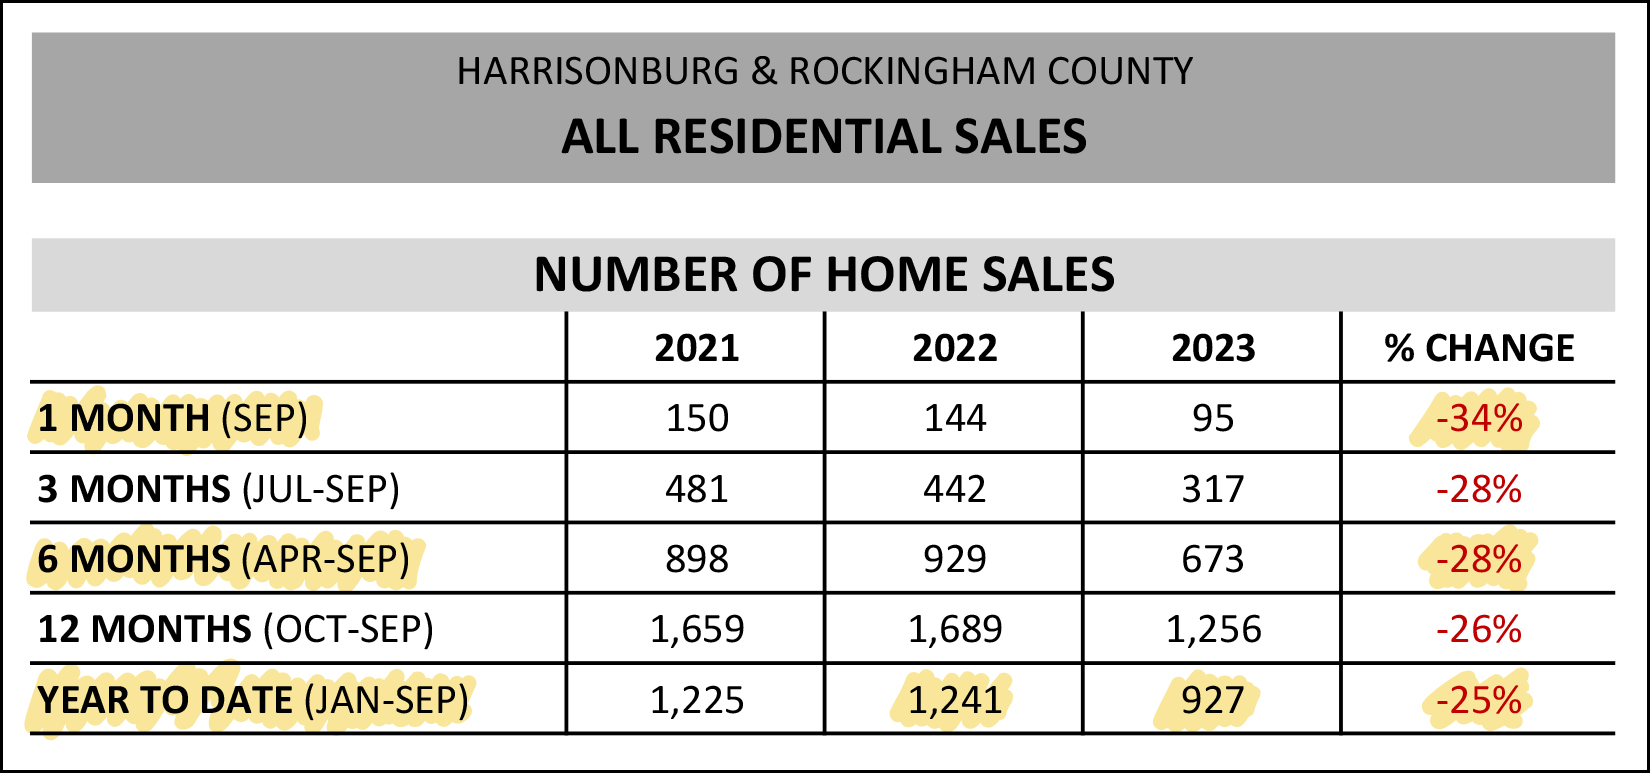 OK, my highlighting on the chart above requires a bit of explanation. Let's work our way from the bottom of the chart upwards... [1] Year to date we have seen 927 home sales, which is 25% fewer than the 1,241 home sales we saw in the first nine months of last year. [2] When we look just at the past six months (April through September) we have seen a slightly larger 28% decline in the number of homes selling in Harrisonburg and Rockingham County. [3] When we look just at September (while keeping in mind that a small data set can lead us to erroneous conclusions) we'll see a 34% decline in the number of homes that are selling. So, far fewer homes (at least 25% fewer) are selling in Harrisonburg and Rockingham County this year as compared to last. But what about the prices of those homes that are selling? 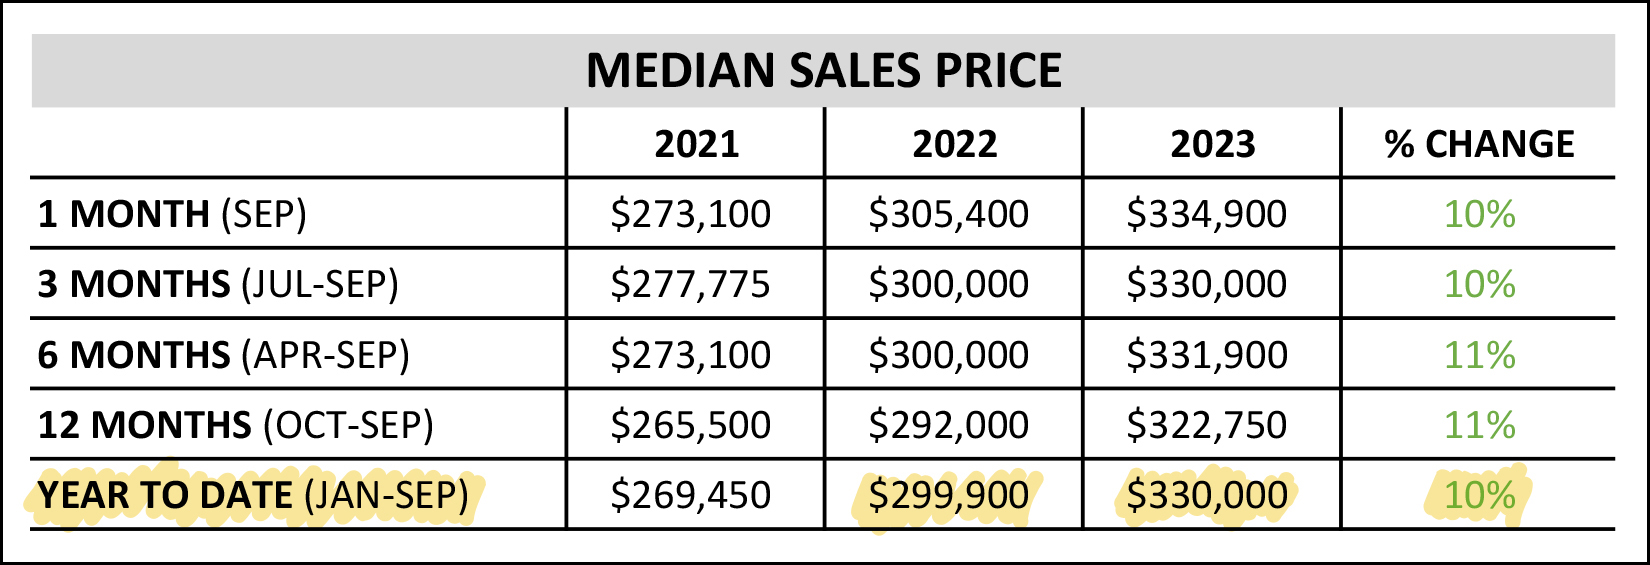 The prices, it seems, keep on rising, no matter how we slice and dice the data from a timeframe perspective. As shown above, the median sales price has increased 10% this year to date as compared to last year to date. When we look at a shorter timeframe (six months, three months, one month) we still see a double digit (10% - 11%) increase in the median sales price. All that said, later in this report I'll take a look at only detached home sales where we are starting to see a slightly different trend in median sales prices. I know... quite the build up... but don't skip ahead... keep reading. :-) These next numbers can be quite easily taken out of context... 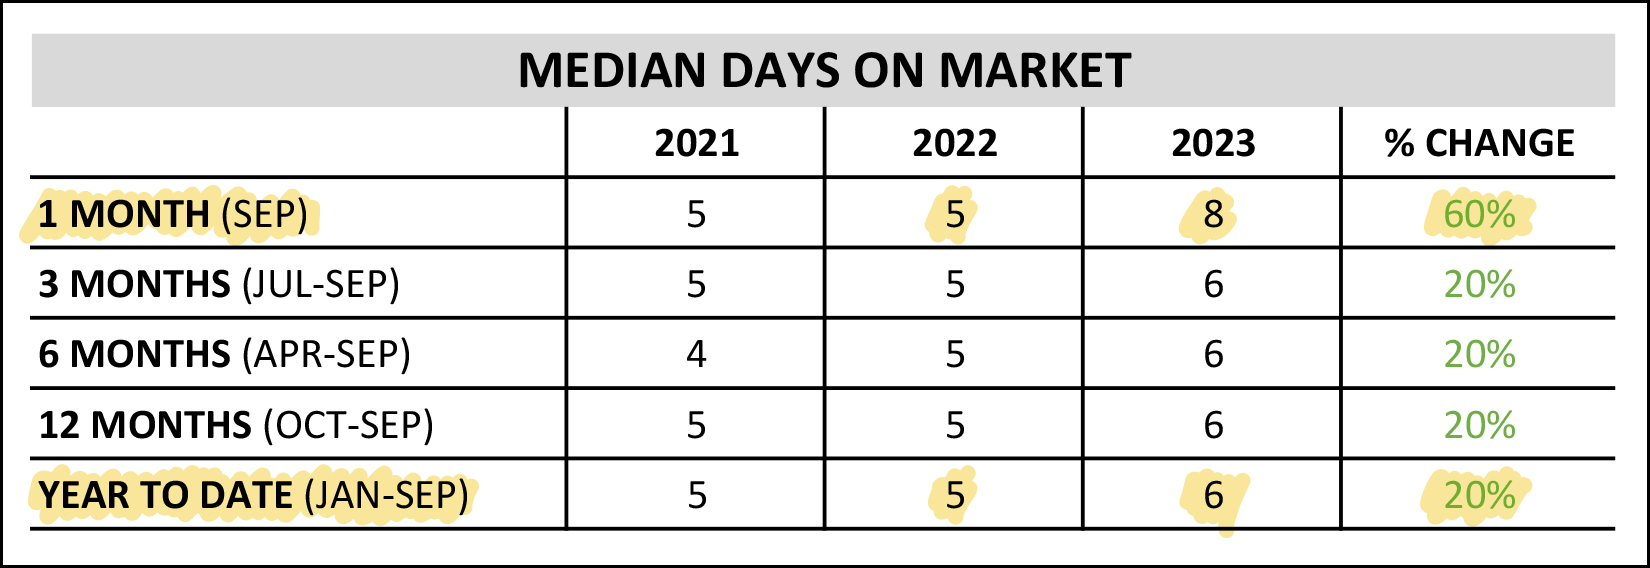 The median time that it takes for a home to go under contract (days on market) increased 60% in September 2023! Gasp! ;-) It's actually not as much of a story as you might think. Median days on market was five days last September and is eight days this September. Yes, that is a 60% increase... but eight days is still quite low and doesn't mark too much of a shift in how quickly homes are going under contract. Most sellers are just as delighted to have their home under contract in eight days even if it isn't under contract in five days. Also, above, you'll see that year to date the median days on market has only increased from five days to six days. Another graph below will put these numbers in a larger (longer) context. More suspense, I know. Now, on to some graphs for the visual learners amongst us... 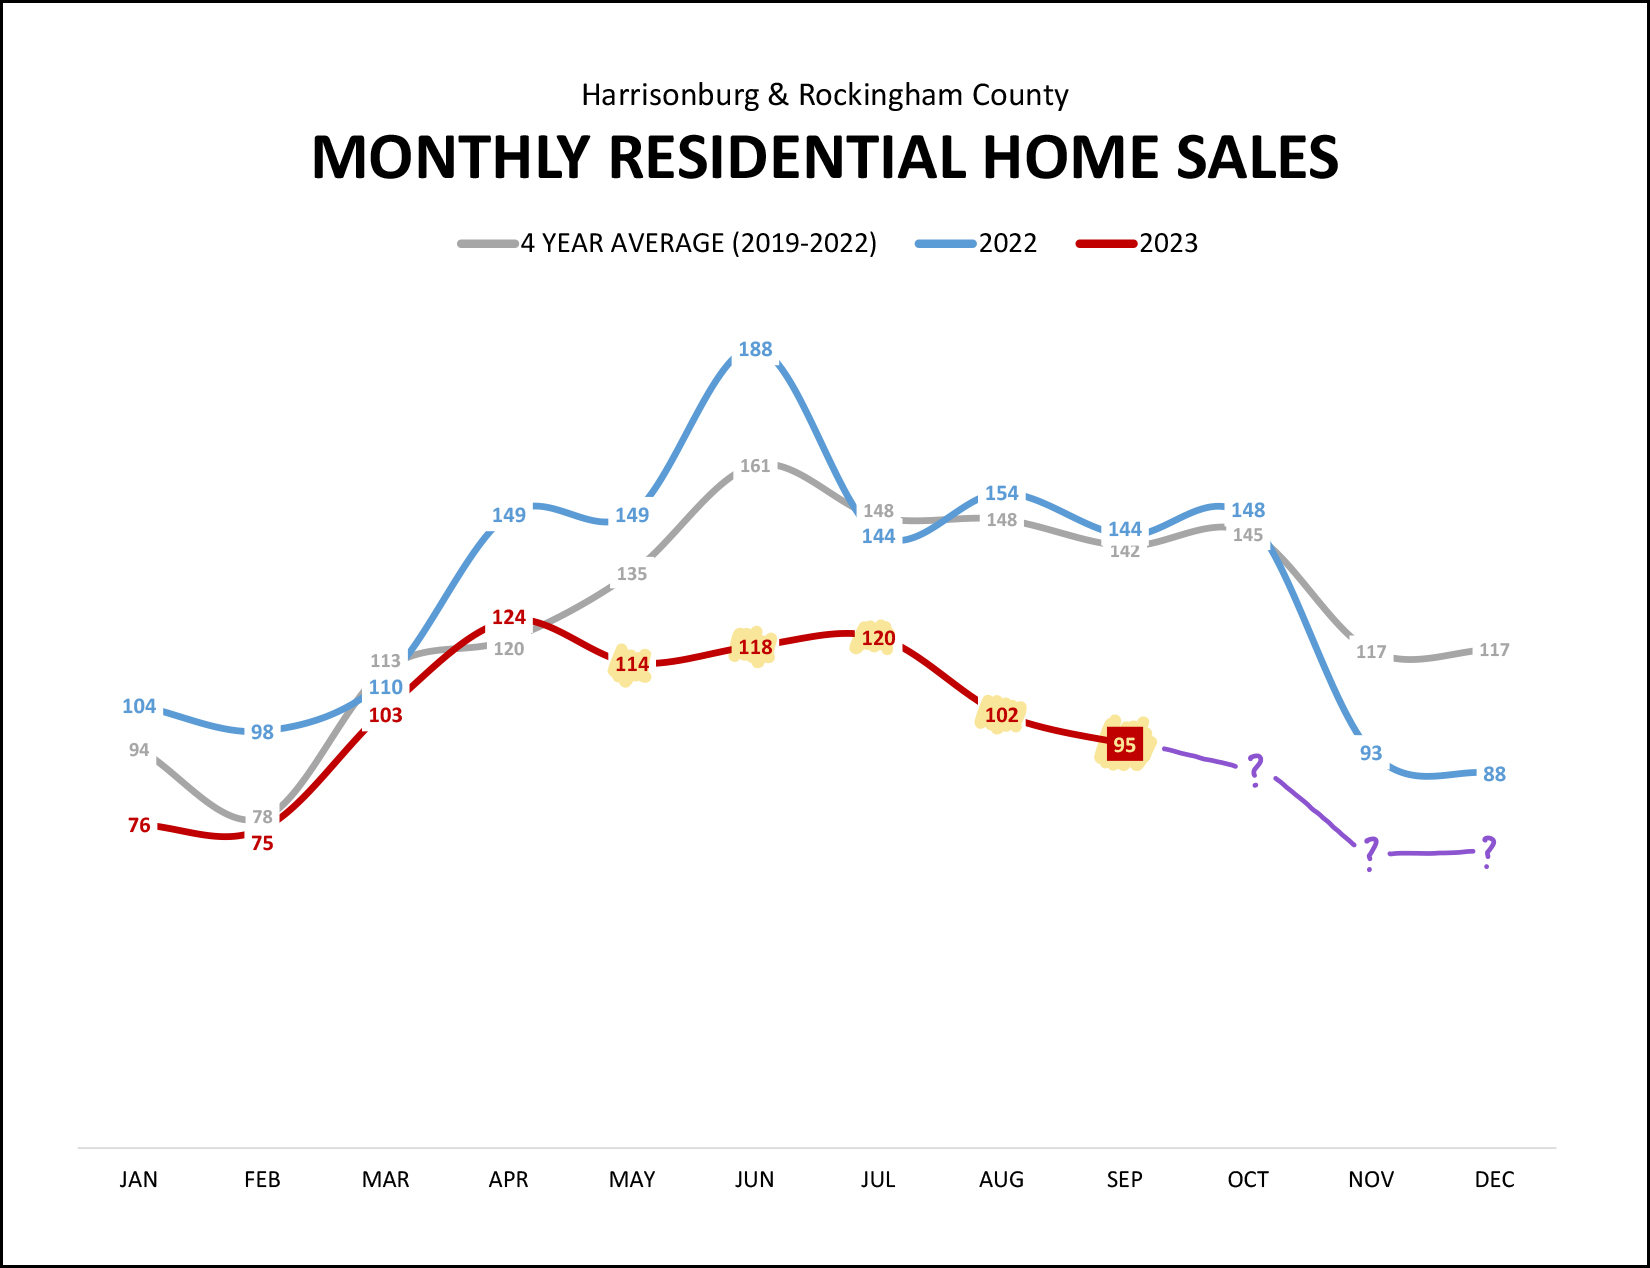 After a normal-ish January through April, we have been seeing far fewer home sales each month thereafter. May through September makes five months in a row where we saw significantly fewer home sales as compared to the same month last year (blue line) and as compared to the average of the past four years (grey line). Looking ahead, on the graph above, I think it is reasonable to assume we will continue to see slower months of home sales in October, November and December as compared to recent years. As I have pointed out in the past, this slow down in home sales seems to be a result in changes on both the supply and demand side of the housing market... SUPPLY - We are seeing fewer sellers willing to sell their homes as they don't want to give up their likely low mortgage interest rate in the 3% to 4% range. DEMAND - We are seeing fewer buyers willing or able to buy homes given the current higher mortgage interest rates in the 7% to 8% range. Now, then, for even more context... let's see how home sales have fallen... 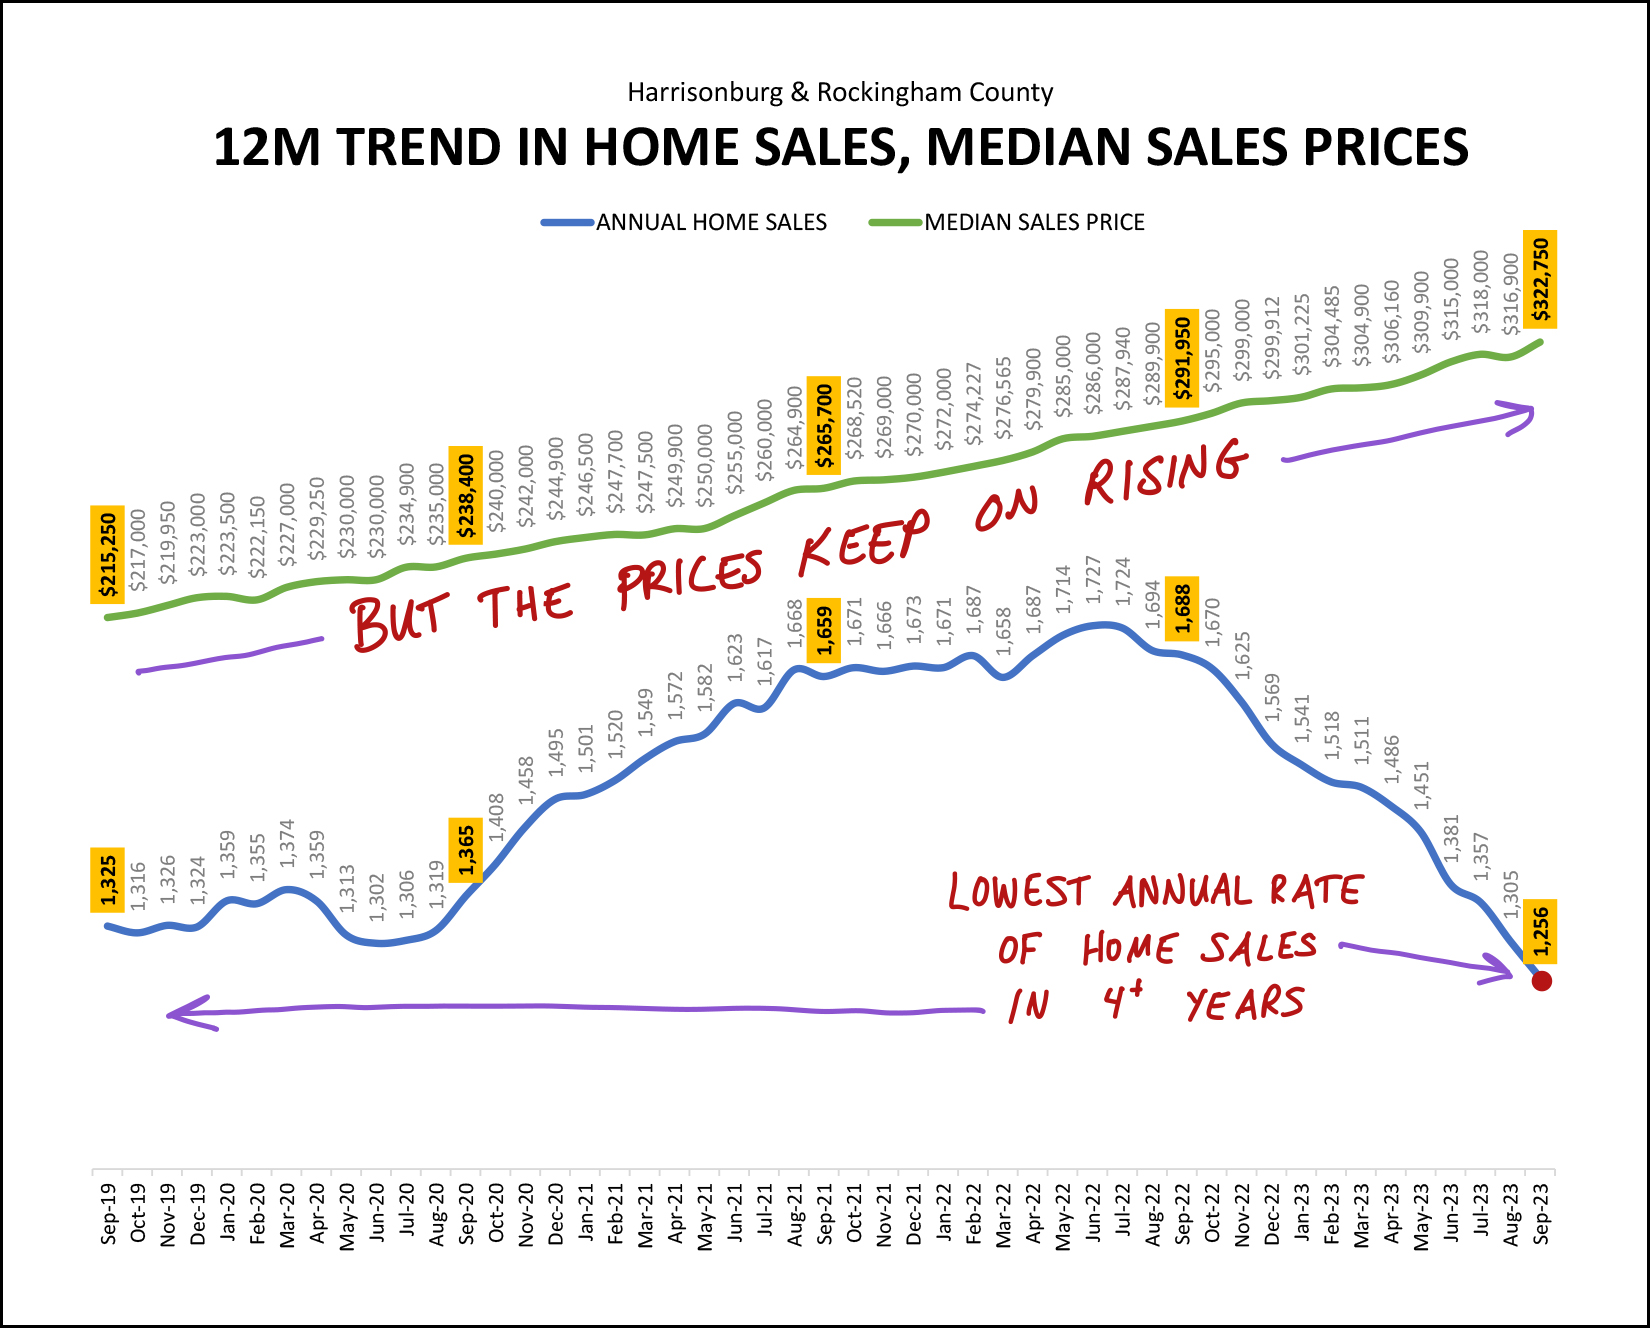 The blue line above shows the number of home sales in a year's time. That annual rate of home sales was hovering in the 1,300's pre-Covid and then surged up to a high of 1,727 in summer 2022. Now, however, we have seen the annual rate of home sales decline all the way below 1,300 home sales a year which is the lowest annual rate in over four years! But yet -- enter the green line -- the median sales price of those homes keeps on rising! However, maybe we are starting to see a slight change in the trajectory of the median sales price? See below... 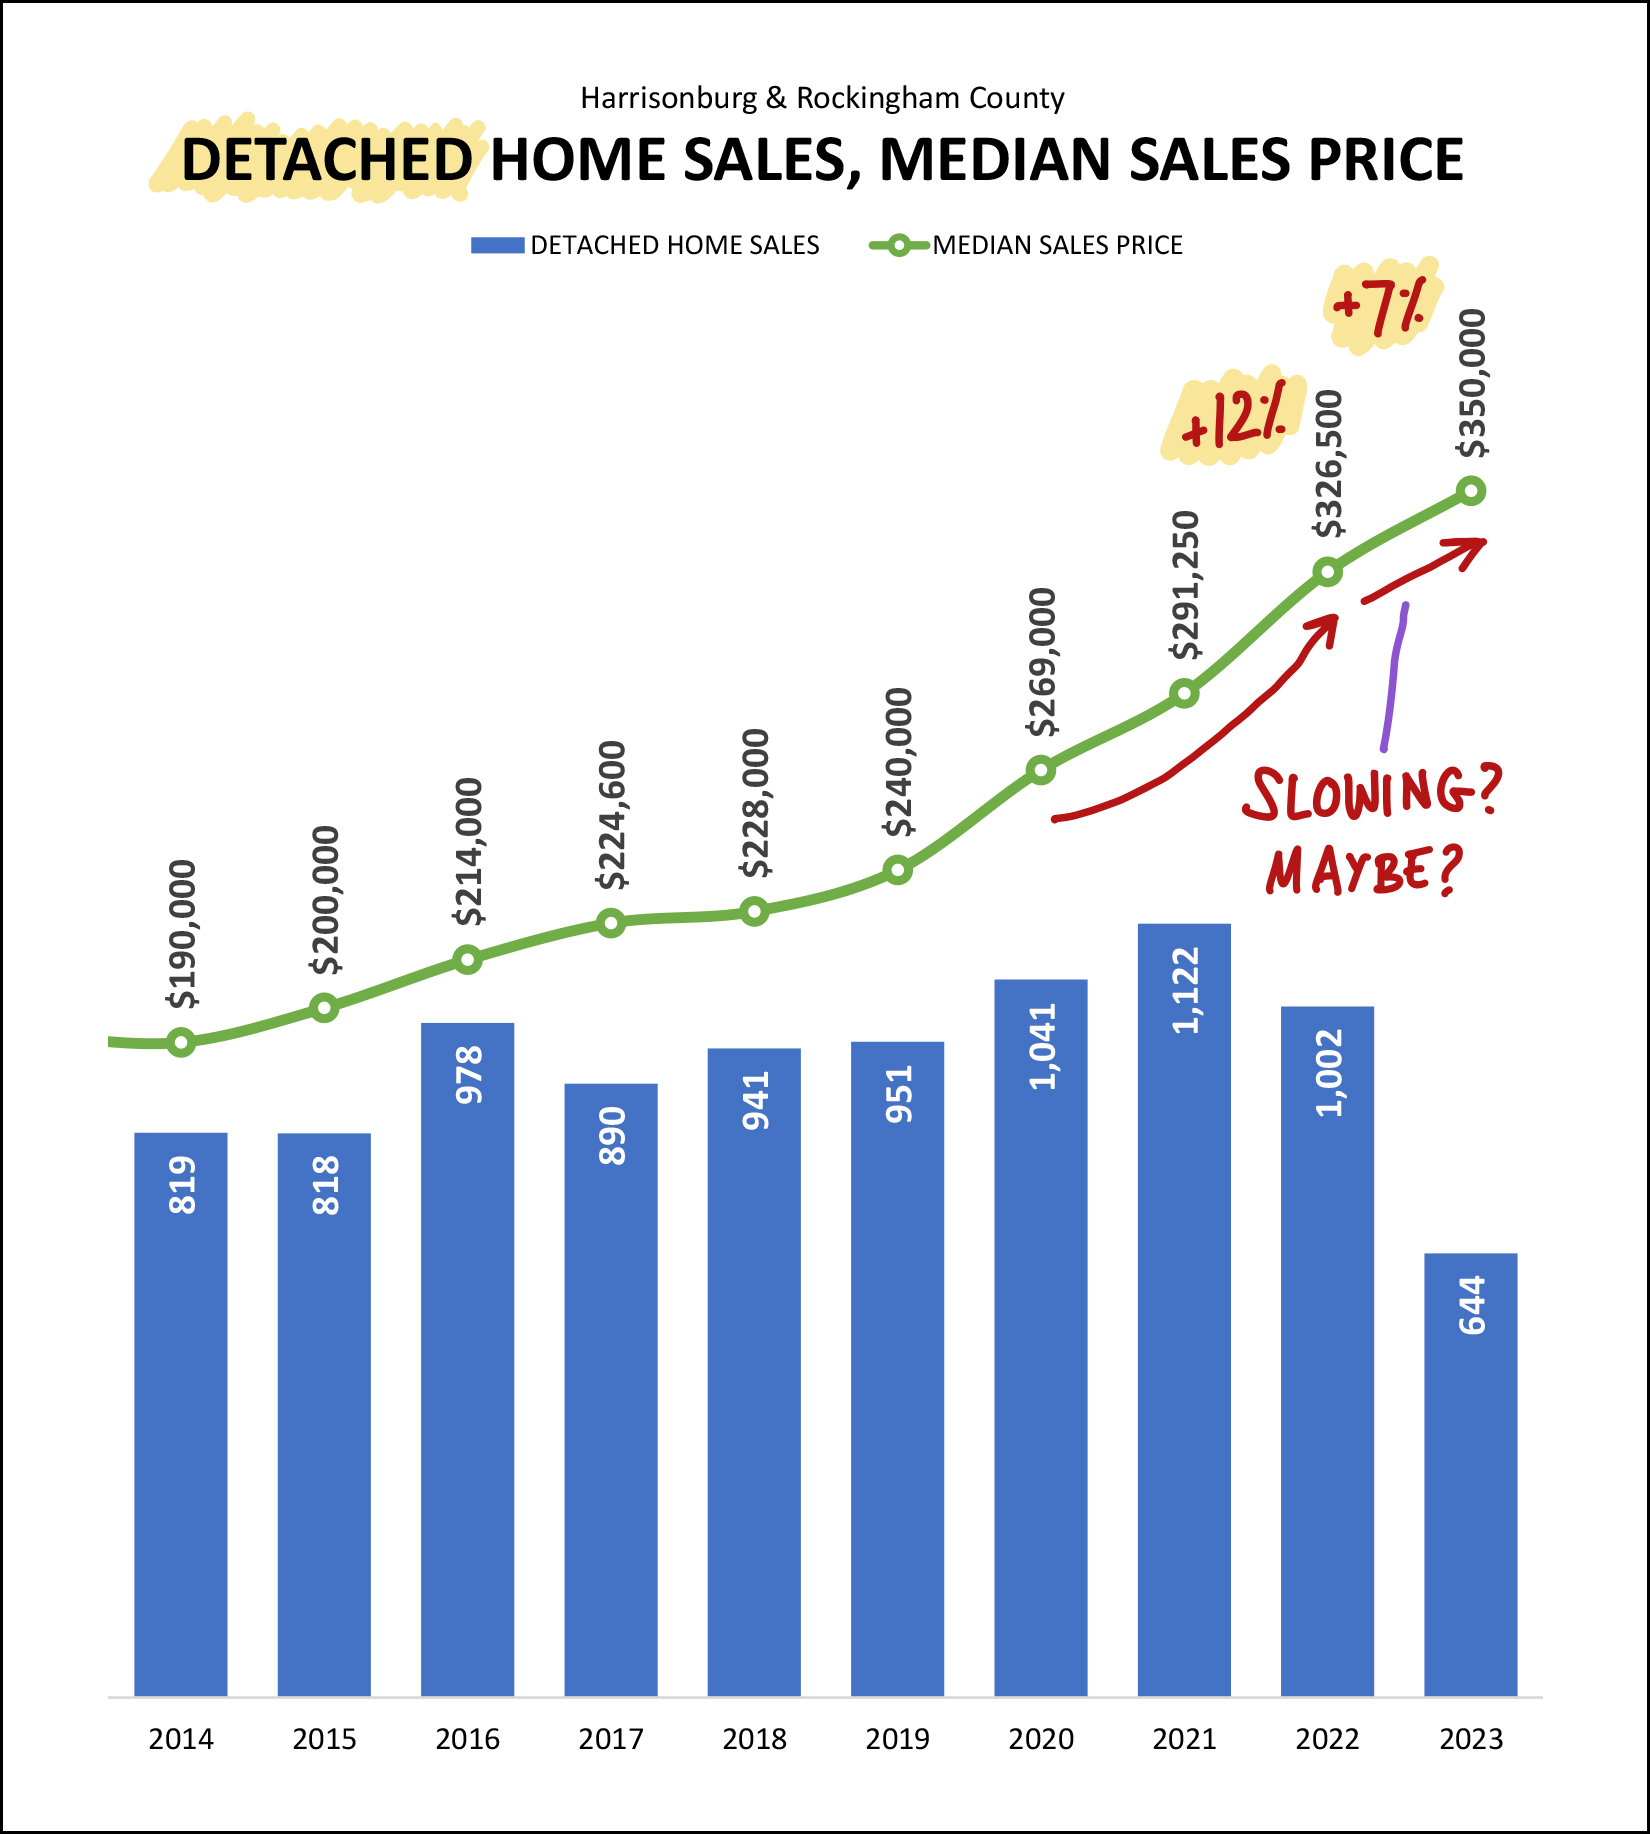 The graph above segments out only DETACHED home sales, also known as "single family homes" and excludes duplexes, townhouses and condos. Sometimes looking just at detached homes can be a more helpful or accurate view of changes in median sales prices as it removes one variable from the mix. When we're looking at market-wide changes in the median sales price the numbers can be affected by how many detached homes are selling (generally at higher prices) compared to how many attached homes are selling (usually at lower prices). Thus, I'm looking here just at the detached home sales. With all of that as context, you'll see that we saw a 12% increase in the median sales price of detached homes in Harrisonburg and Rockingham County in 2022... but thus far in 2023 we have only seen a 7% increase in the median sales price. Please note that I tried to choose my words very carefully in the latter part of my headline this month... "... Possible Slowing In Sales Price Gains" It is possible -- not certain -- that we are seeing a slowing of sales price GAINS. Sales prices are not declining, or even staying level. Prices are still rising, but they might be rising a bit more slowly now (7%) than they were last year (12%). But, yes, that's just for detached homes... because look at attached homes!?! 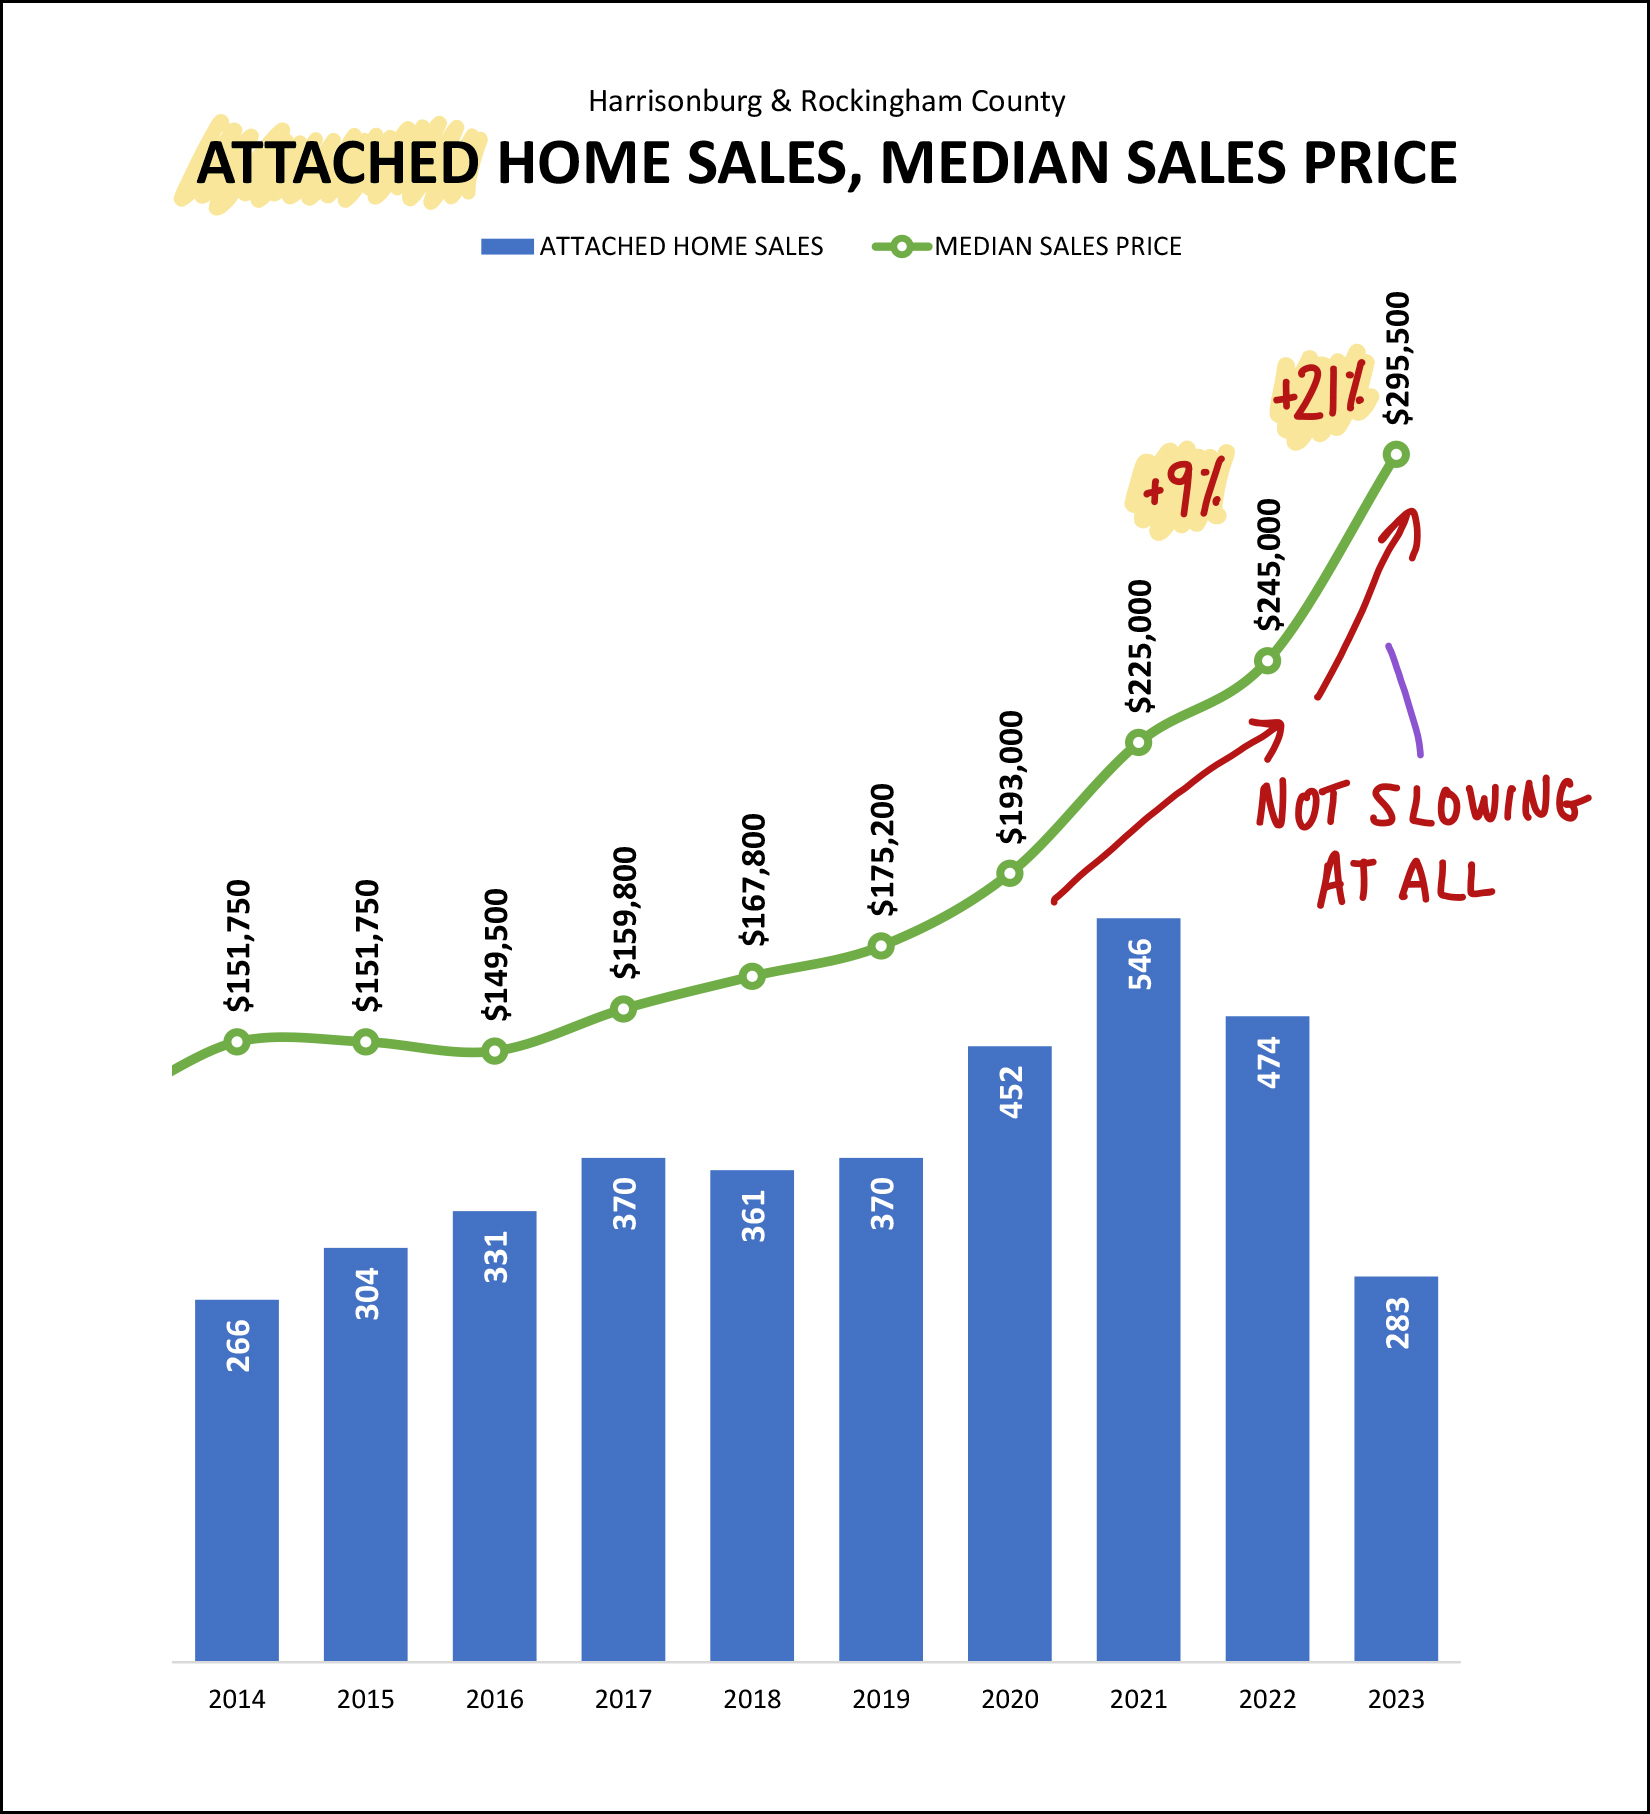 As shown above, the median sales price of attached homes is shooting upwards, quickly! After a 9% increase in the median sales price of attached homes in 2022, we are now seeing a 21% increase in 2023!?! My only theory here (thus far) is that this may be a result of more new construction (higher priced) attached homes selling this year, which might be driving the median sales price of attached homes up this quickly. I'll look into that further in the coming days. But yes, the median price of an attached home... is rising very quickly right now. Now, on to the contracts that were signed in September that might predict the home sales we'll see in October and/or November... 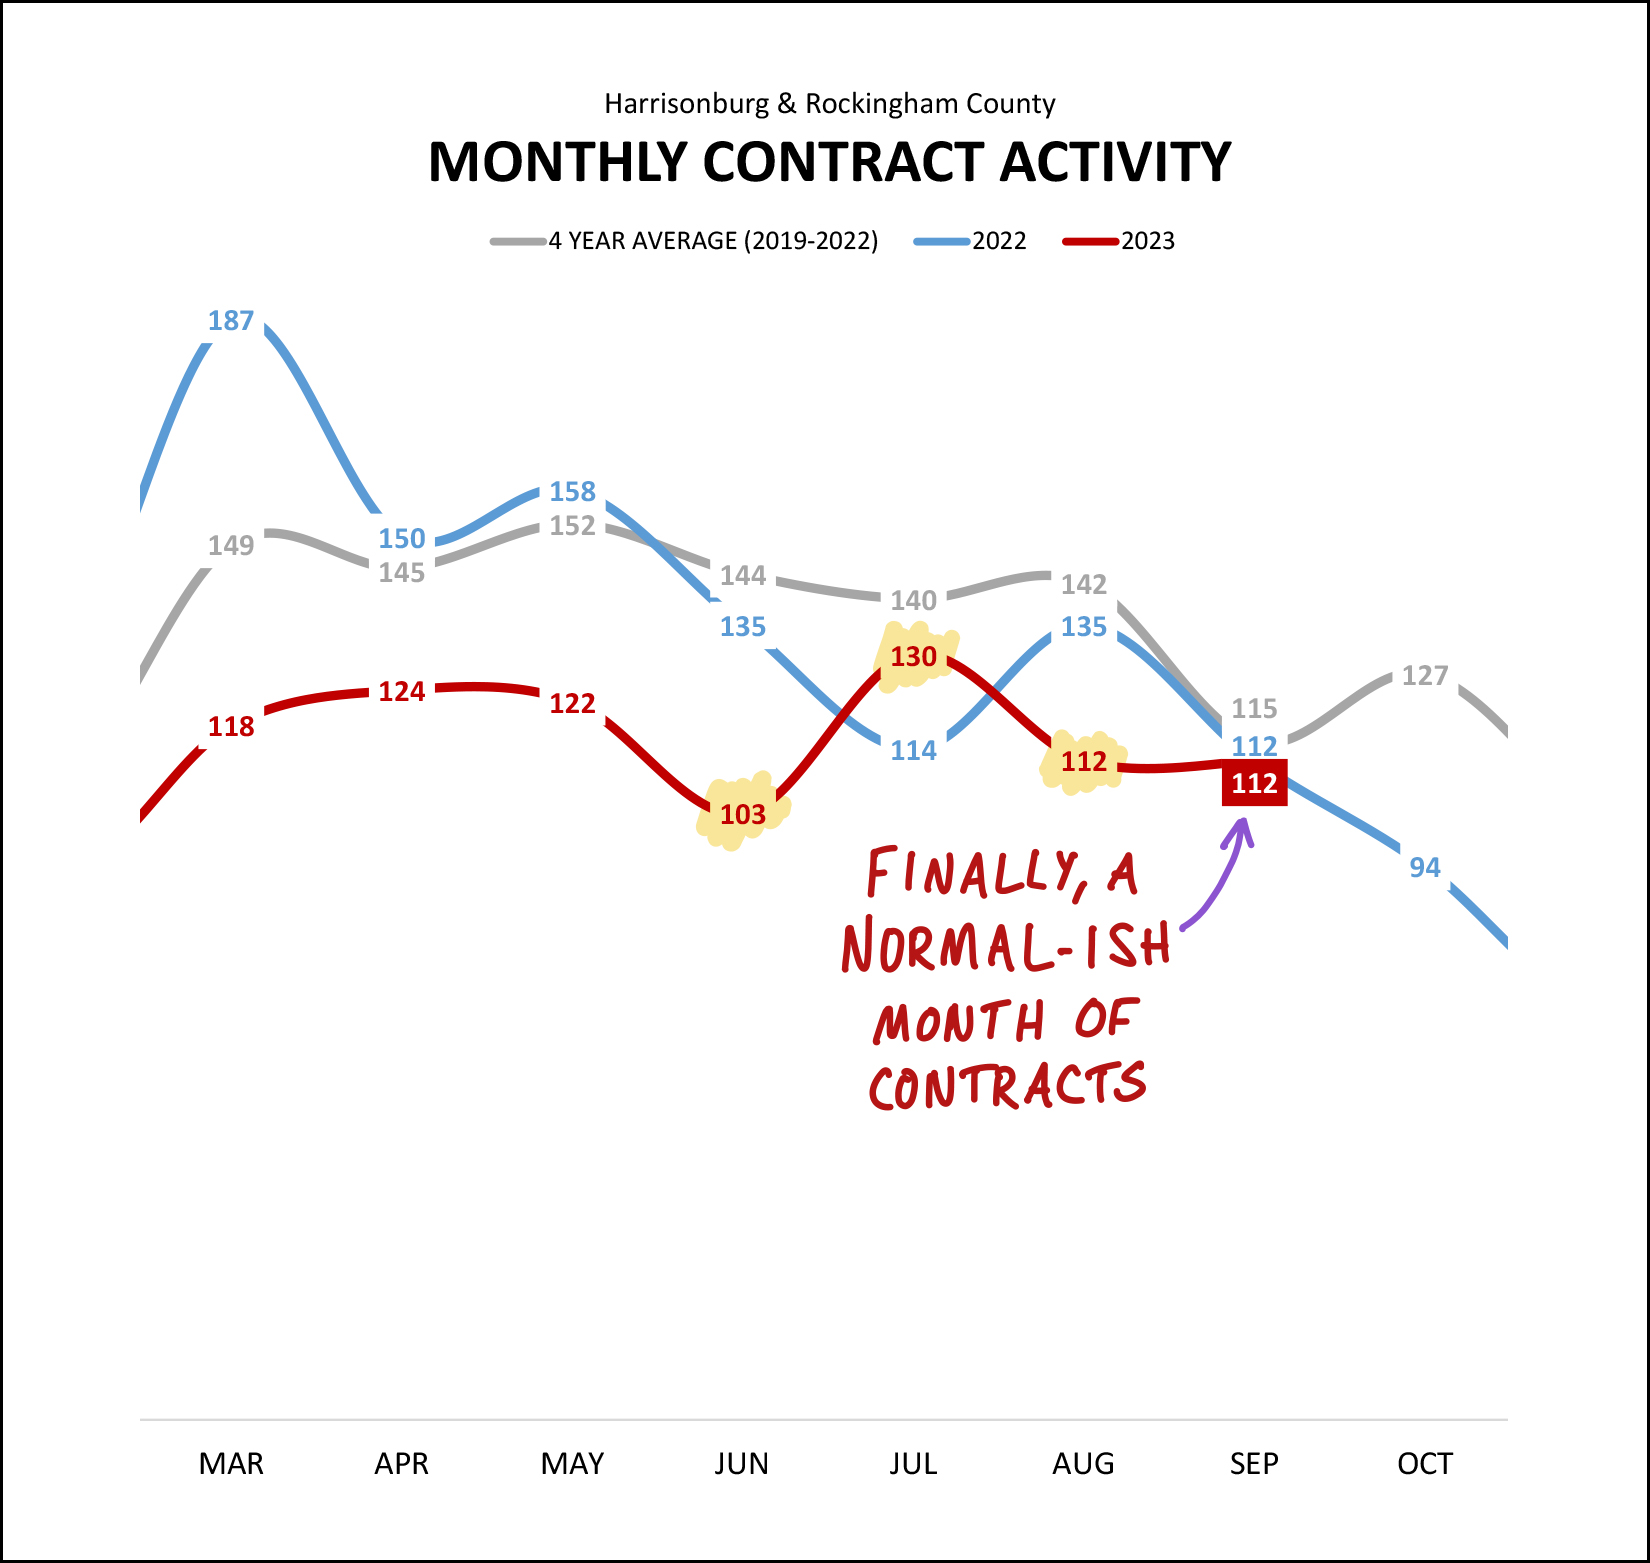 As shown above (highlighted in yellow) the rate of contracts being signed in June, July and August was a bit unpredictable. June was slower than last June. July was faster than last July. August was slower than last August. But September, it was just what we might have expected... we saw 112 contracts signed this September and 112 contracts signed last September. Now, then, the only thing I'll say looking ahead is that I expect we'll see fewer than 112 contracts signed this October and quite possibly fewer than the 94 that were signed last October. Next up, inventory levels, and as you know from the headline, they are rising... 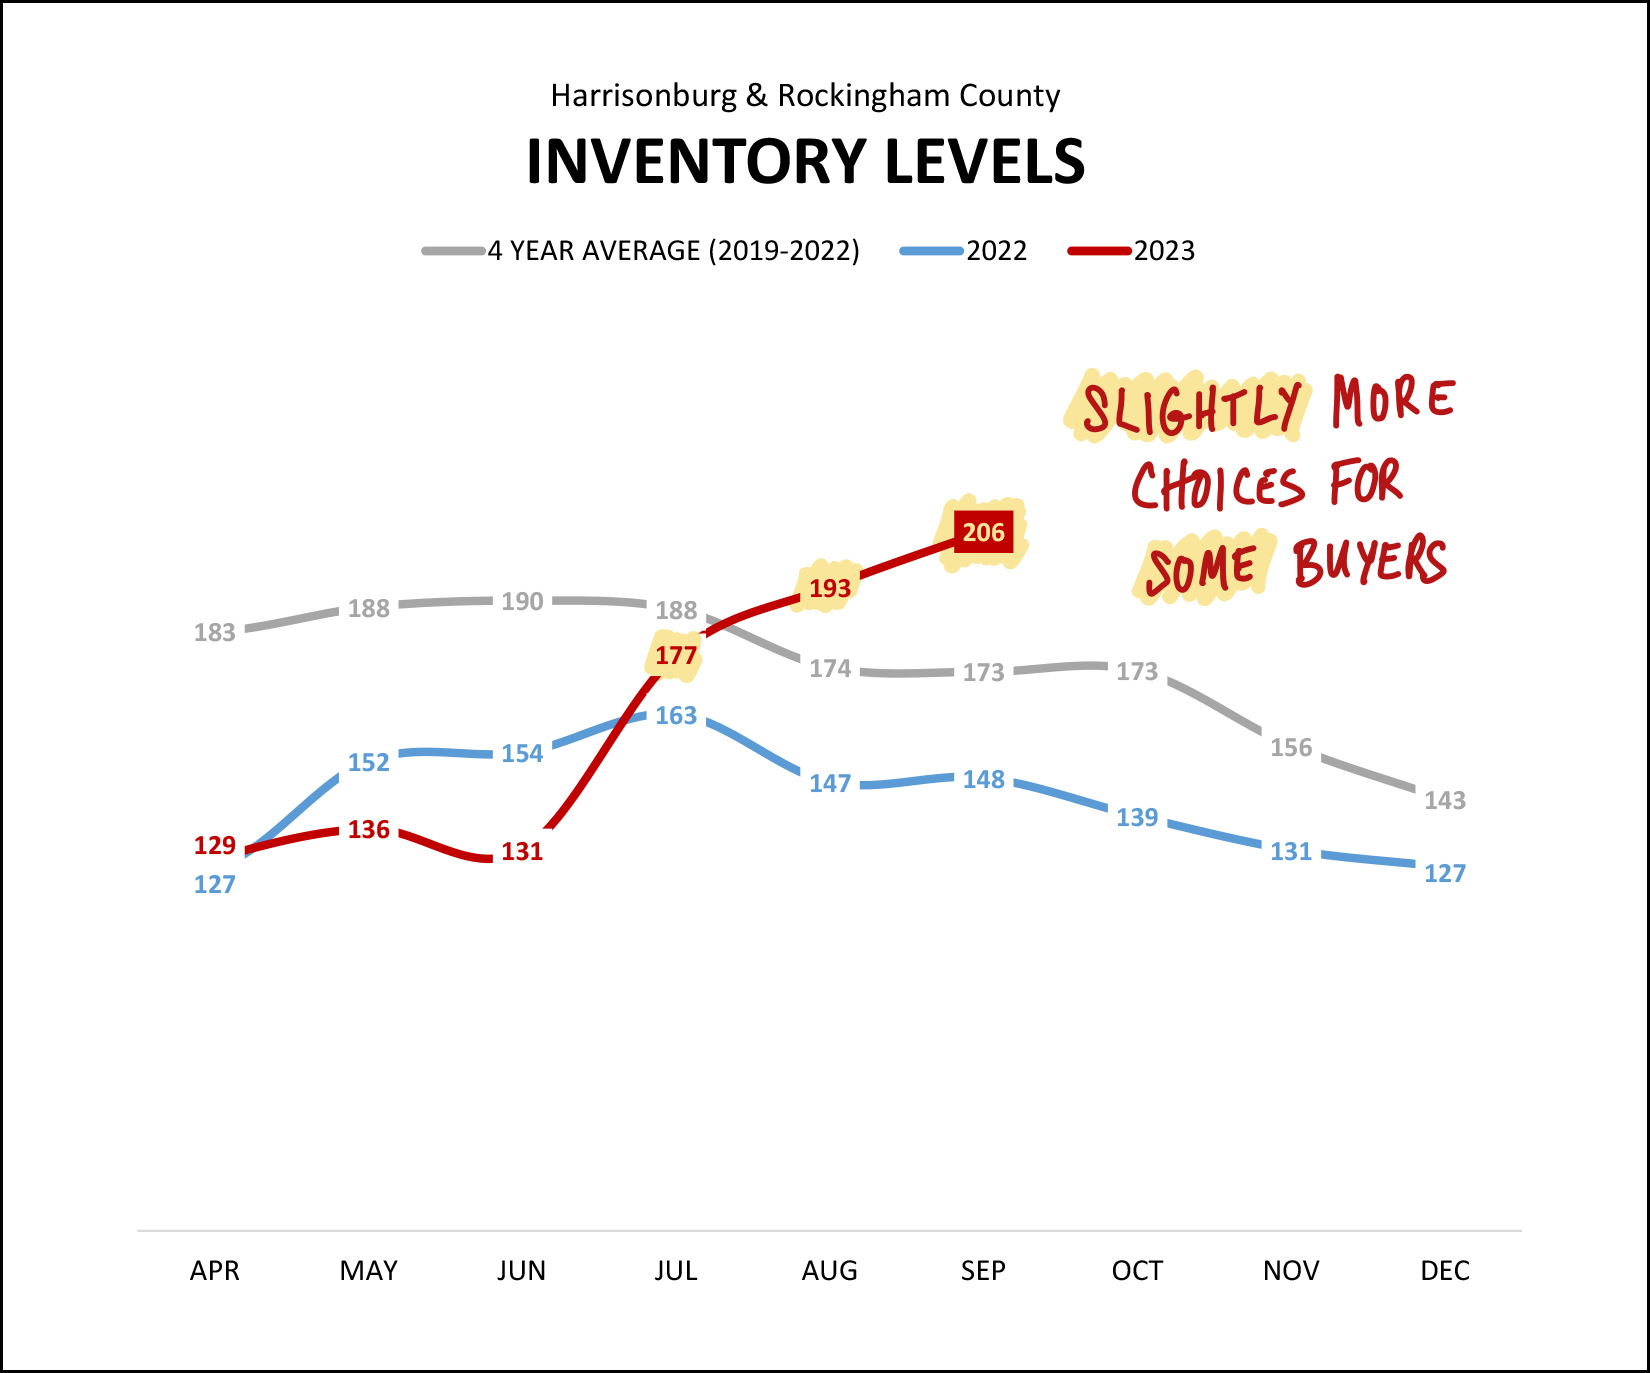 Over the past three months we have seen inventory levels rise from almost the lowest level in the past two years (131 in June 2023) to definitely and absolutely the highest level in the past two years (206 in September 2023). A few nuances to add here, though, as highlighted above... SLIGHTLY - This increase in inventory levels does put us above where we have been for the past few years (during/after Covid) but inventory levels are still well below where they were for much of the past decade. This increase in inventory levels provides slightly more choices for buyers -- not abundantly more choices for buyers. SOME - The increased inventory levels are not equally distributed across all price ranges, property types and locations. Some segments of our local market are still quite undersupplied and some are more oversupplied than others. So, some buyers have slightly more choices... but all buyers do not have slightly more choices. Now, to add a bit longer context to the recent rise in median days on market... 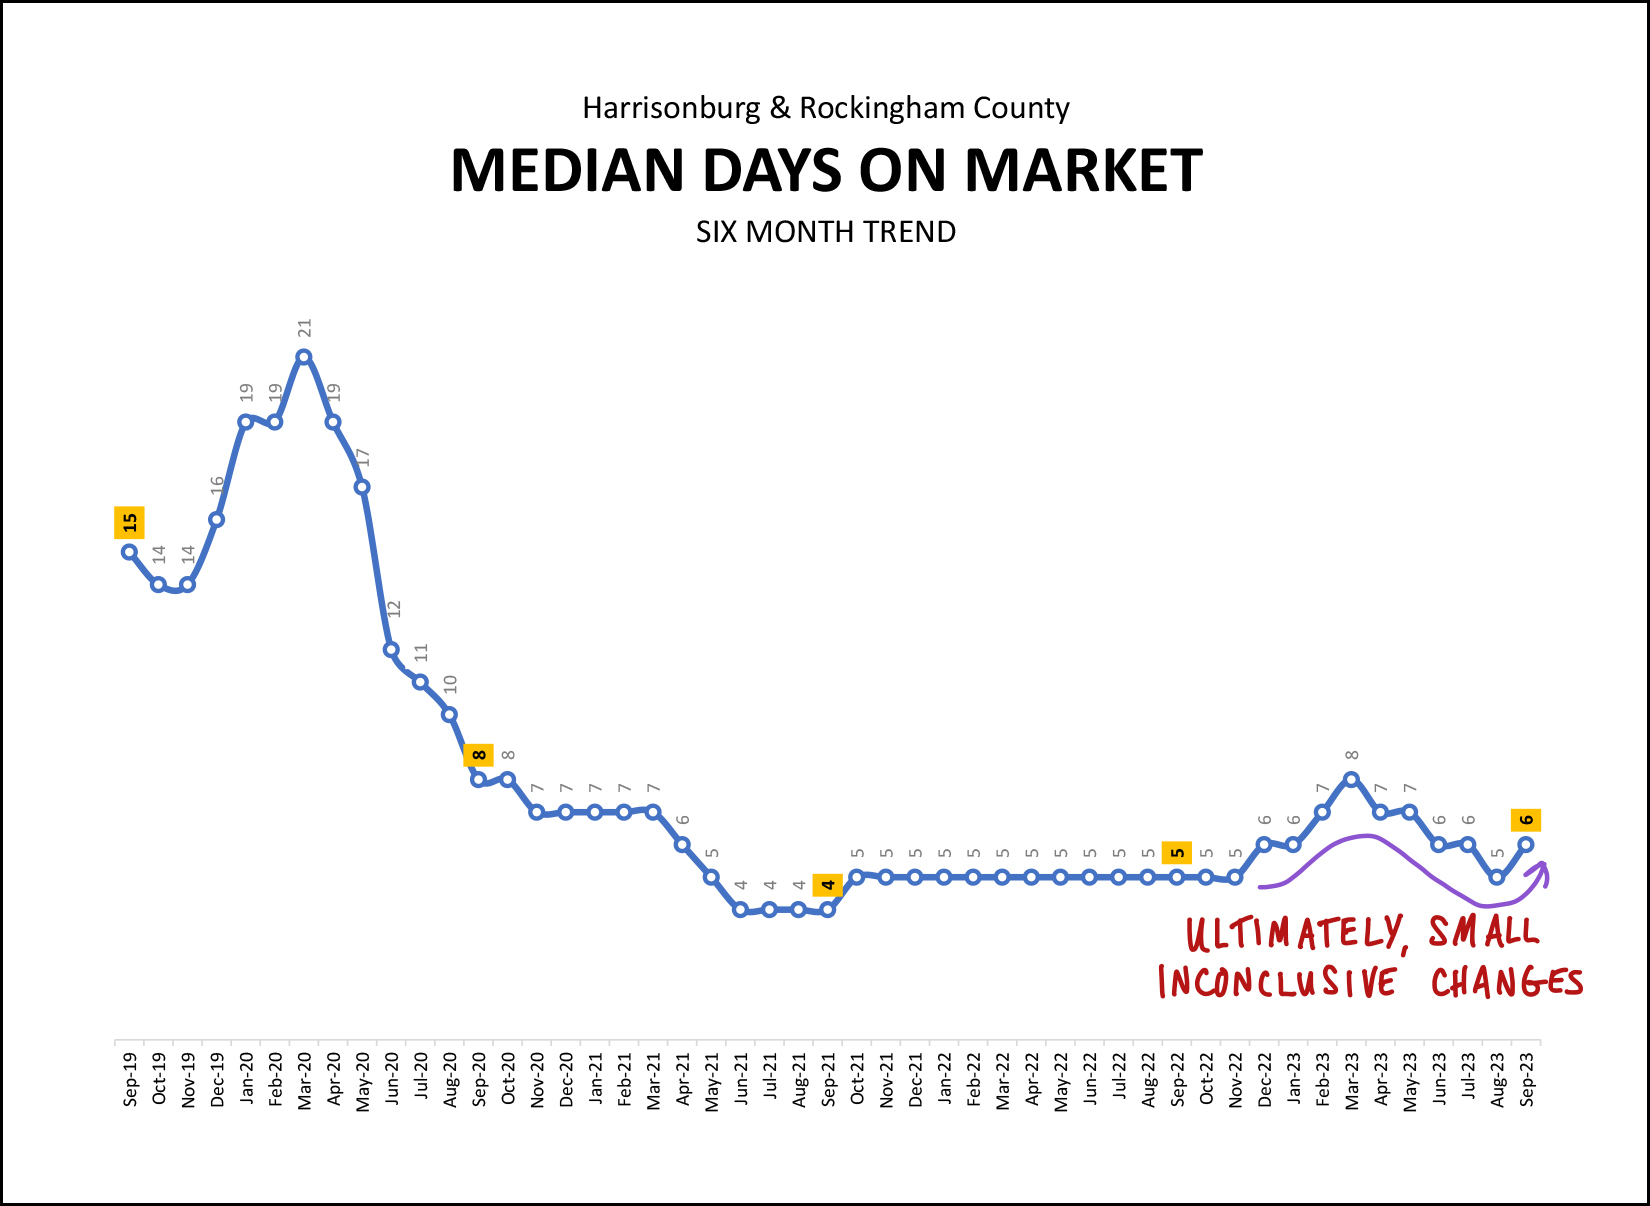 We have started to see the median days on market figure bounce around a bit in 2023... but it has remained between five days and eight days for the past year. These very small increases still keep it well below where it was in 2020 and prior. Also of note here is that while the median days on market figure is staying within that five to eight day range there are plenty of homes that are selling in fewer than five days and plenty that are selling in more (or much more) than eight days. And finally, it's time to play the blame game! :-) Why are we seeing fewer home sales right now? Why are we seeing rising inventory levels? Why might price increase gains be slowing? It's all, arguably, because of those darn mortgage interest rates... 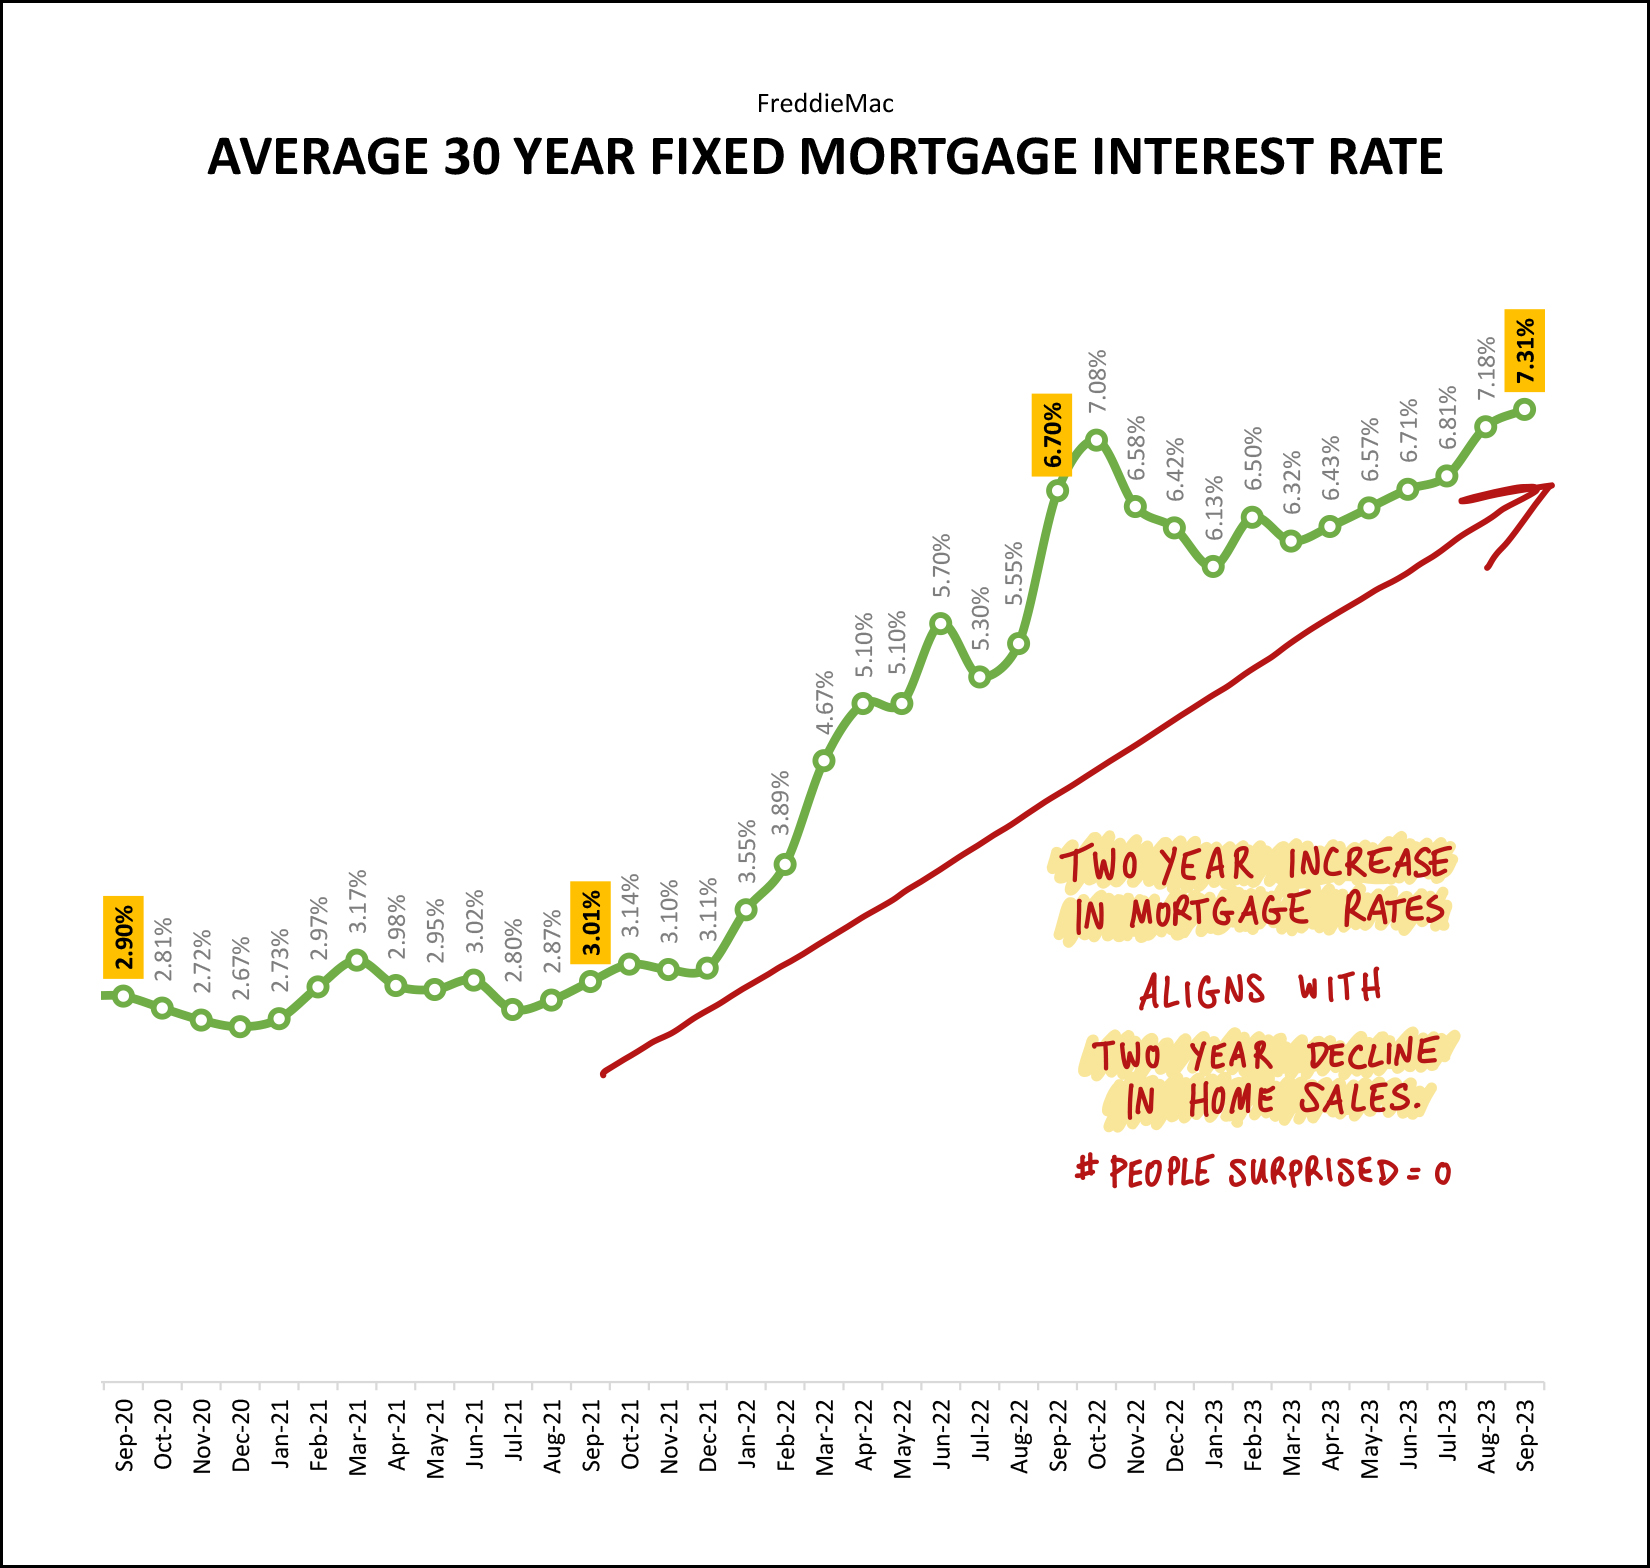 Over the past two years we have seen steadily increasing mortgage interest rates. Over the past two years we have seen steady declines in the annual rate of home sales. Coincidence? Probably not. Higher mortgage interest rates have... [1] Caused some would-be sellers to decide not to sell as they do not want to give up their low mortgage interest rate. [2] Caused some would-be buyers to decide not to buy as they can't afford (or don't want to pay) the monthly payment associated with the house they would like to buy. Where, then, will we likely see the market headed through the remainder of 2023 and into 2024? I believe we'll see... [1] Continued high mortgage interest rates, at or above 6.5%. [2] Continued declines in the annual rate of home sales, though I suspect the declines will slow. [3] Continued increases in the median sales price, though I suspect the increases will slow. [4] Sustained higher inventory levels that might continue to creep upward. So... if you plan to engage in this current real estate market as a home buyer or a home seller... BUYERS - You might see a few more choices of homes to purchase at any given time over the next few months. Your monthly housing costs will likely still be high given continued high interest rates. Waiting a year probably won't result in a lower monthly payment as rates likely won't drop considerably and prices don't seem likely to drop. SELLERS - Prices are still high, and rising, but those prices convert into an ever higher monthly housing cost for buyers. As such, you'll likely have fewer showings on your house and fewer offers. Prepare your house well, price it appropriately, market it thoroughly, and bear in mind that you might have to negotiate on price and terms with a buyer depending on your home's price range, property type, location, etc. If you're thinking about buying or thinking about selling but don't know what to think... feel free to reach out. I'm always happy to talk things through with you to try to help you clarify your goals and priorities and to figure out if now is the right time to make a move. You can reach me most easily at 540-578-0102 (call/text) or by email here. | |
As Higher Mortgage Interest Rates Cause Some Home Buyers To Stretch Their Monthly Budget A Bit Further, It Is More Important Than Ever To Keep The Cost Of Future Home Maintenance In Mind! |
|
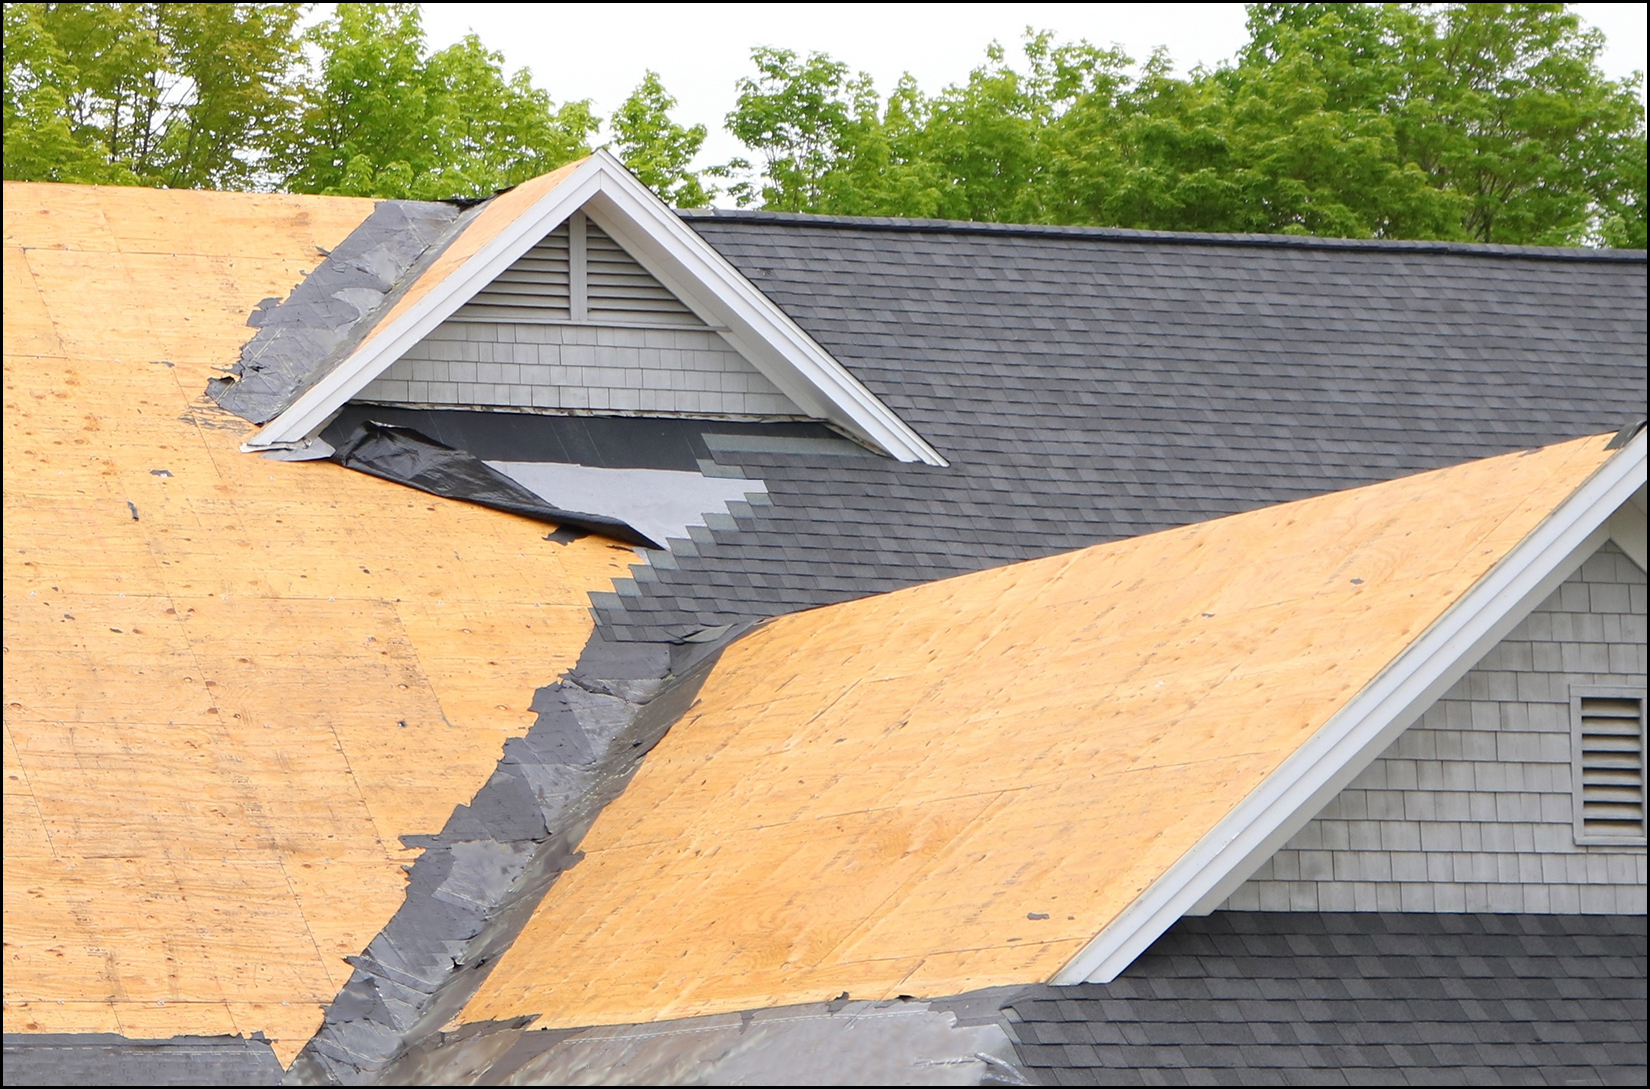 An important first step in considering your first or next home purchase... is talking to a qualified mortgage lender to better understand your potential monthly mortgage payment for the home you may decide to purchase. You'll be working with that mortgage lender to get a rough idea of two things... [1] The amount of money you'll need to have available at closing for your down payment and closing costs. ... and... [2] The amount of money you will be paying each month for your mortgage payment. But that's not all of the big picture calculations you should be doing. If you have $60K of cash available for a downpayment and $2,500 you could spend on housing...and you work things through with your lender and discover you need a $40K downpayment and your monthly mortgage payment will be $2,100 per month... great! That gives you a buffer in cash in hand for emergencies and you have extra room in your monthly budget. If you have $60K of cash available for a downpayment and $2,500 you could spend on housing...and you work things through with your lender and discover you need a $60K downpayment and your monthly mortgage payment will be $2,500 per month... maybe great, maybe not! Spending all of your available cash on the downpayment and closing costs... and spending the entirety of your monthly housing budget on your mortgage payment does not leave you with any room to deal with potential future home maintenance costs. What if you need to replace the heat pump in a few years? What if you need to replace the roof in five years? What if a kitchen appliance breaks? If you decide to stretch yourself monthly budget to make a house payment work -- make sure you have a game plan for those future home maintenance costs too! | |
Buyer Demand Still Exceeds Housing Supply, But Not For All Properties |
|
 In 2020, 2021 and 2022, almost every new listing had LOTS of interest and likely had multiple offers. There was some variation by price range and property type, but they were all quite favorable scenarios for sellers and quite frustrating scenarios for would be buyers. For example, with three fictional properties at different price points or in different locations or of different property types, etc., here's how the first week might look... First Property = 30 showings, 10 offers Second Property = 20 showings, 5 offers Third Property = 10 showings, 2 offers Again, great fun for sellers, no fun for buyers... mostly brought on by super low mortgage interest rates and Covid-induced changes in how people thought about the space they needed or wanted in their homes. Today, things are a bit different... mortgage interest rates are much higher (twice as high as their recent low point) and a global pandemic is no longer stretching our use of our homes in quite the same ways. This is resulting in a slightly different market response to those same fictional properties in week one of being on the market... First Property = 10 showings, 4 offers Second Property = 3 showings, 1 offer Third Property = 1 showing, no offers As represented above, we're seeing several dynamics here... [1] Some properties are still seeing lots of buyer interest and are having multiple offers the first week they are on the market. [2] Some properties are seeing a few showings in the first week, one of which results in an offer from a buyer who is happy to go ahead and move forward with purchasing the home. [3] Some properties are having very few showings the first week, and no offers. Seller #1 is still delighted. Seller #2 is quite satisfied and decides they are OK not having had multiple offers because they just needed one buyer. Seller #3 might think their house will never sell, might wish they sold their house a year ago, might be discouraged, might be frustrated, might be surprised. My general advice for Seller #3 is to remember the market before 2020... it often took a few weeks or a few months for many properties to sell. That's OK. Be patient. Collect feedback from buyers who are coming to look at your home. Make adjustments to your home's condition, marketing and/or price to best appeal to prospective buyers. But again, be patient. We're not in 2020-2022 any longer. | |
Did The Federal Student Loan Payment Pause Spur On More Home Buying By Recent Grads Who Built Savings For A Downpayment And Closing Costs? |
|
 Federal student loan payments were paused for three and a half years. For graduates who attended public schools, the average federal student loan debt at graduation seems to be around $25K... which worked out to be a student loan payment of $280 per month. 3.5 years = 42 months $280 x 42 = $11,760 Recent grads with average student loan debt, with average student loan payments, would have been able to save up about $12,000 over the past three and a half years when federal loan payments were paused. Did this pause in payments on student loans allow some would-be home buyers to build up savings to put towards a downpayment or closing costs for a home purchase? Quite possibly. There seem to be many reasons why we saw a surge in home buying activity over the past few years... 1. Covid-induced changes to work / life / home situations. 2. Super duper low mortgage interest rates. ...and maybe... 3. College graduates building up savings due to not needing to make student loan payments for a few years. But, back to reality, student loan payments have started back up again now. So if you were building up some savings with those (non)payments -- you'll now need to divert those monthly funds back towards paying off your student loans. | |
Maybe We Will See Seasonal Declines In Housing Inventory Levels Again This Year? |
|
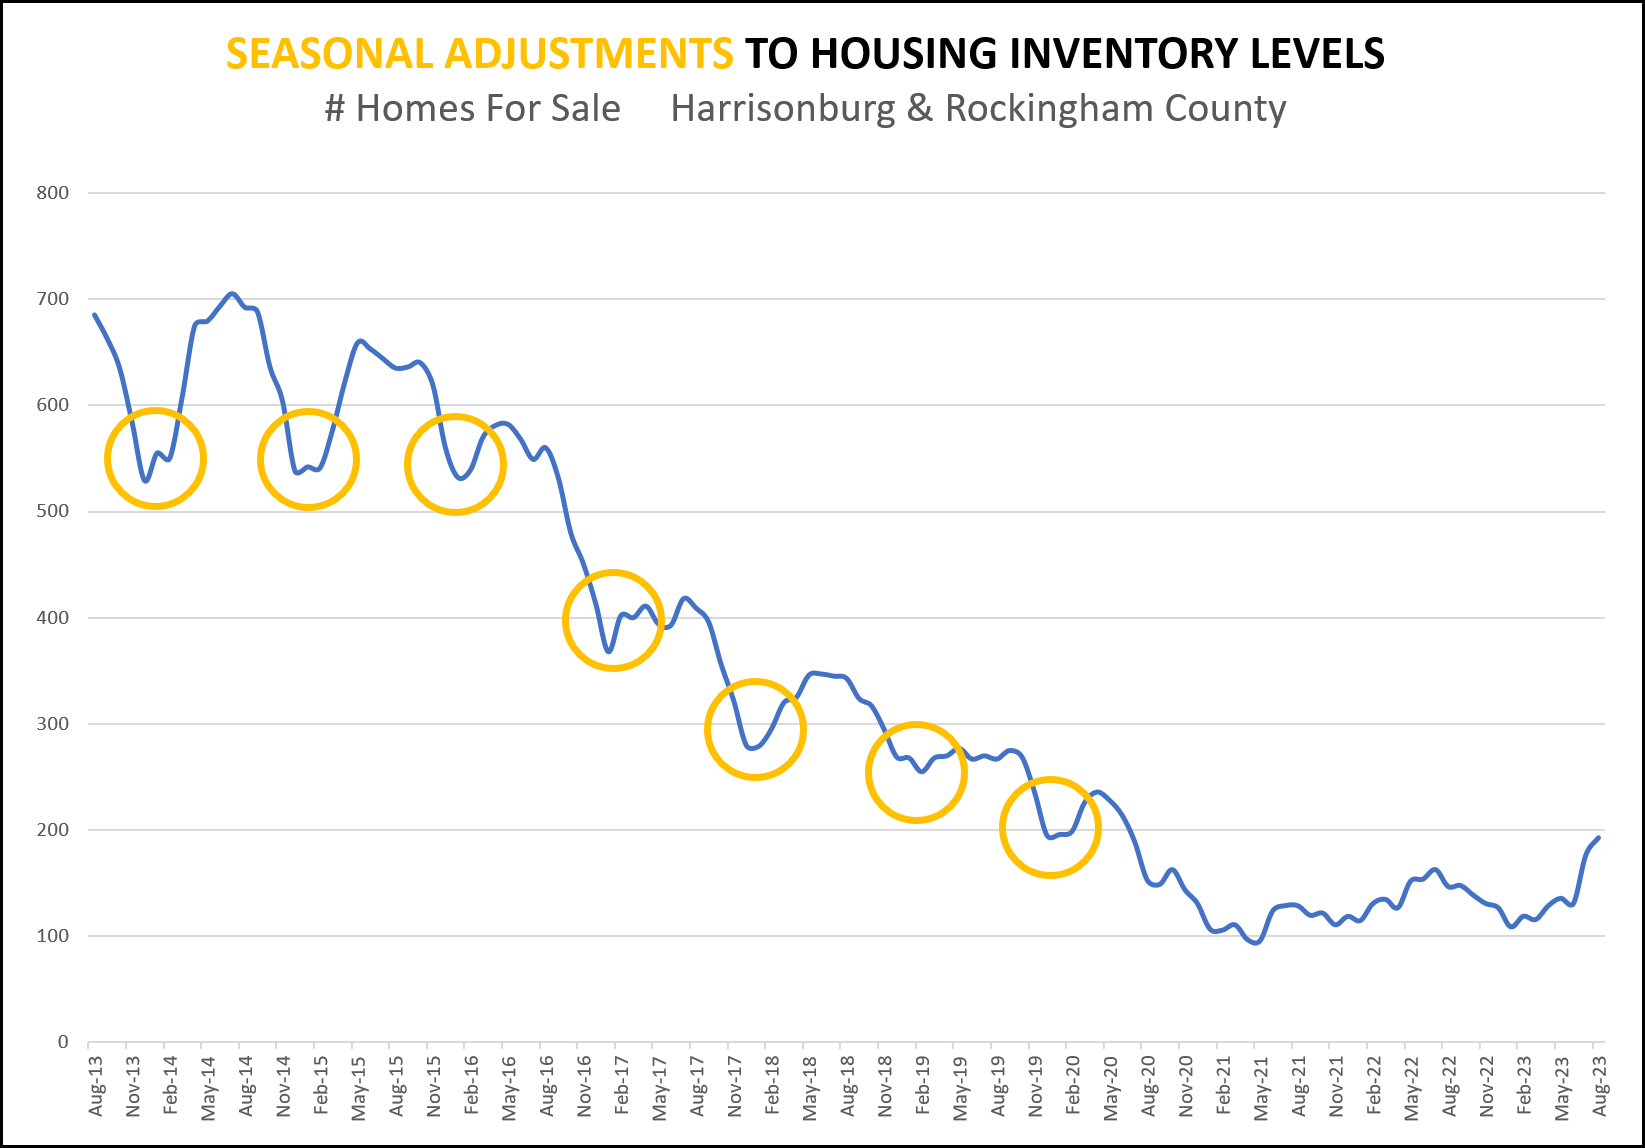 All the way through 2019, we would see a seasonal decline in housing inventory levels each winter. Inventory levels would typically be the lowest between November and February as some sellers took their homes off the market for a few months -- and as some sellers decided to wait until spring to sell their homes. But then between 2020 and 2022, that all changed. The real estate market was on FIRE as Covid-induced work/life/home changes and super low mortgage interest rates pushed more buyers than ever into the housing market. Inventory levels that had been dropping for several years (2016 - 2019) dropped even further. All of a sudden, inventory levels were ALWAYS low. Spring and summer inventory levels - low. Fall and winter inventory levels - low. We stopped seeing seasonal shifts in housing inventory levels. But over the past few months inventory levels have been drifting back upwards a bit. So, as we (eventually?) start to see cooler temperatures, will we start to see seasonal declines in housing inventory levels again? | |
Anecdotally And Quite Reasonably, Many Buyers Seem To Be Making Larger Down Payments These Days |
|
 Yes, I know, this is just based on transactions I am observing, and perhaps even just those that lodge themselves into my mind more than others, but... Home buyers seem to be making larger down payments these days -- and I can understand why. Before... with 3% - 4% mortgage interest rates... there wasn't much of a motivation to make much of a downpayment. Your mortgage payment would be so low, given low mortgage interest rates, that buyers would often finance as high of a percentage of the purchase price that their lender would allow. Now... with 7% mortgage interest rates... buyers are motivated to make as large of a down payment as possible, to make their loan amount as small as possible, given the (relatively) higher mortgage interest rates. This is not to say that all of a sudden all buyers are putting 20% down on their real estate purchases -- they aren't -- but the calculus of how much cash to put into a real estate purchase looks a bit different these days. Home buyers are certainly still keeping some cash on the side for emergencies, etc., but they are often making larger down payments (and financing less) now than they were a few years ago. | |
Slight Bump In Contract Activity In September 2023 |
|
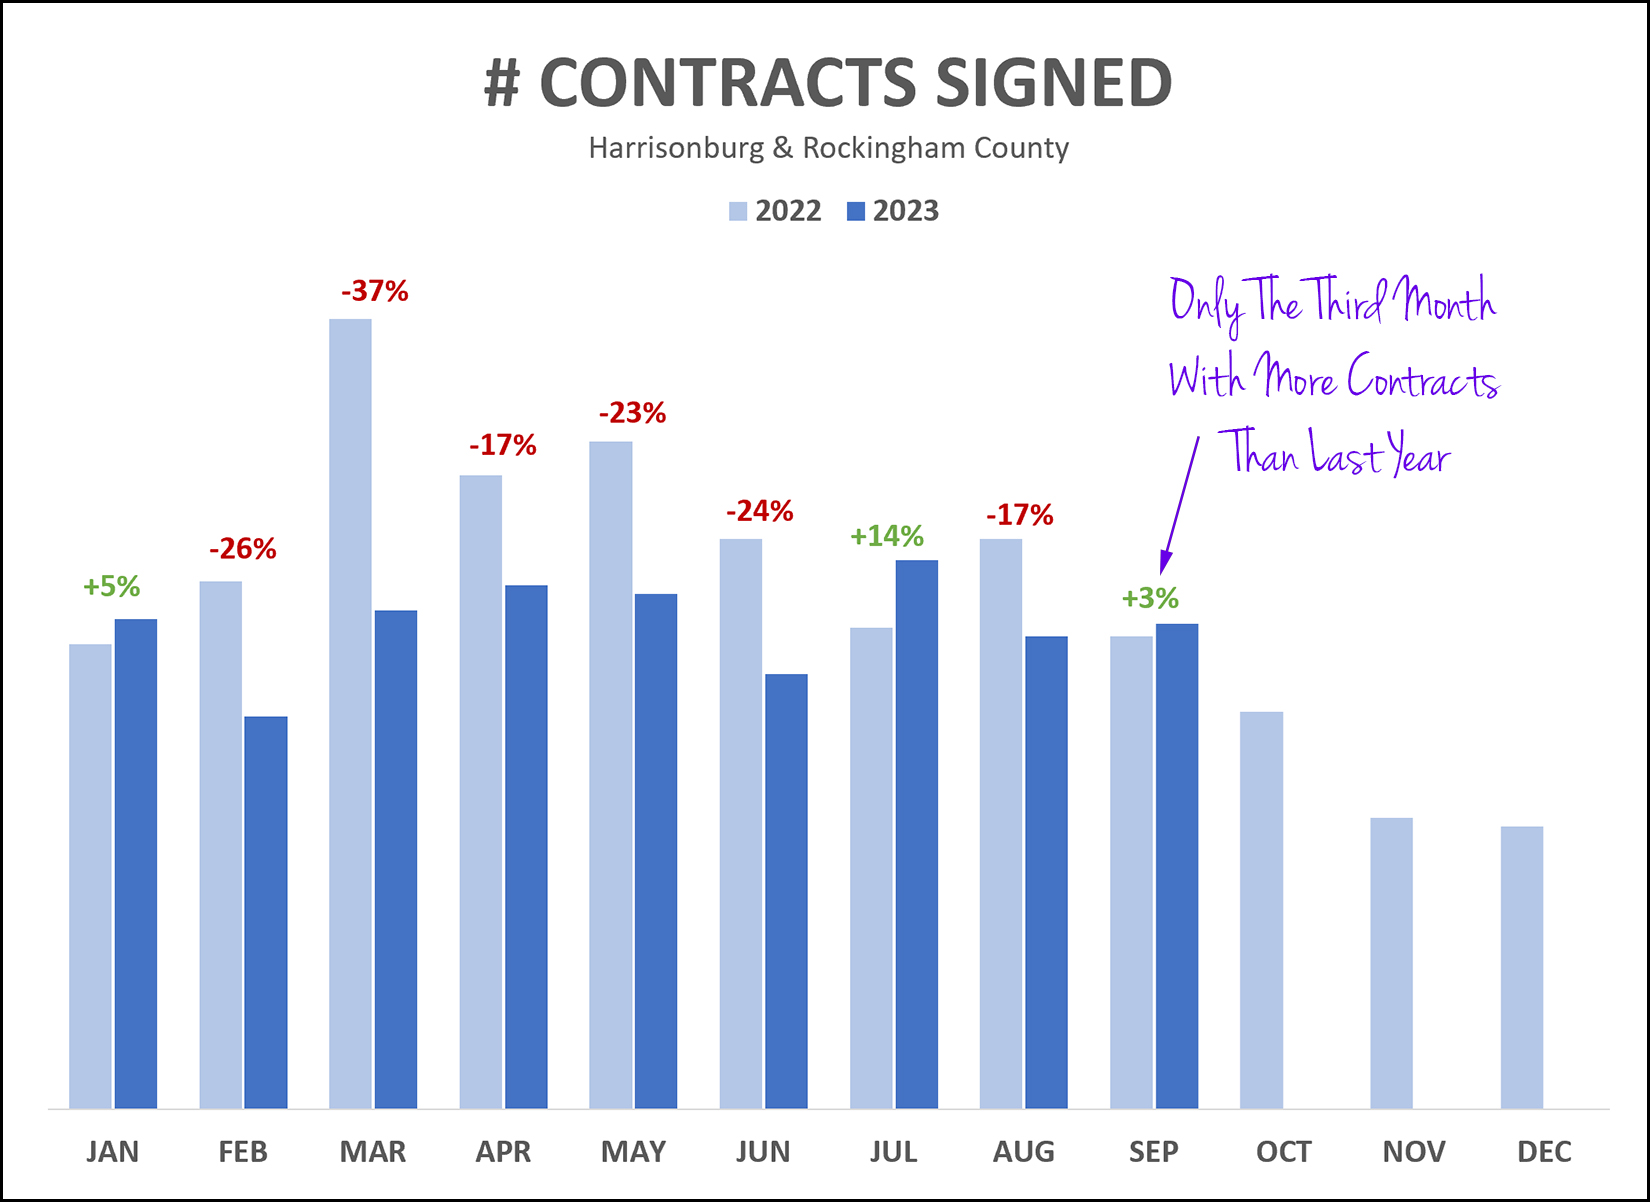 We saw a slight increase in contract activity this September as compared to last September... with 3% more contracts signed this year than last... 115 contracts were signed in September 2023 112 contracts were signed in September 2022 As you'd like imagine given the graph above, the total pace of contract signing this year is a good bit below last year... 1,226 contracts signed January - September 2023 1,033 contracts signed January - September 2022 So, we're seeing 16% fewer contracts signed this year than last -- though we had a few more than expected in September 2023. It will be interesting to see how October through December finish out in 2023. Stay tuned for a fuller market analysis in the next week or so. | |
It May Be Time To Adjust To These Mortgage Interest Rates And Not Wait Around Thinking They Will Decline |
|
 A year ago -- in October 2022 -- I commented on rapid changes in mortgage interest rates through the first ten months of 2022... January 2022 = 3.45% April 2022 = 5.00% October 2022 = 6.94% At that point, in October 2022, I reflected that... "I don't think that we can assume that mortgage interest rates are going to drop substantially at this point. Mortgage interest rates may very well continue to be between 6% and 7% for the next 12 months." I'm going to double down on that advice here in October 2023... The current average 30 year fixed rate mortgage interest rate is 7.31%. I don't think anyone should be waiting around thinking that we'll see 6.5% soon and then 6% after that... I think it is very likely that we will continue to see mortgage interest rates in the current range (6.75% - 7.50%) for the rest of 2023 and perhaps through the entirety of 2024. If mortgage interest rates decline, that will be fantastic, but I don't think we should expect it or count on it. | |
Scott Rogers
Funkhouser Real
Estate Group
540-578-0102
scott@funkhousergroup.com
Licensed in the
Commonwealth of Virginia
Home Search
Housing Market Report
Harrisonburg Townhouses
Walk Through This Home
Investment Properties
Harrisonburg Foreclosures
Property Transfers
New Listings

