| Newer Post | home | Older Post |
2023 Recap On Our Local Housing Market Shows 23% Fewer Home Sales At 10% Higher Prices |
|
 Happy New Year, Friends! I hope your 2023 wrapped up nicely and that you had some time with family and friends over the holidays! I had a wonderful time over the past few weeks making tons of great memories with family (including my brother and his family visiting from out of state and so many others), eating lots and lots of delicious food (including plenty of Christmas cookies), relaxing, sleeping in, and I closed out the year by running in (and badly spraining my ankle in) the New Years Eve Glow Run. My ankle buckled after about 2.5 miles (I think when I landed on some uneven ground?) and I managed to cut up my knee as I rolled off the path... so I had to fake my way to the finish line with a bloody knee...  As a result, I have found myself limping and hobbling my way into the New Year -- but beyond this temporary mobility setback, I couldn't be more excited for the year ahead. ;-) Below I have outlined a variety of trends we are currently seeing in the local real estate market, but before we get started with the numbers and charts and graphs... each month I provide a giveaway, of sorts, for readers of my monthly market report. This month I'm highlighting one of my favorite sandwich spots downtown... Lola's Delicatessen. They create some amazing sandwiches and are a great spot to stop for lunch in downtown Harrisonburg. If you haven't checked out Lola's -- you should -- and click here to enter your name for a chance to win a $50 gift certificate to Lola's Delicatessen! Now, let's take a look at some data on our local housing market... 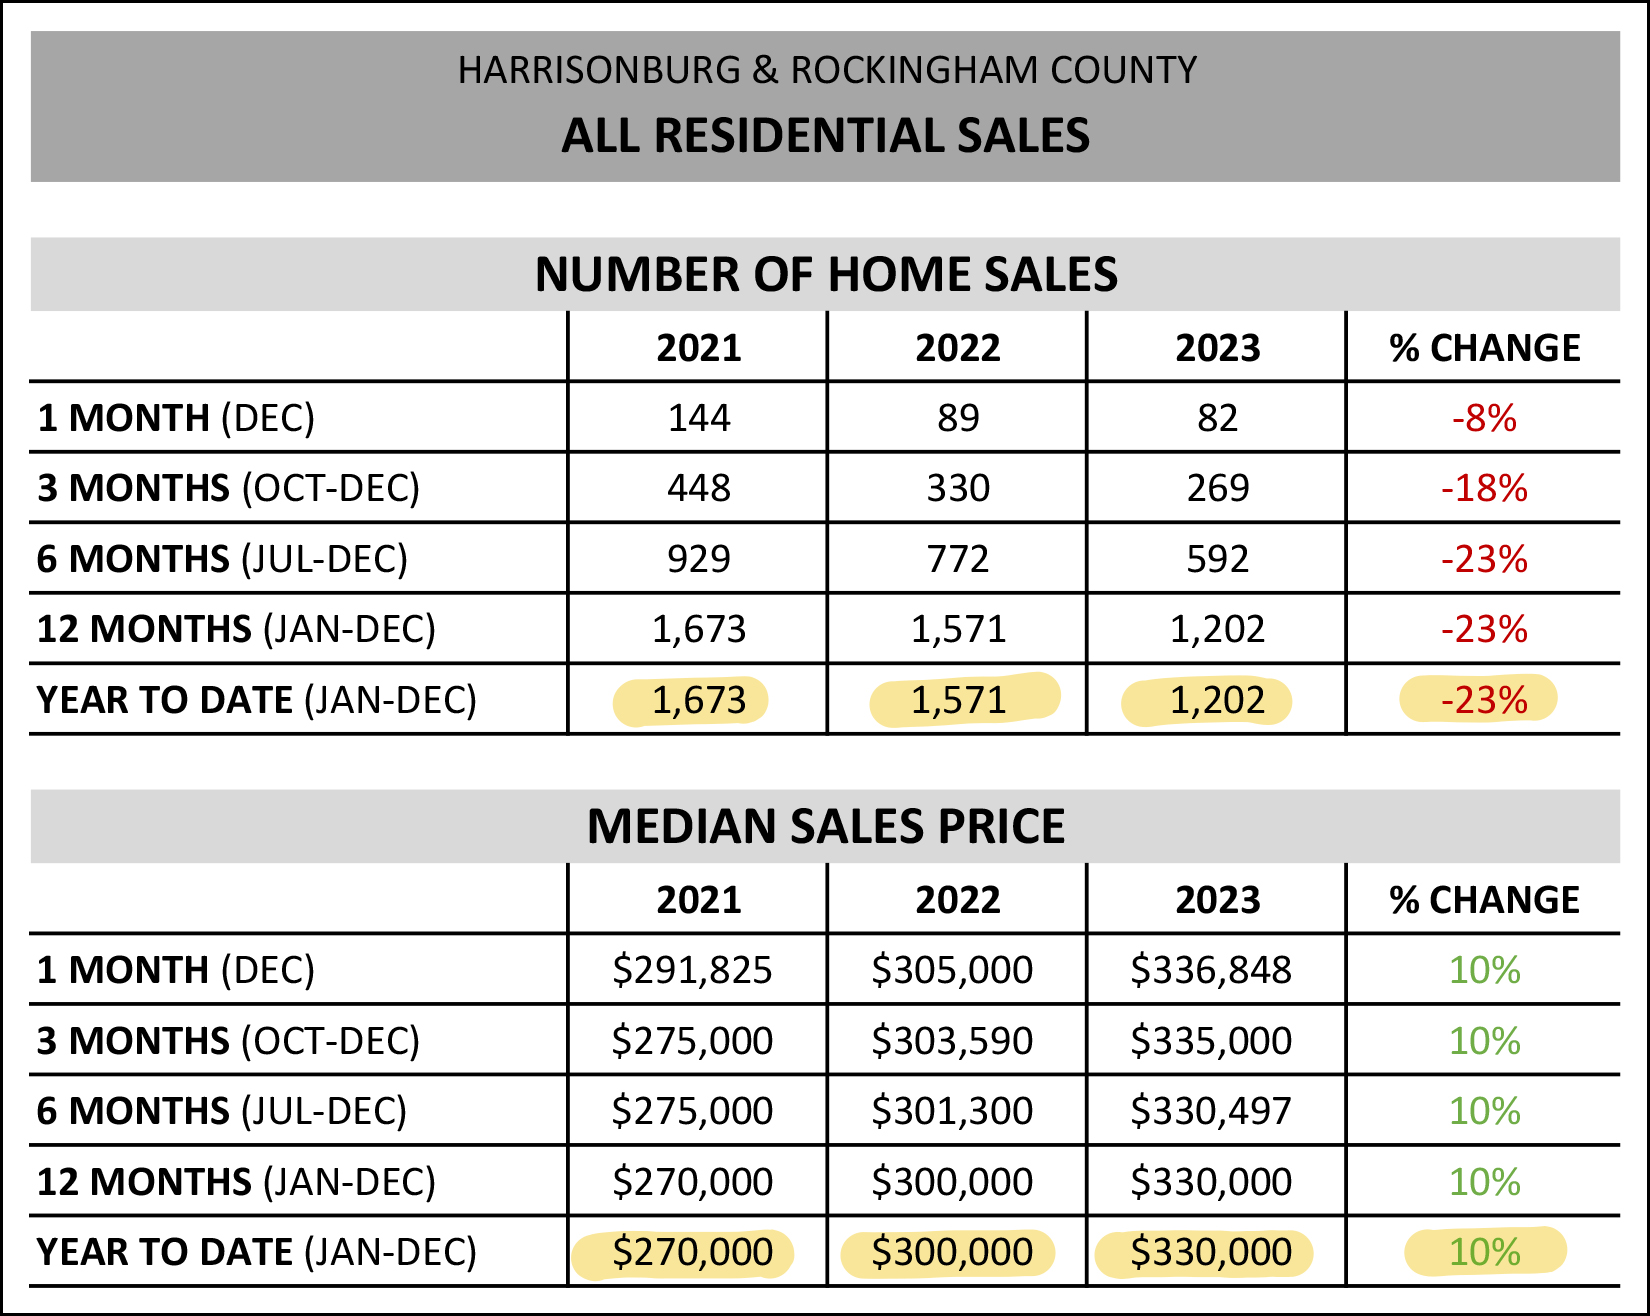 First up, the big picture of where we ended up after a full year of real estate data in Harrisonburg and Rockingham County in 2023... We continue to see fewer homes selling in Harrisonburg and Rockingham County. After a 6% decline in the number of homes selling between 2021 and 2022... we saw a much larger, 23%, decline in the number of homes selling in our market in 2023. As we'll see on a later graph, this is the lowest number of homes selling in quite a few years. The prices of those homes that are selling continue to rise, quickly. After an 11% increase in the median sales price in 2022, we saw a very similar, 10%, increase in the median sales price in 2023. As we'll see on a later graph, this is the highest median price we have seen in this area, ever. Let's now use that 23% drop in the number of homes selling and that 10% increase in median homes prices as a benchmark against which to understand other similar but slightly different trends in 2023... 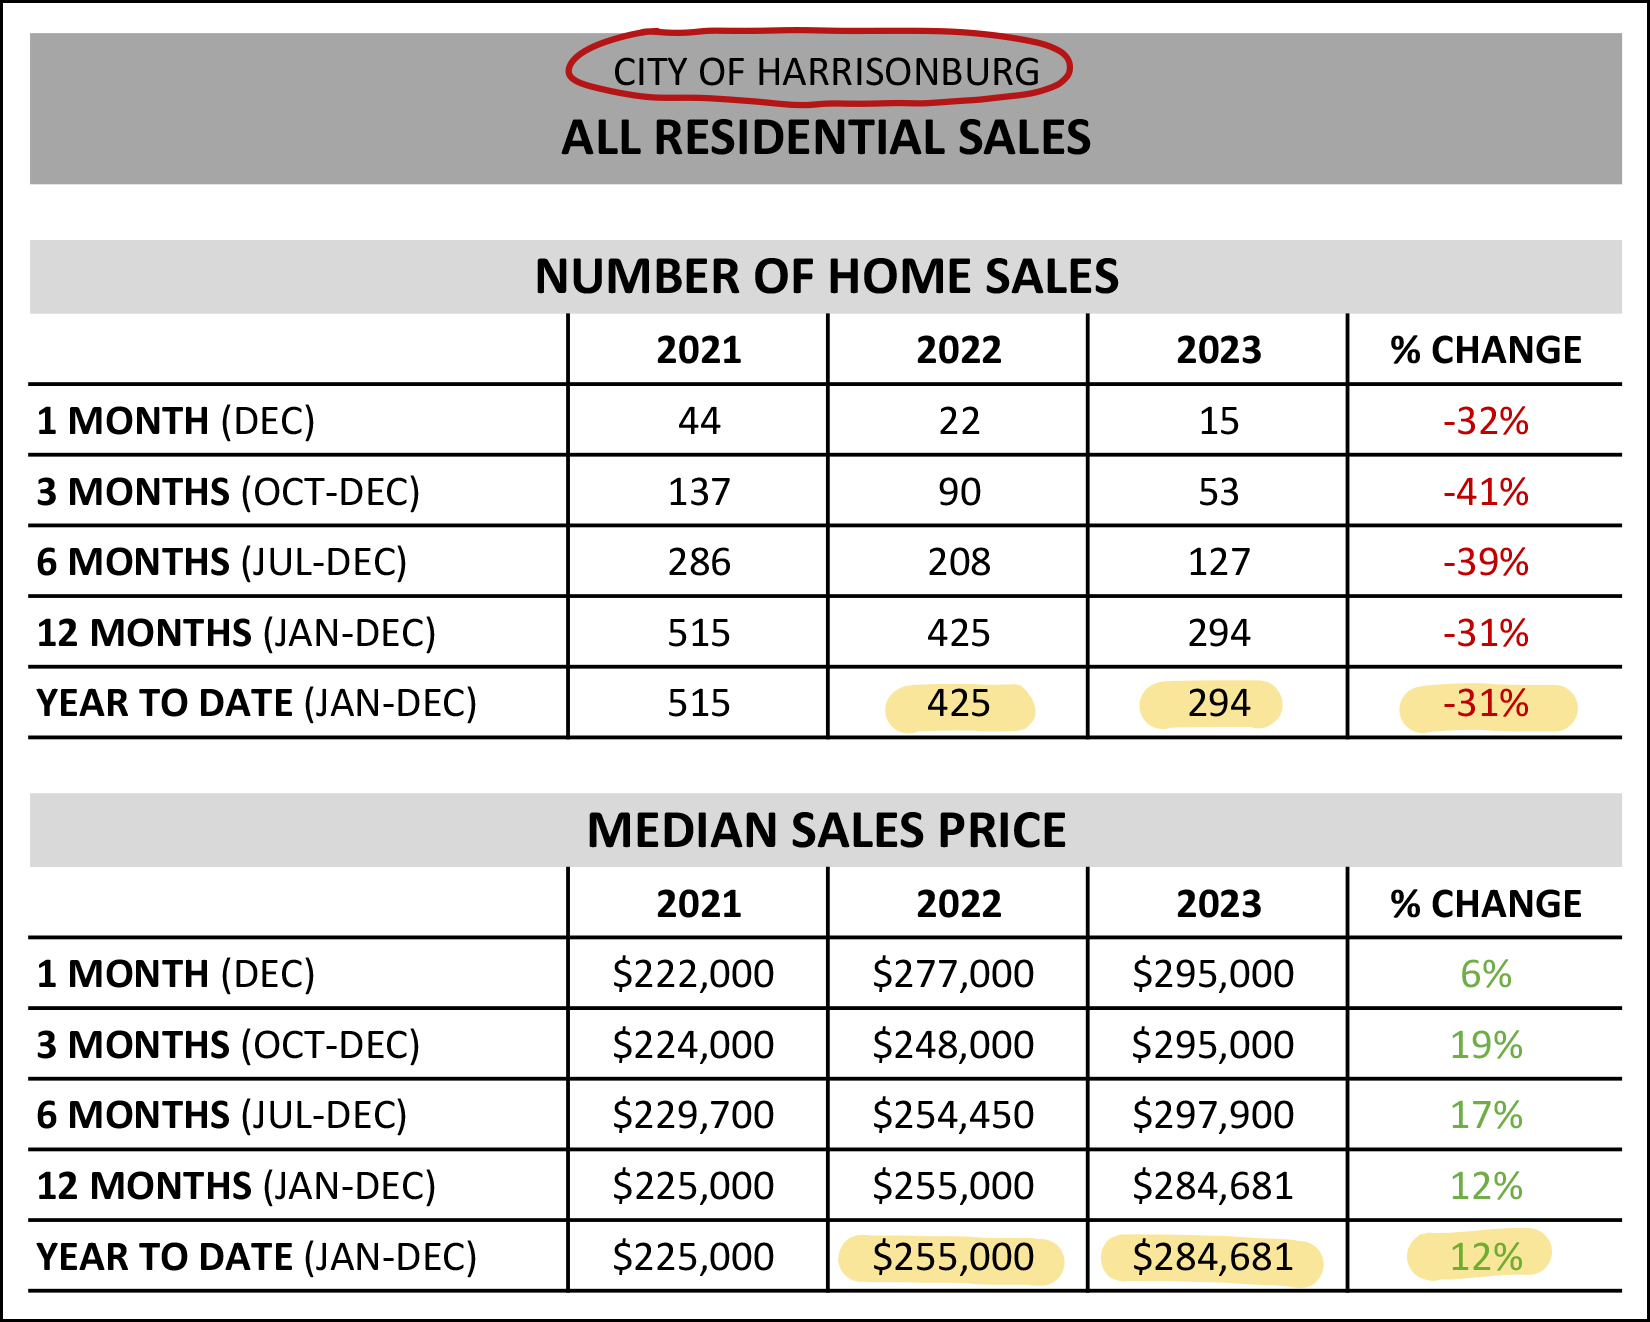 The chart above analyzes the sale of only homes located in the City of Harrisonburg. Compared to the market-wide 23% drop in number of homes selling and 10% increase in median sales prices... [1] The number of homes selling in the City of Harrisonburg declined even further (31%) than the market-wide (23%) change in home sales. [2] The median sales prices of homes selling in the City of Harrisonburg increased even more (+12%) than all homes in the market (+10%). Now, beyond location, let's break things down briefly by property type... 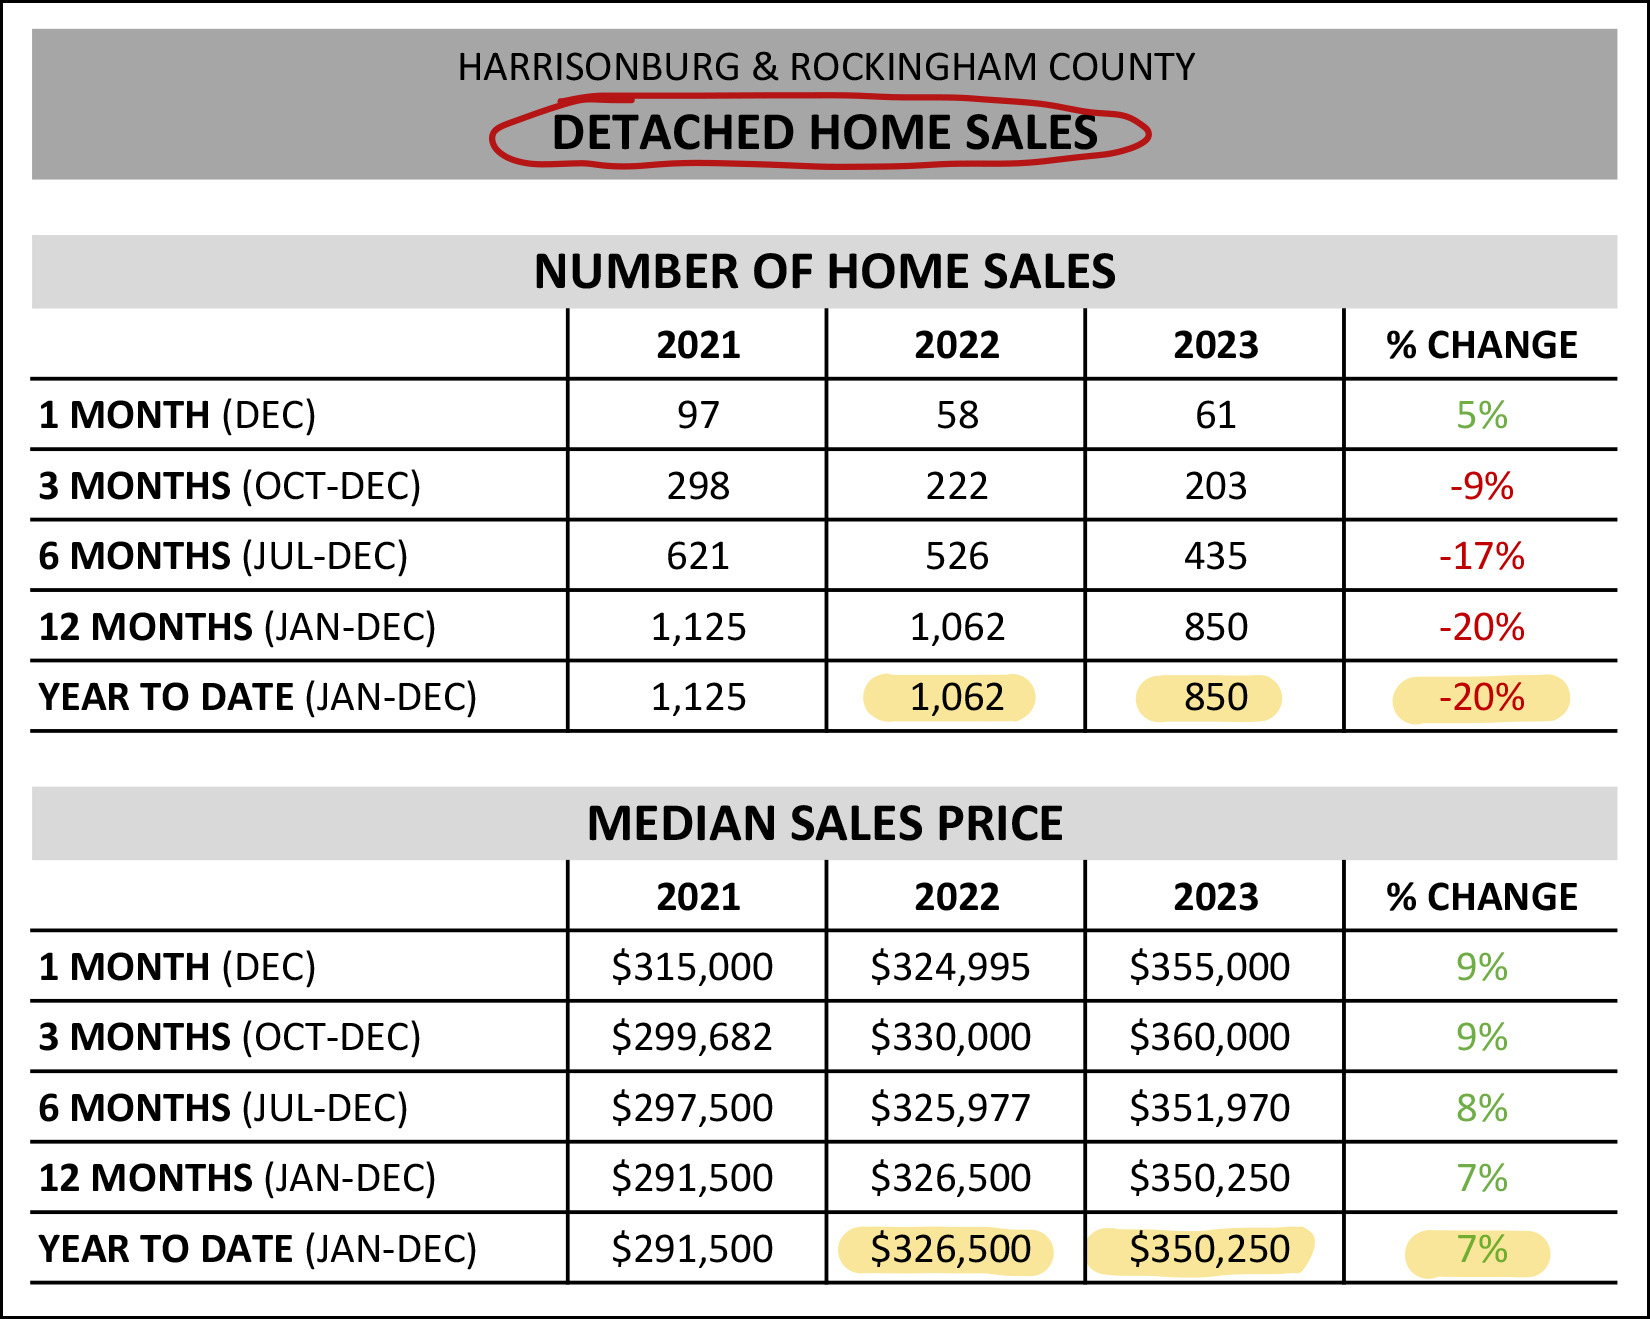 The chart above evaluates only detached homes (single family homes) in the City of Harrisonburg and Rockingham County. Compared to the market-wide 23% drop in number of homes selling and 10% increase in median sales prices... [1] The number of detached homes selling didn't decline quite as far (-20%) as the market overall (-23%) in 2023. [2] The median price of detached homes only increased 7% over the past year, as compared to the market-wide increase of 10%. This a good example of why every homeowner in Harrisonburg and Rockingham County shouldn't necessarily assume that their home's value increased by 10% over the past year. If you own a detached home that change may very well have only been 7%. And how about those attached homes? 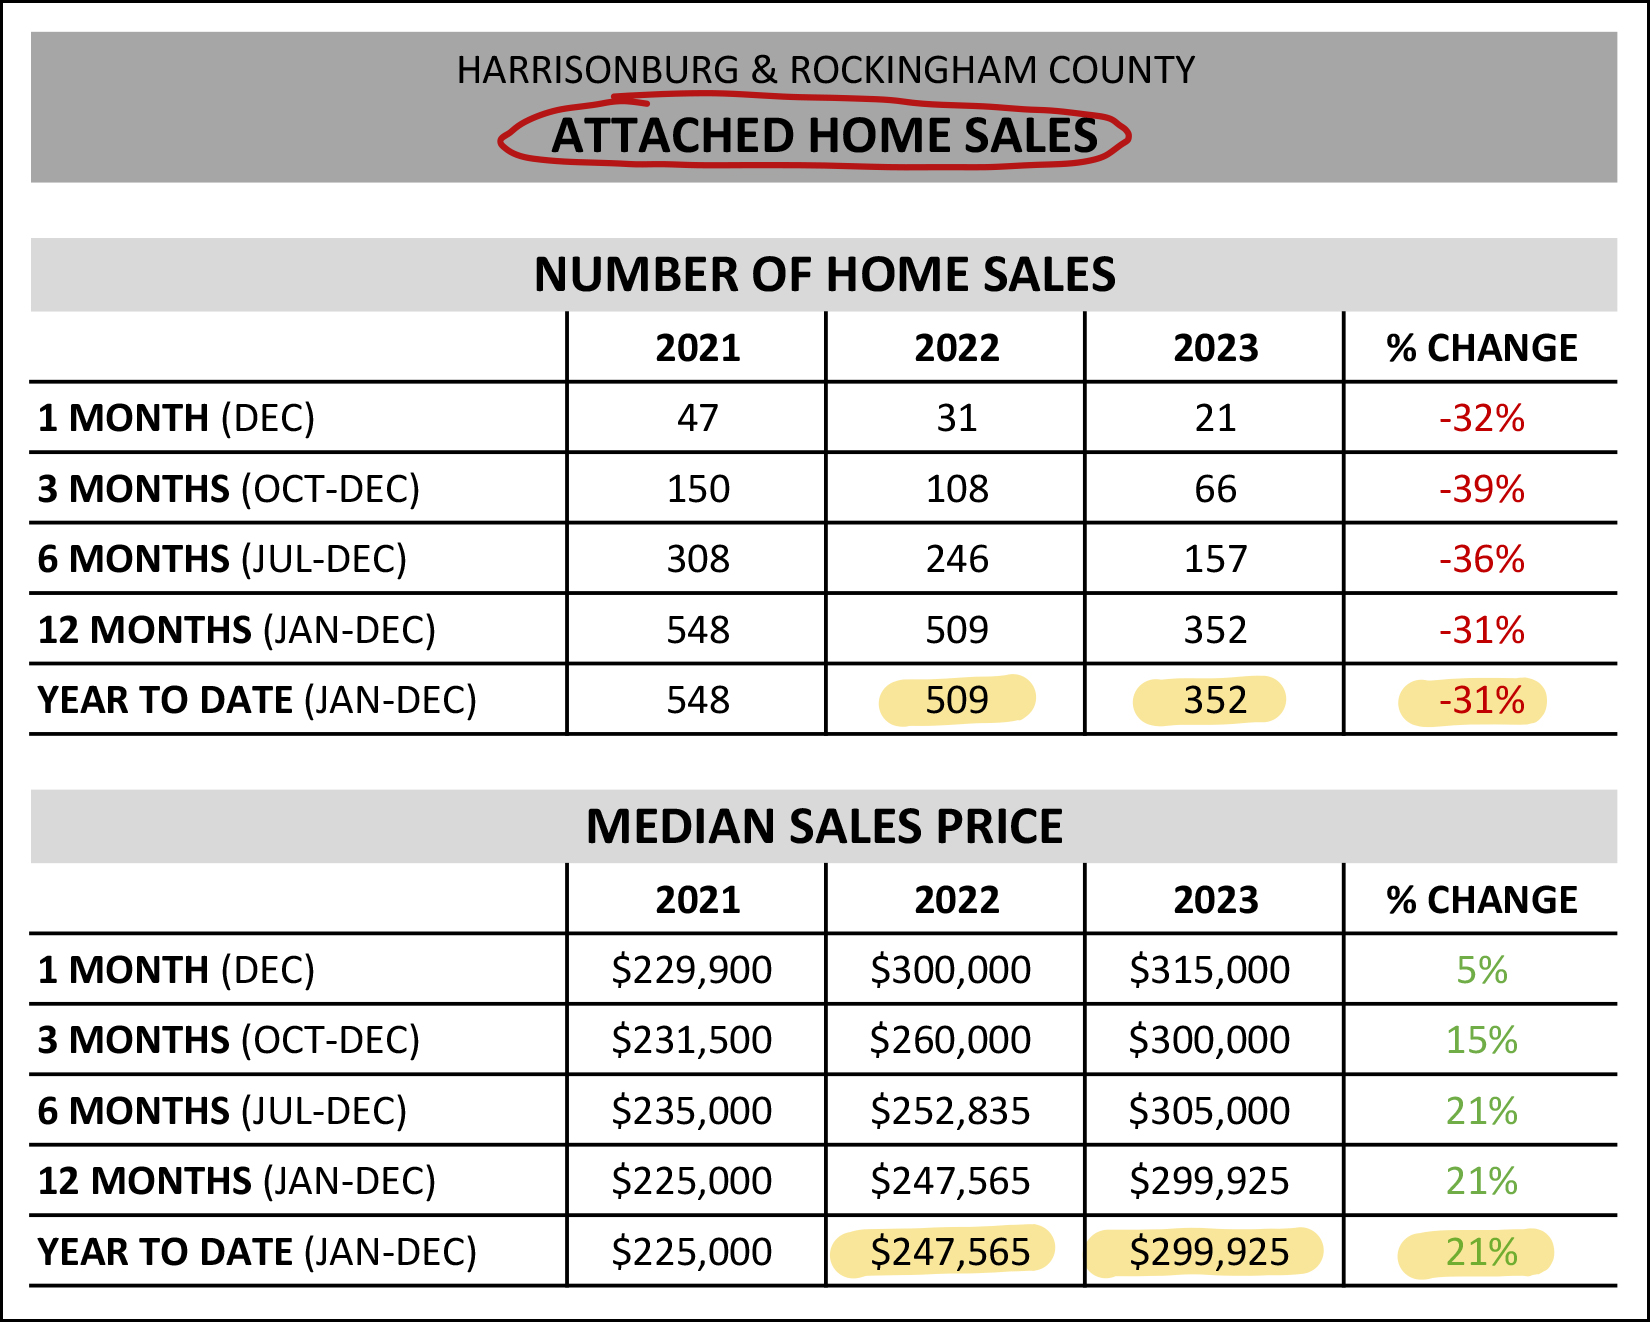 The chart above evaluates only attached homes (duplexes, townhomes, condos) in the City of Harrisonburg and Rockingham County. Compared to the market-wide 23% drop in number of homes selling and 10% increase in median sales prices... [1] We saw a somewhat larger decline (-31%) in the number of attached homes selling in 2023 compared to the overall market (-23%). [2] We saw a much (!!) larger increase in the median sales price of these attached homes (+20%) as compared to the overall market (+10%). But... before you assume that your attached home increased in value by 20% over the past year... remember that plenty of these attached homes were new homes, thus selling at higher prices, thus helping elevate this median sales price. Speaking of new homes, let's look at how things trended for just the existing homes in our market... 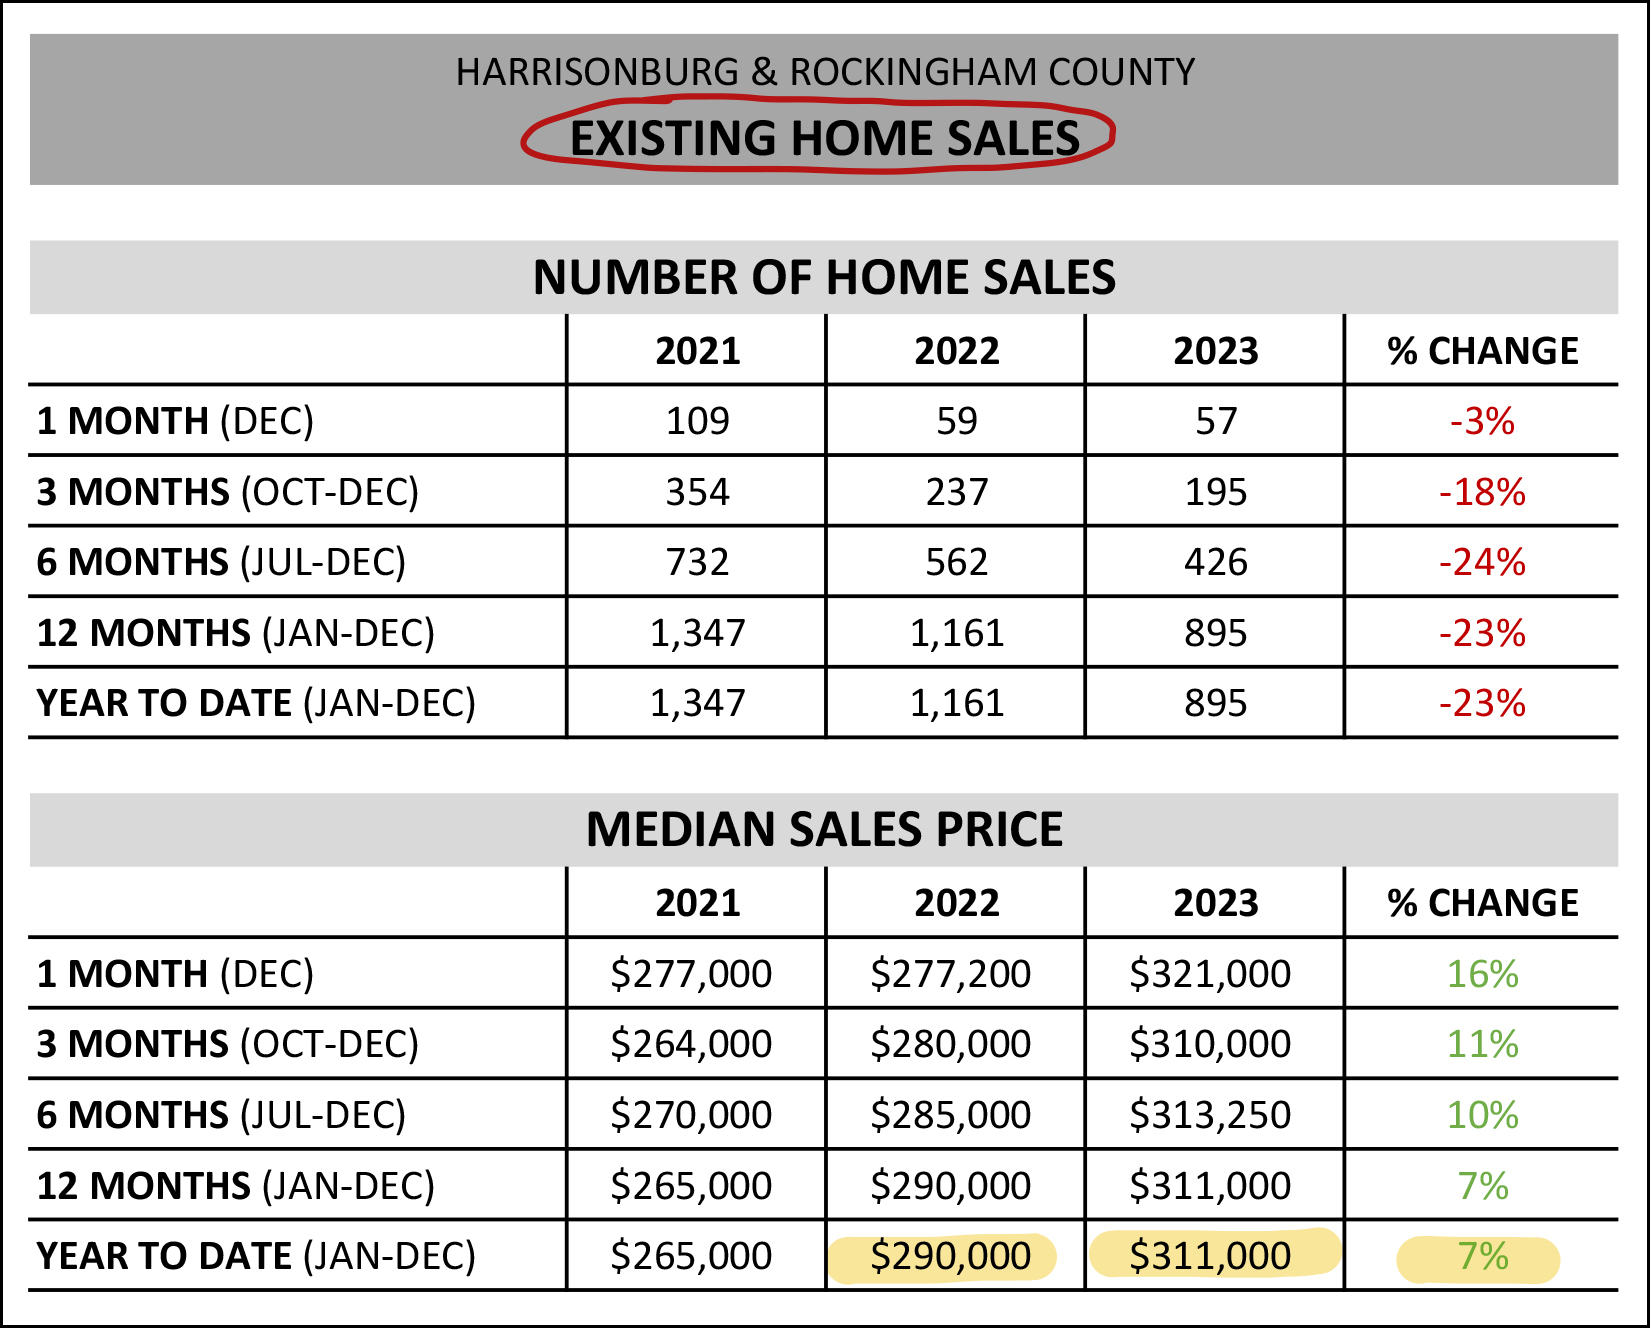 When looking at only existing home sales (not sales of new homes) we find... [1] The decline in existing home sales is exactly in line (-23%) with the overall market. [2] The median sales price of existing homes only rose 7% over the past year, compared to the market-wide increase of 10%. If you love the data and want to dig into these charts and related charts even further, you can do so here. :-) Now, let's see if some pictures (graphs) can help us further understand the current state of our local housing market and where we might be heading next... 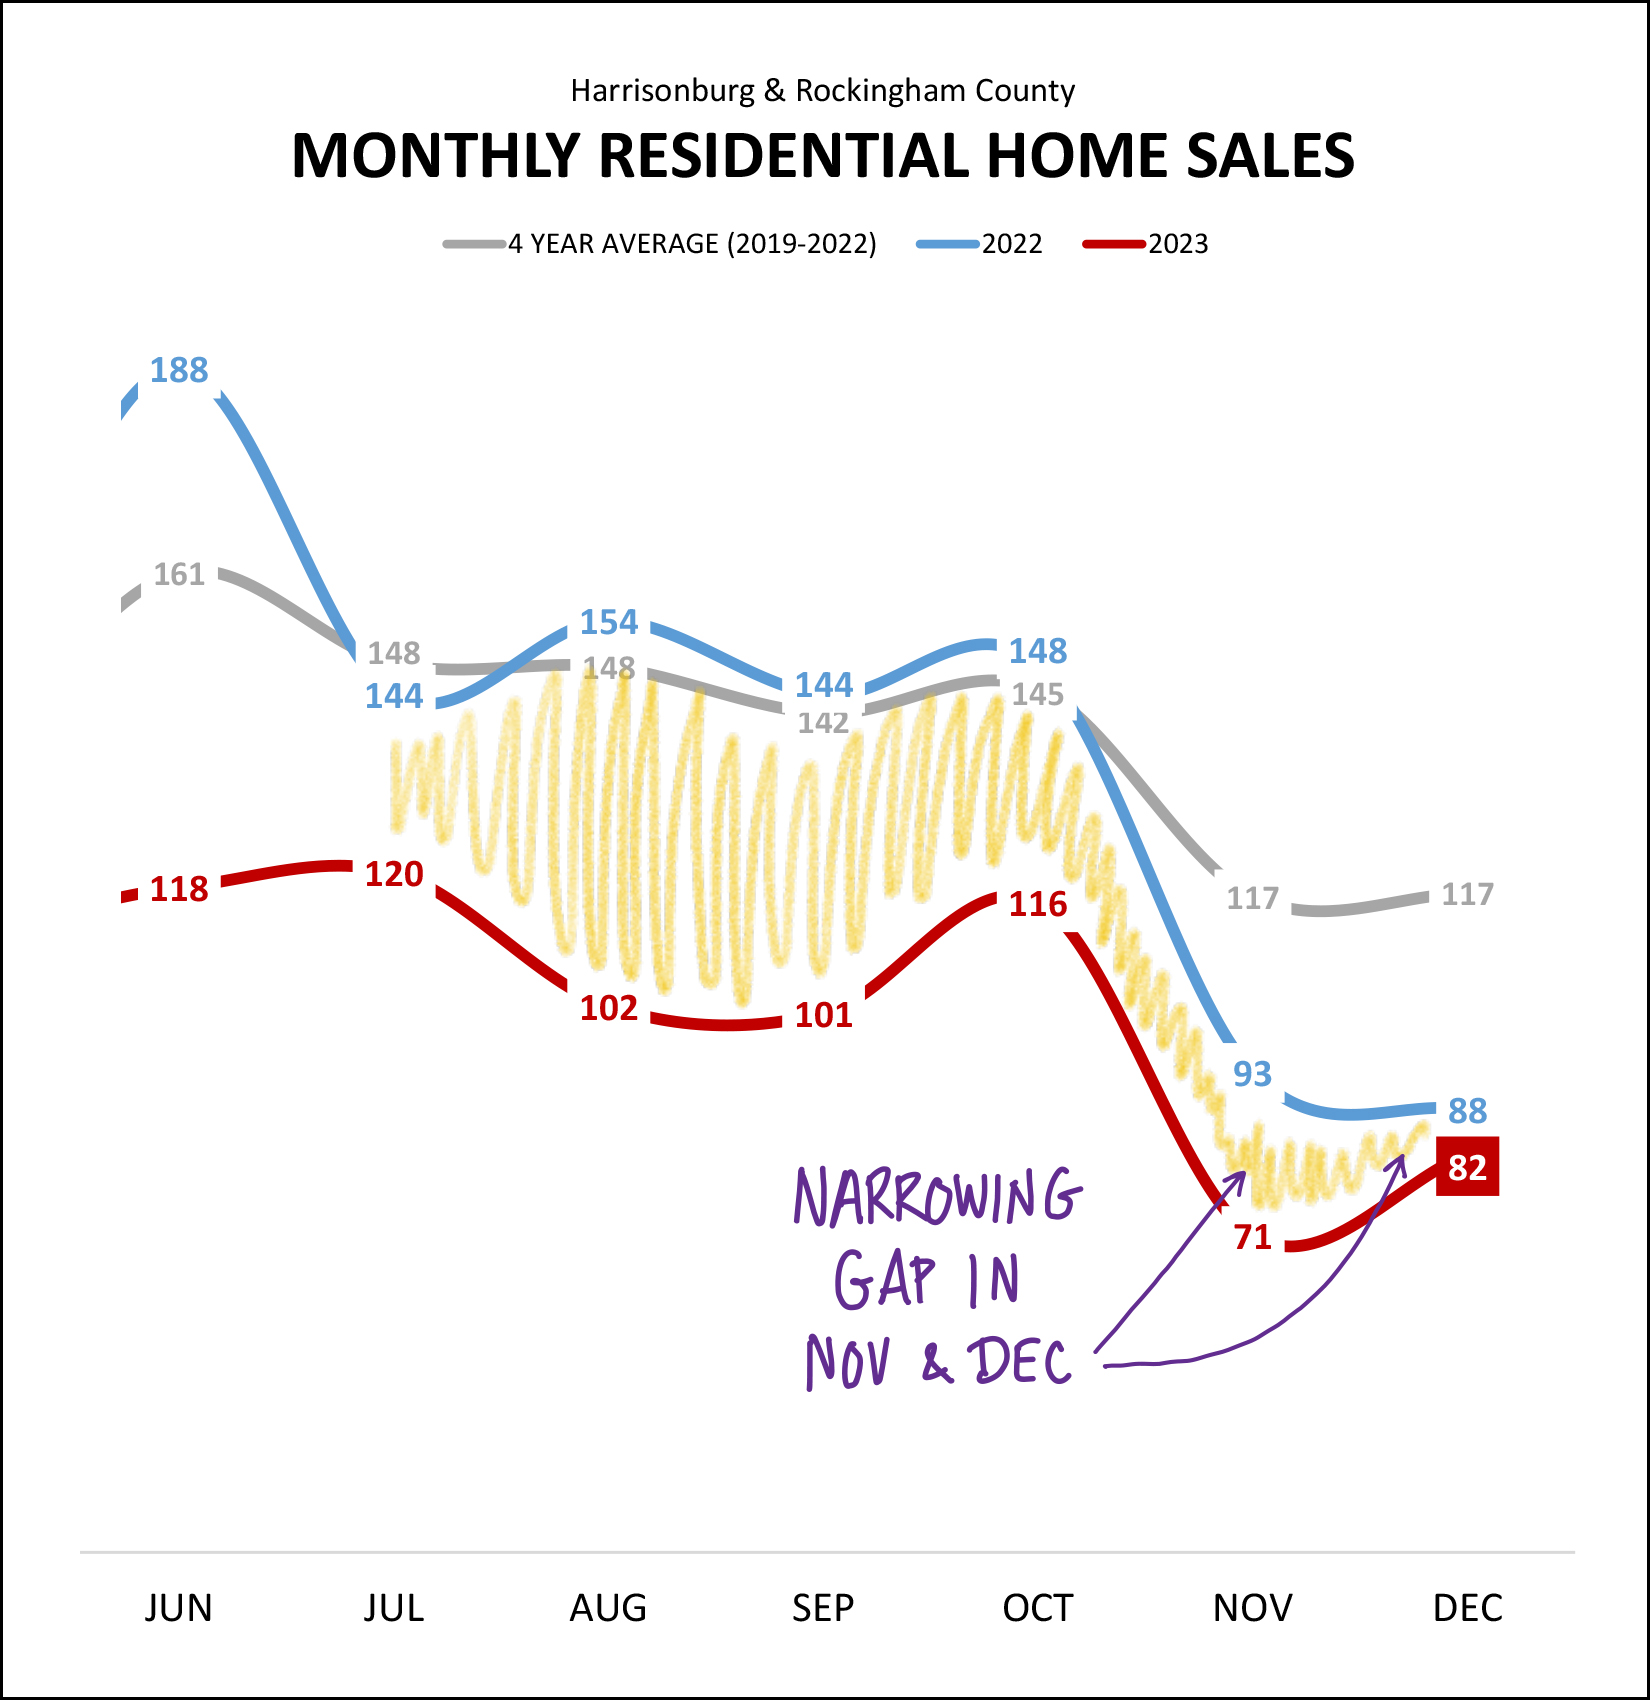 The graph above tracks the number of home sales that took place each month in 2023 (red line), 2022 (blue line) and the average number taking place per month over four years (2019-2022). As you can see from the shaded yellow area, all through the summer and through most of the fall we were seeing monthly home sales at levels quite a bit below last year's levels. But... then came November and December. In those final two months of the year we started to see the most recent year of home sales (2023) almost catching back up to the same month of home sales in 2022. To put things into an even longer / broader perspective... 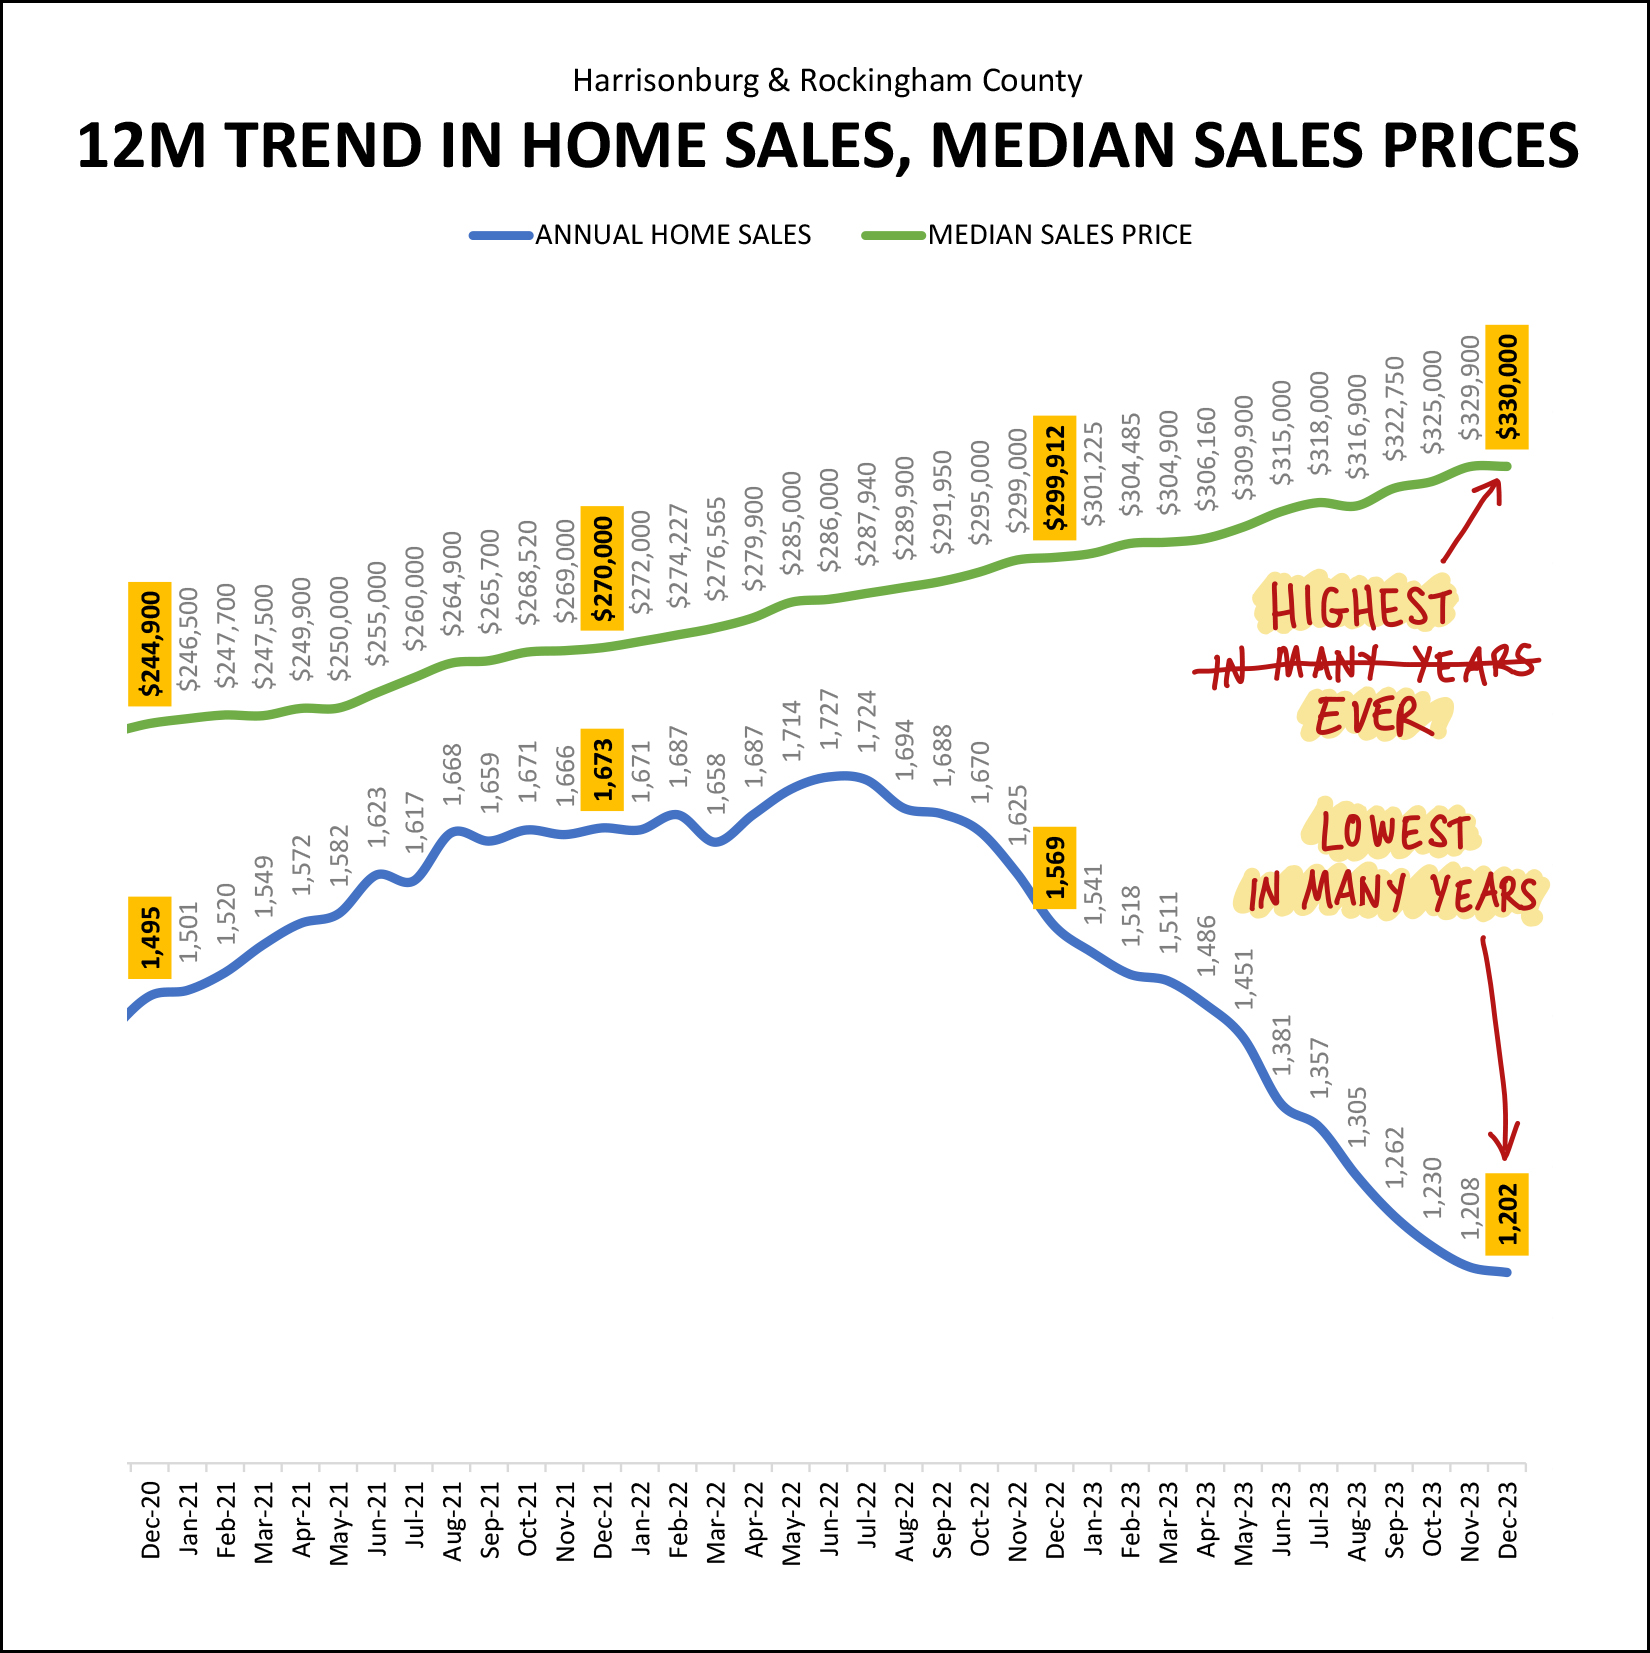 The current annual trend of home sales in the City and County has been falling (blue line) for the past year and a half. This annual sales pace peaked at 1,727 home sales in a year back in June 2022... but has been falling ever since. The current pace of 1,202 home sales a year is the lowest in many years! The current annualized median sales price in the City and County has been rising for just about a decade now, and at $330,000 it is at the highest point point it has ever been in our local area. To be clear, we've been setting new annual records for the median sales price for each of the past five (+) years -- so the "highest ever" isn't a new phenomenon -- it has been happening year after year since 2018. If you own a home, look at the next graph. If you don't... maybe don't look at the next graph? :-/ 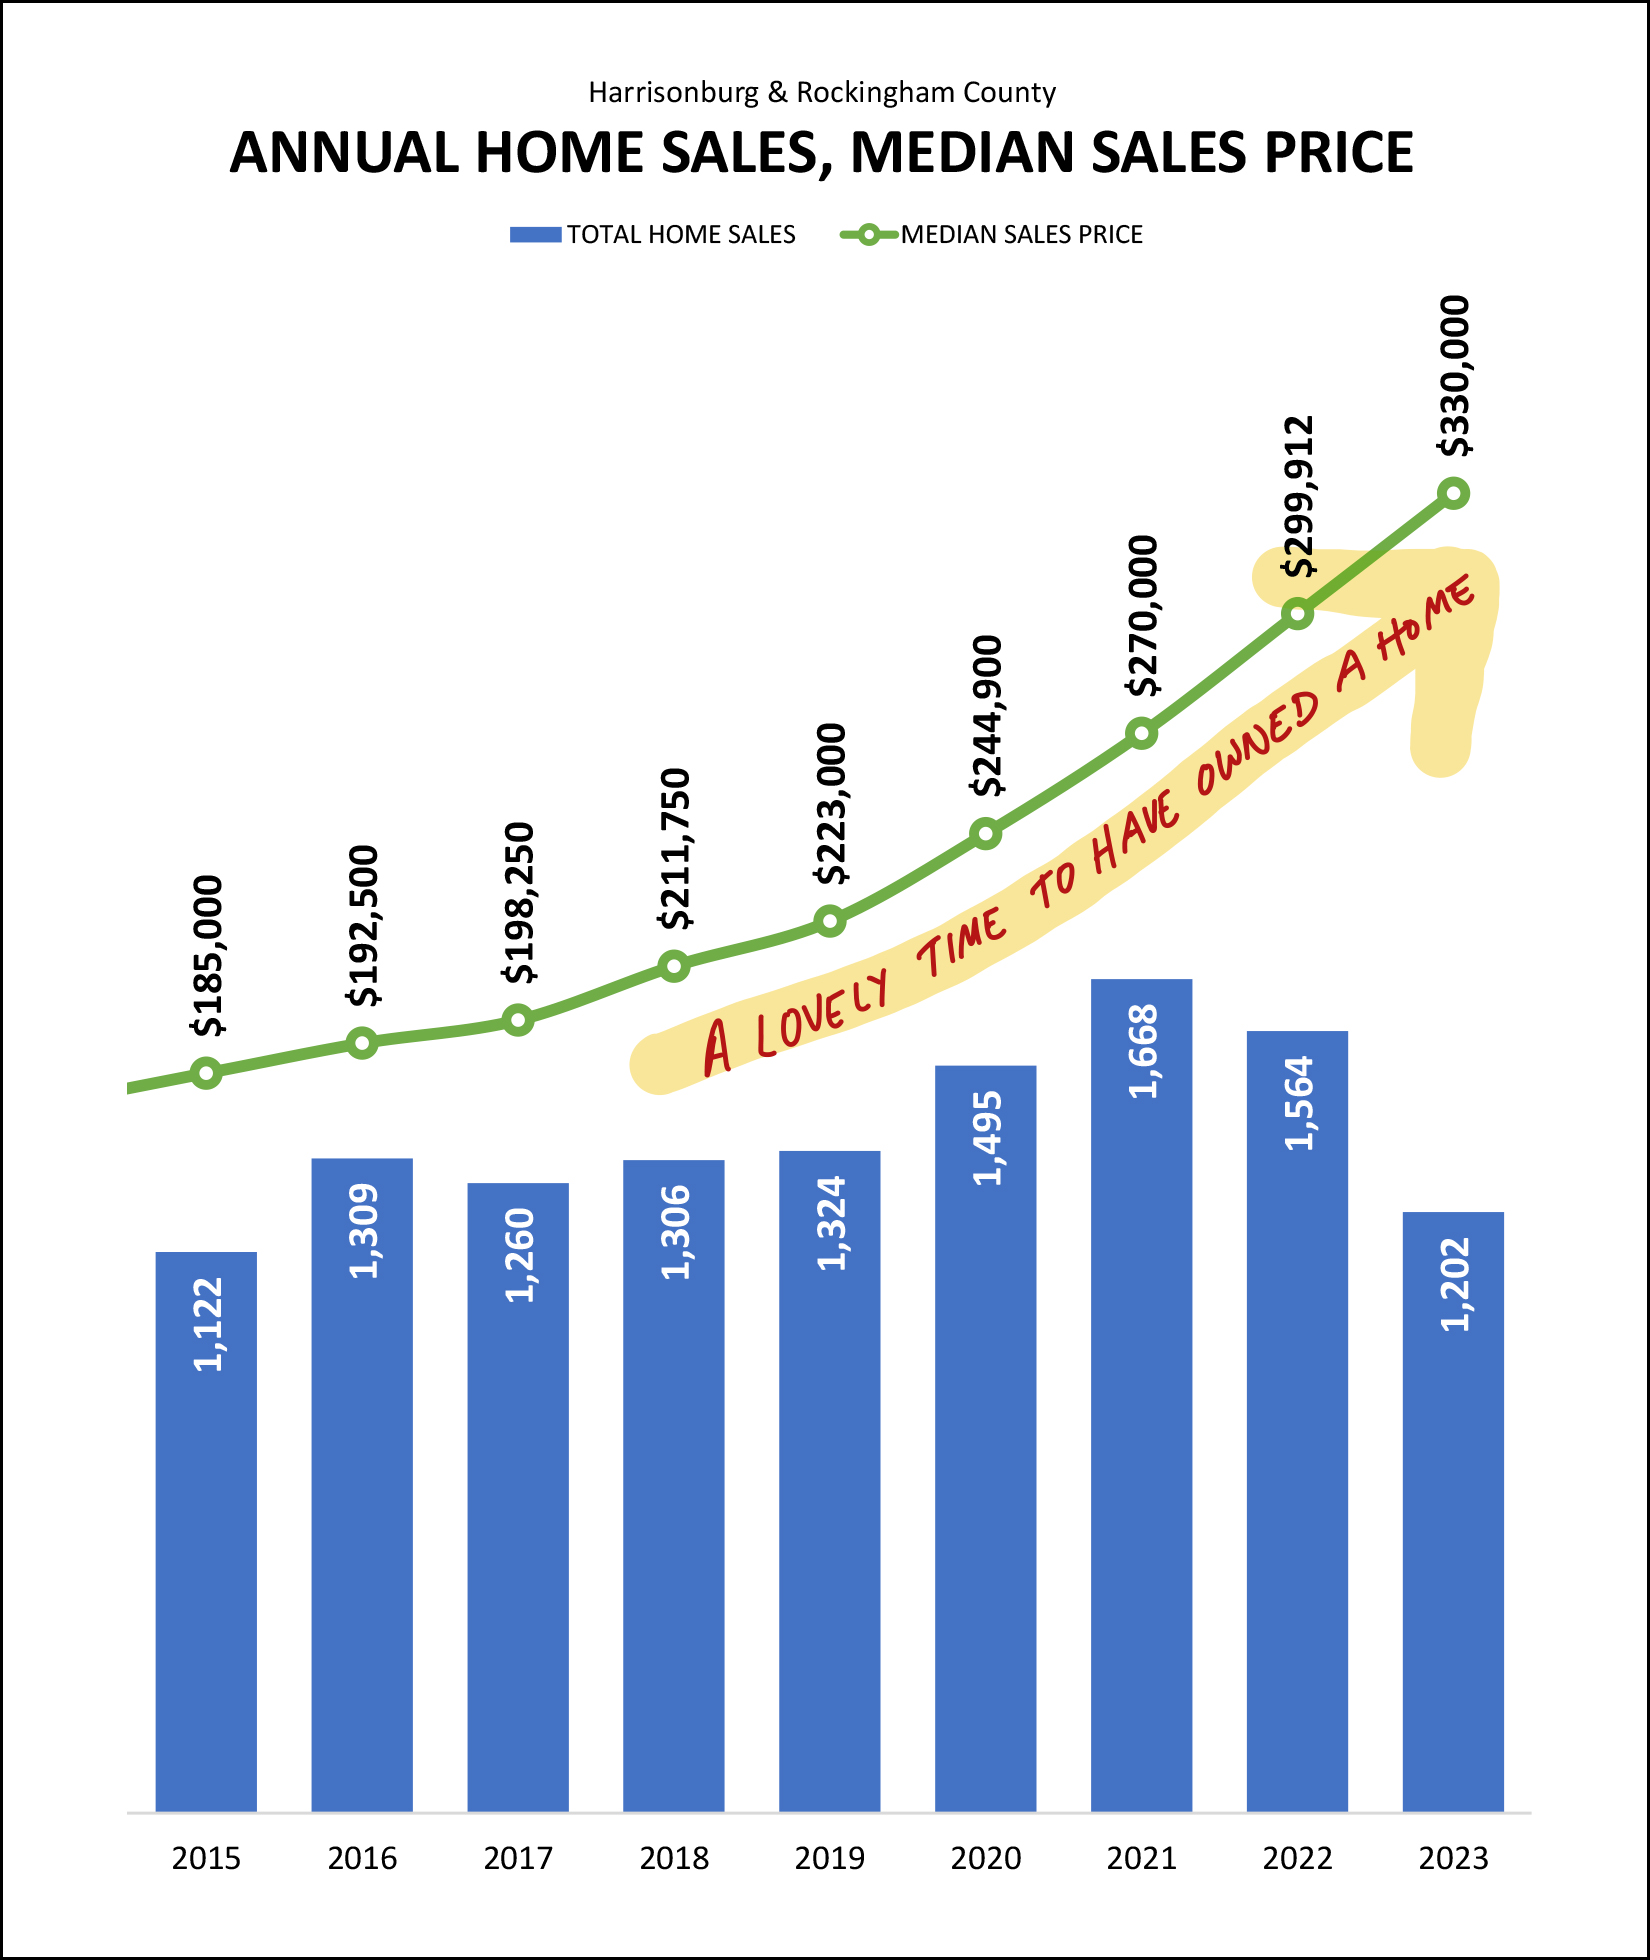 As shown above, it has been a LOVELY time to have owned a home over the past five years. Home prices have been blazing their way upward between 2018 and 2023 with a total of a 56% increase in the median sales price during that timeframe! What happens next, you might ask? I think it is highly unlikely that we will see another 56% increase in the median sales price over the next five years... but home values do seem poised to continue to increase in our local area over the next few years, even if not as quickly. And now to help you visualize the faster than the overall market increases in the median sales price of attached homes... 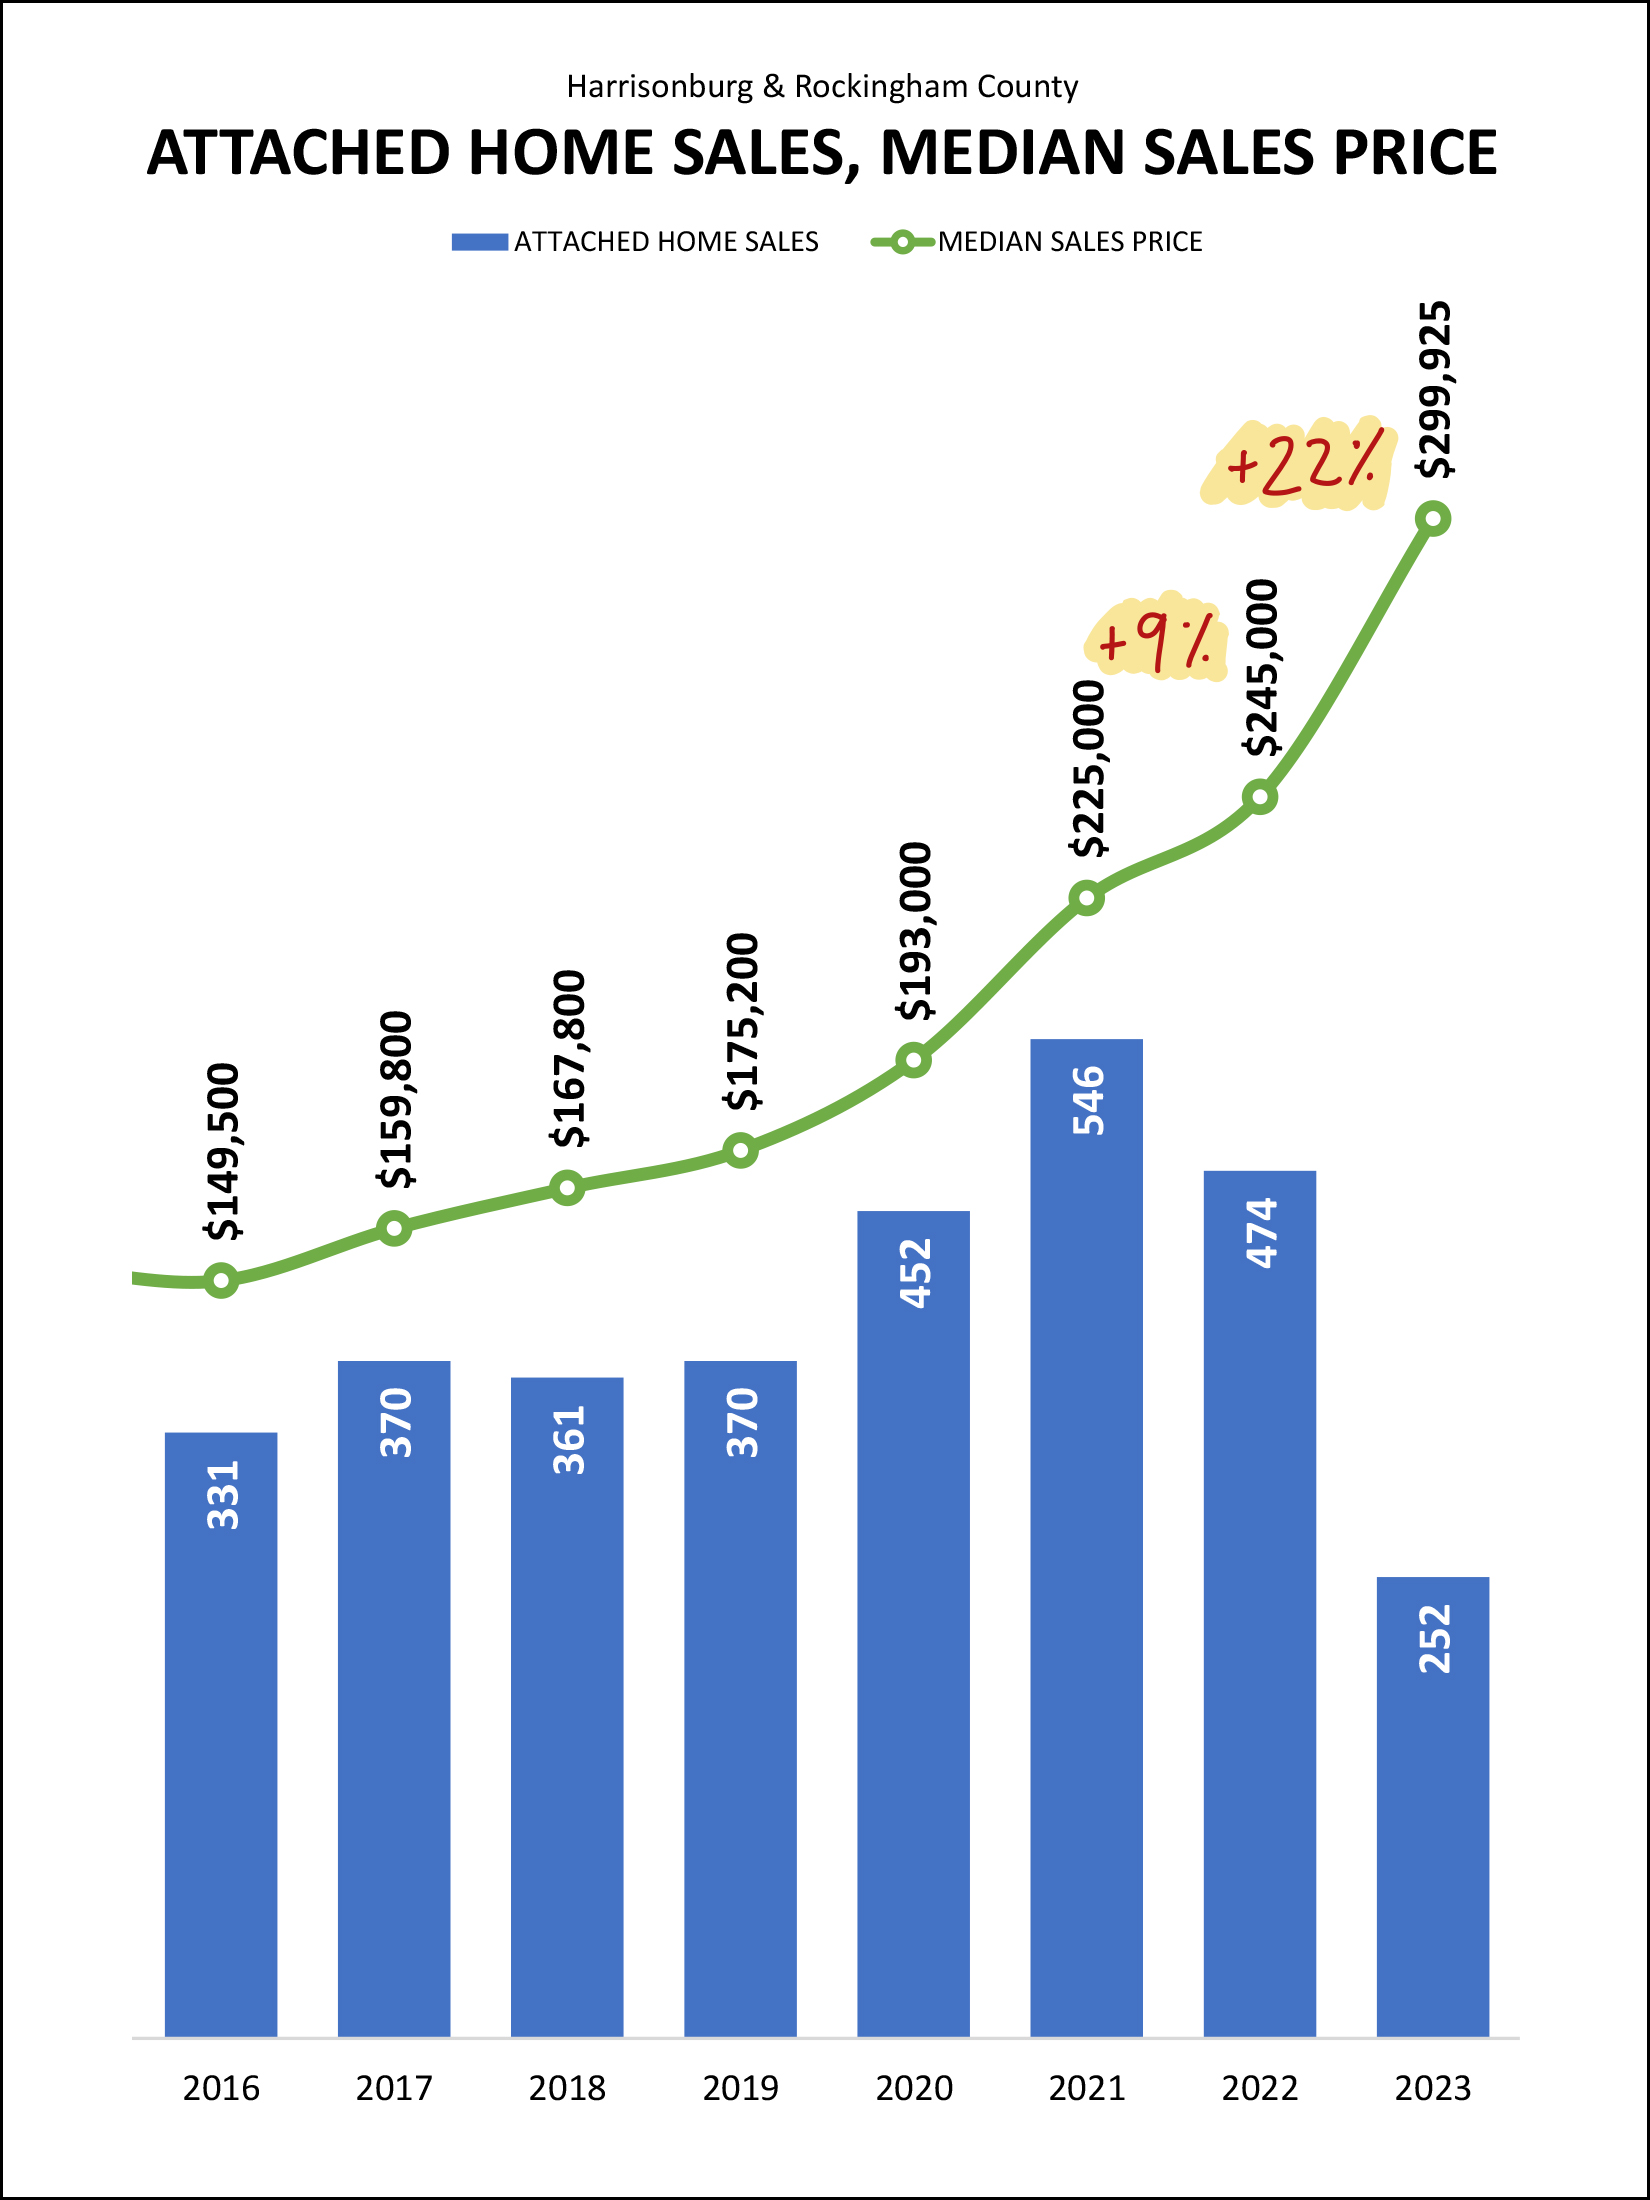 Indeed, as shown above, the median sales price of attached homes (townhouses, duplexes, condos) is increasing QUICKLY! Between 2021 and 2022 we saw a 9% increase in the median sales price of attached homes in Harrisonburg and Rockingham County. In 2023, we saw a 22% increase in this median sales price! Again, at least a portion of this is the influence of higher prices of new attached homes -- but regardless of how you slice and dice the data, the price of attached homes is rising, quickly. This next graph looks at new (vs. existing) home sales -- in two ways... 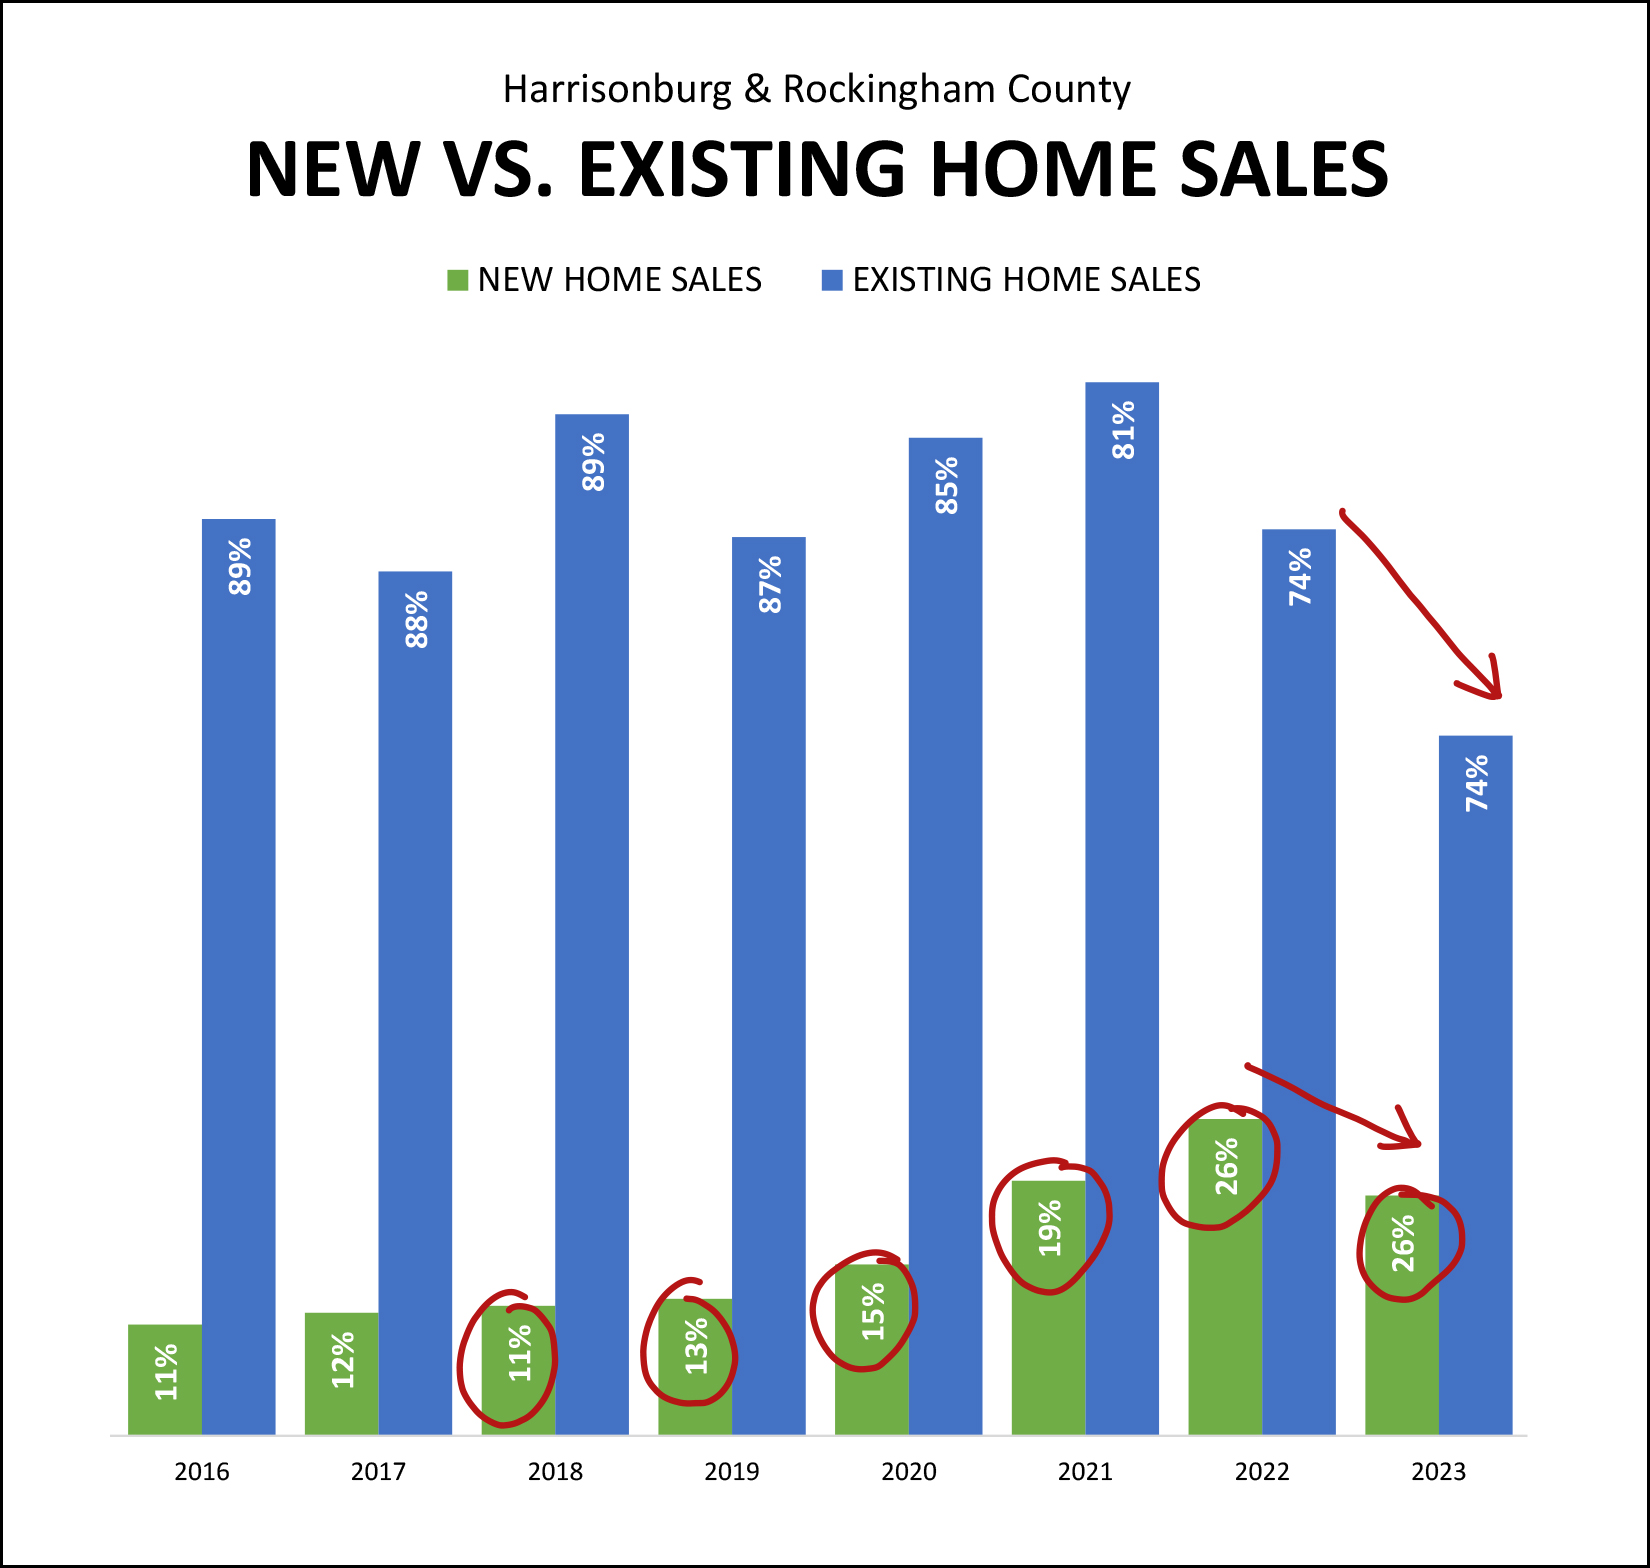 First, we should note that the number of both existing homes (blue bars) and new homes (green bars) declined between 2022 and 2023. We saw fewer sellers selling and buyers buying -- both existing homes and new homes. But... five years ago new home comprised 11% of the total number of home sales in 2018... and this past year new home sales made up a much larger 26% share of overall home sales. I expect that we will continue to see a significant share of total home sales being new home sales... especially since so many existing homeowners (would be sellers) have very low fixed mortgage interest rates and won't be all that excited to sell their homes while interest rates are still at/above 6%. Now, looking at some of the most recent market activity... contracts being signed... 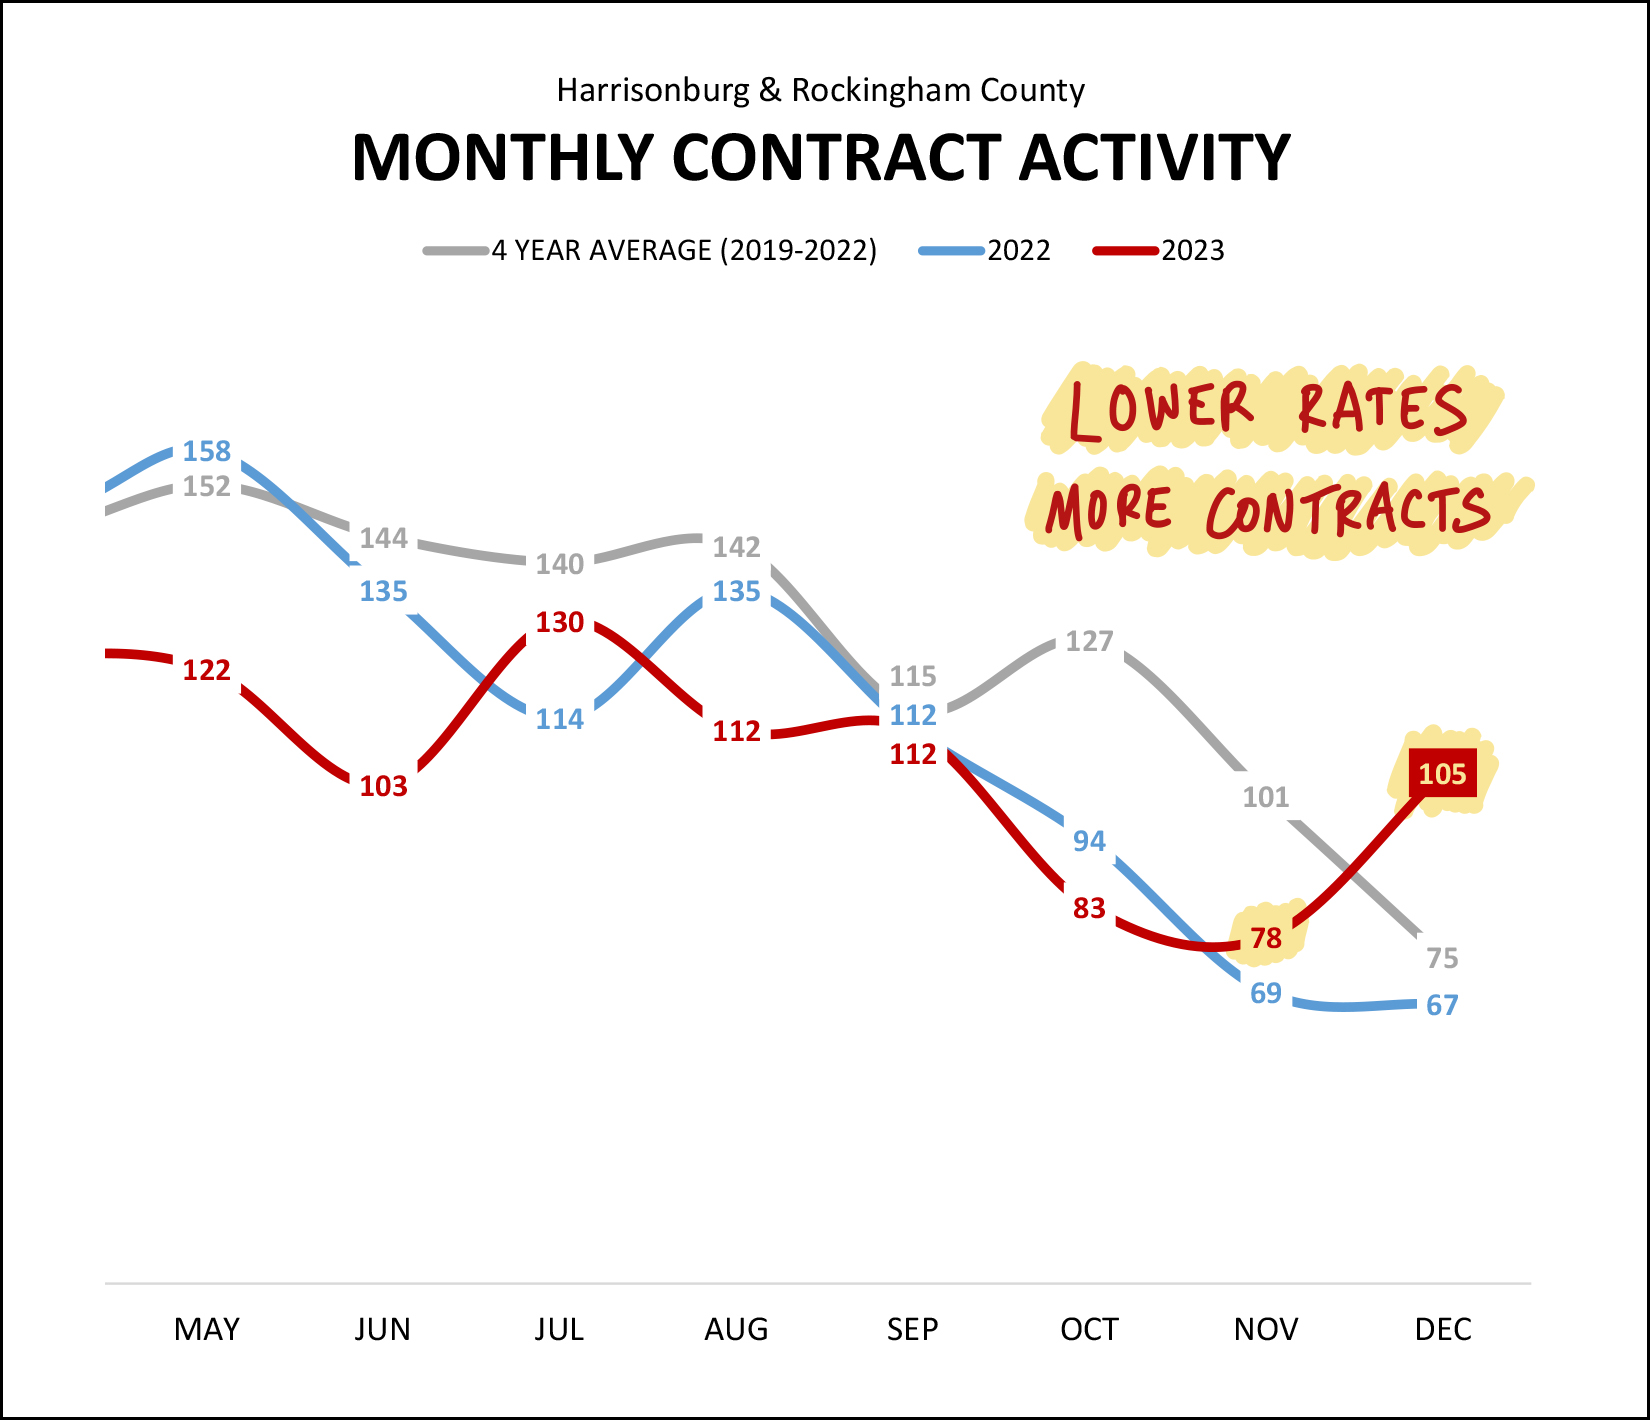 The red line above shows the number of contracts signed per month compared to the same month last year in a blue line. You'll note that most of this year's (red) data points are a good bit below last year. But... not November of December. Contract activity this November snuck (barely) past last November... and contract activity this December blasted past last December with 105 contracts this December (2023) compared to only 67 the prior December (2022). And, as you might imagine, the increased pace at which contracts were signed in those two months pushed the "pending sales" numbers past where we were a year ago... 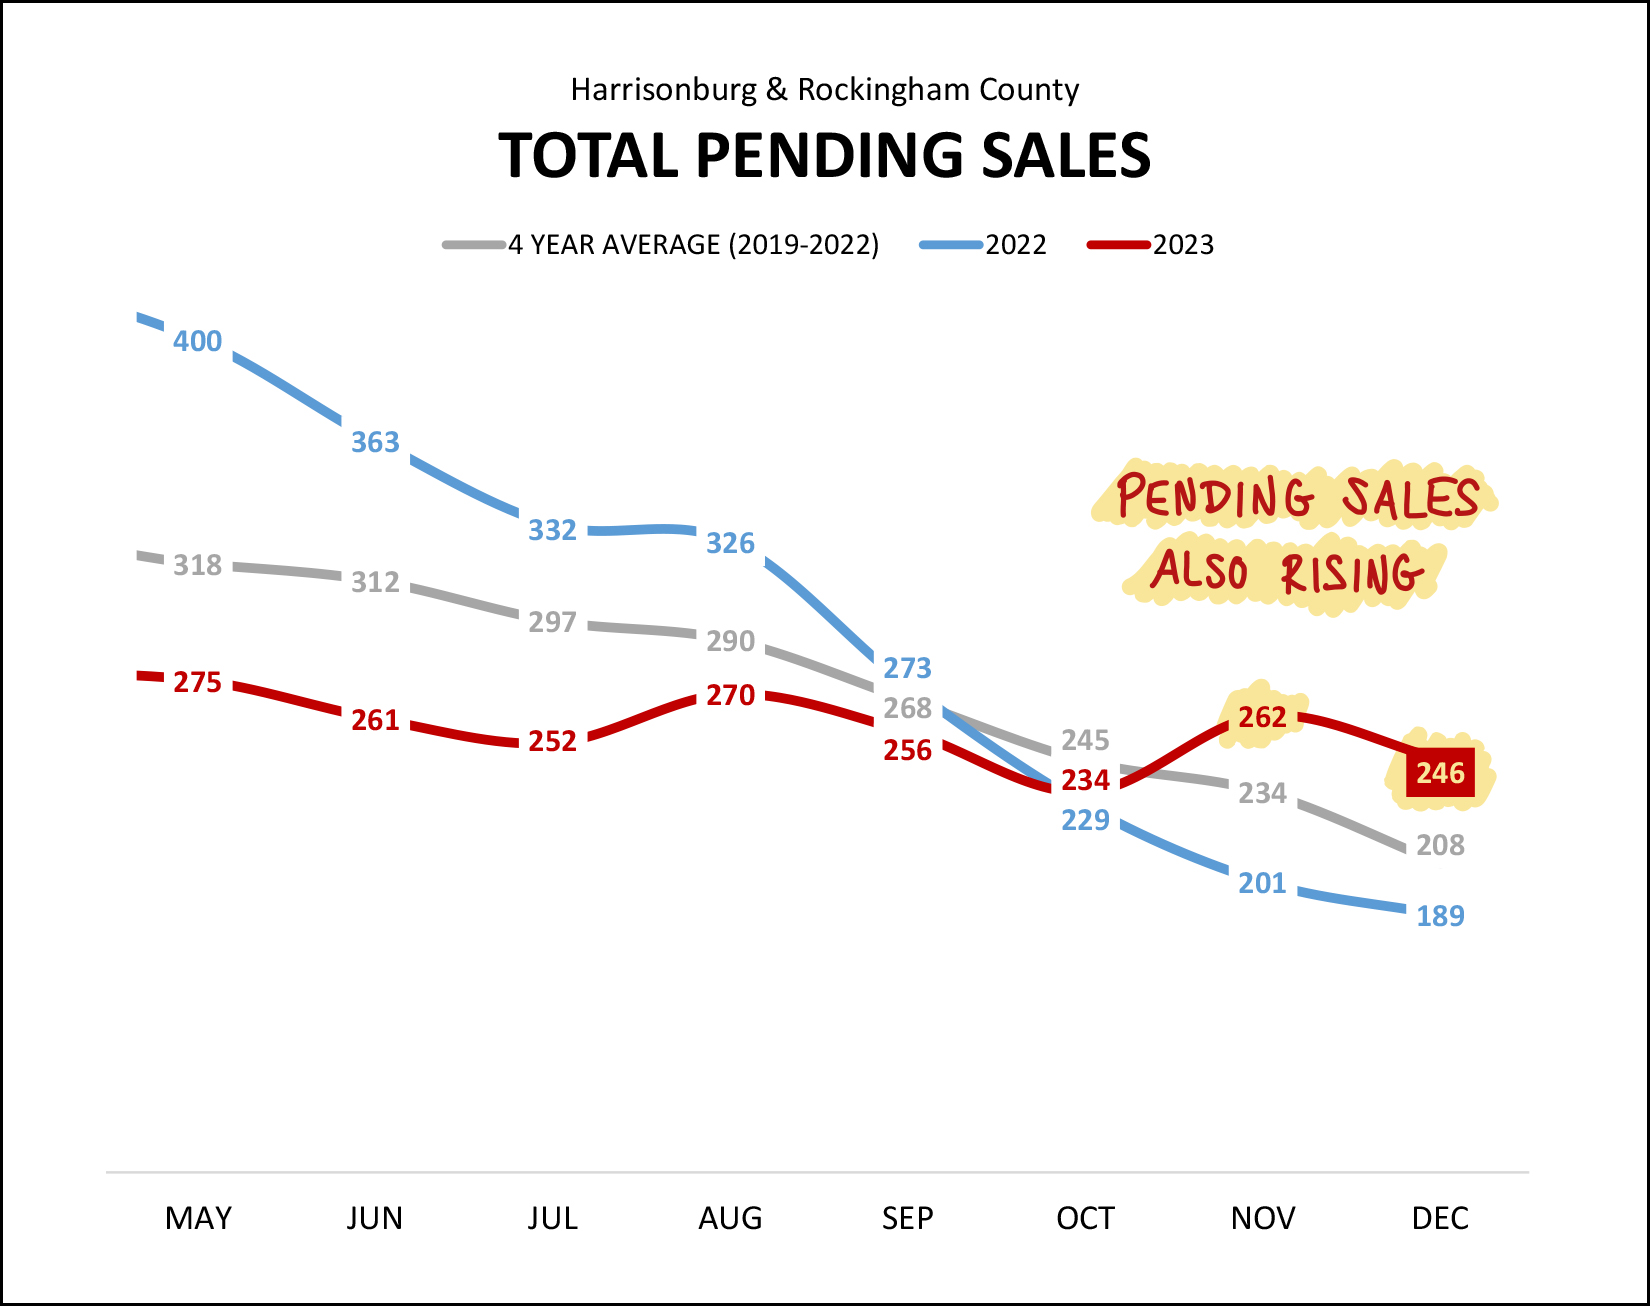 For most of 2023 we saw pending sales levels (total number of under contract properties) below where they were in the same month last year. But... that changed in October 2023 and contract activity in November and December pushed the pending sales numbers well ahead of where things were a year ago. We closed out 2022 with 189 properties under contract... compared to 246 properties under contract in December 2023! Have these contracts being signed start to make a dent in inventory levels that were otherwise rising? Good guess... 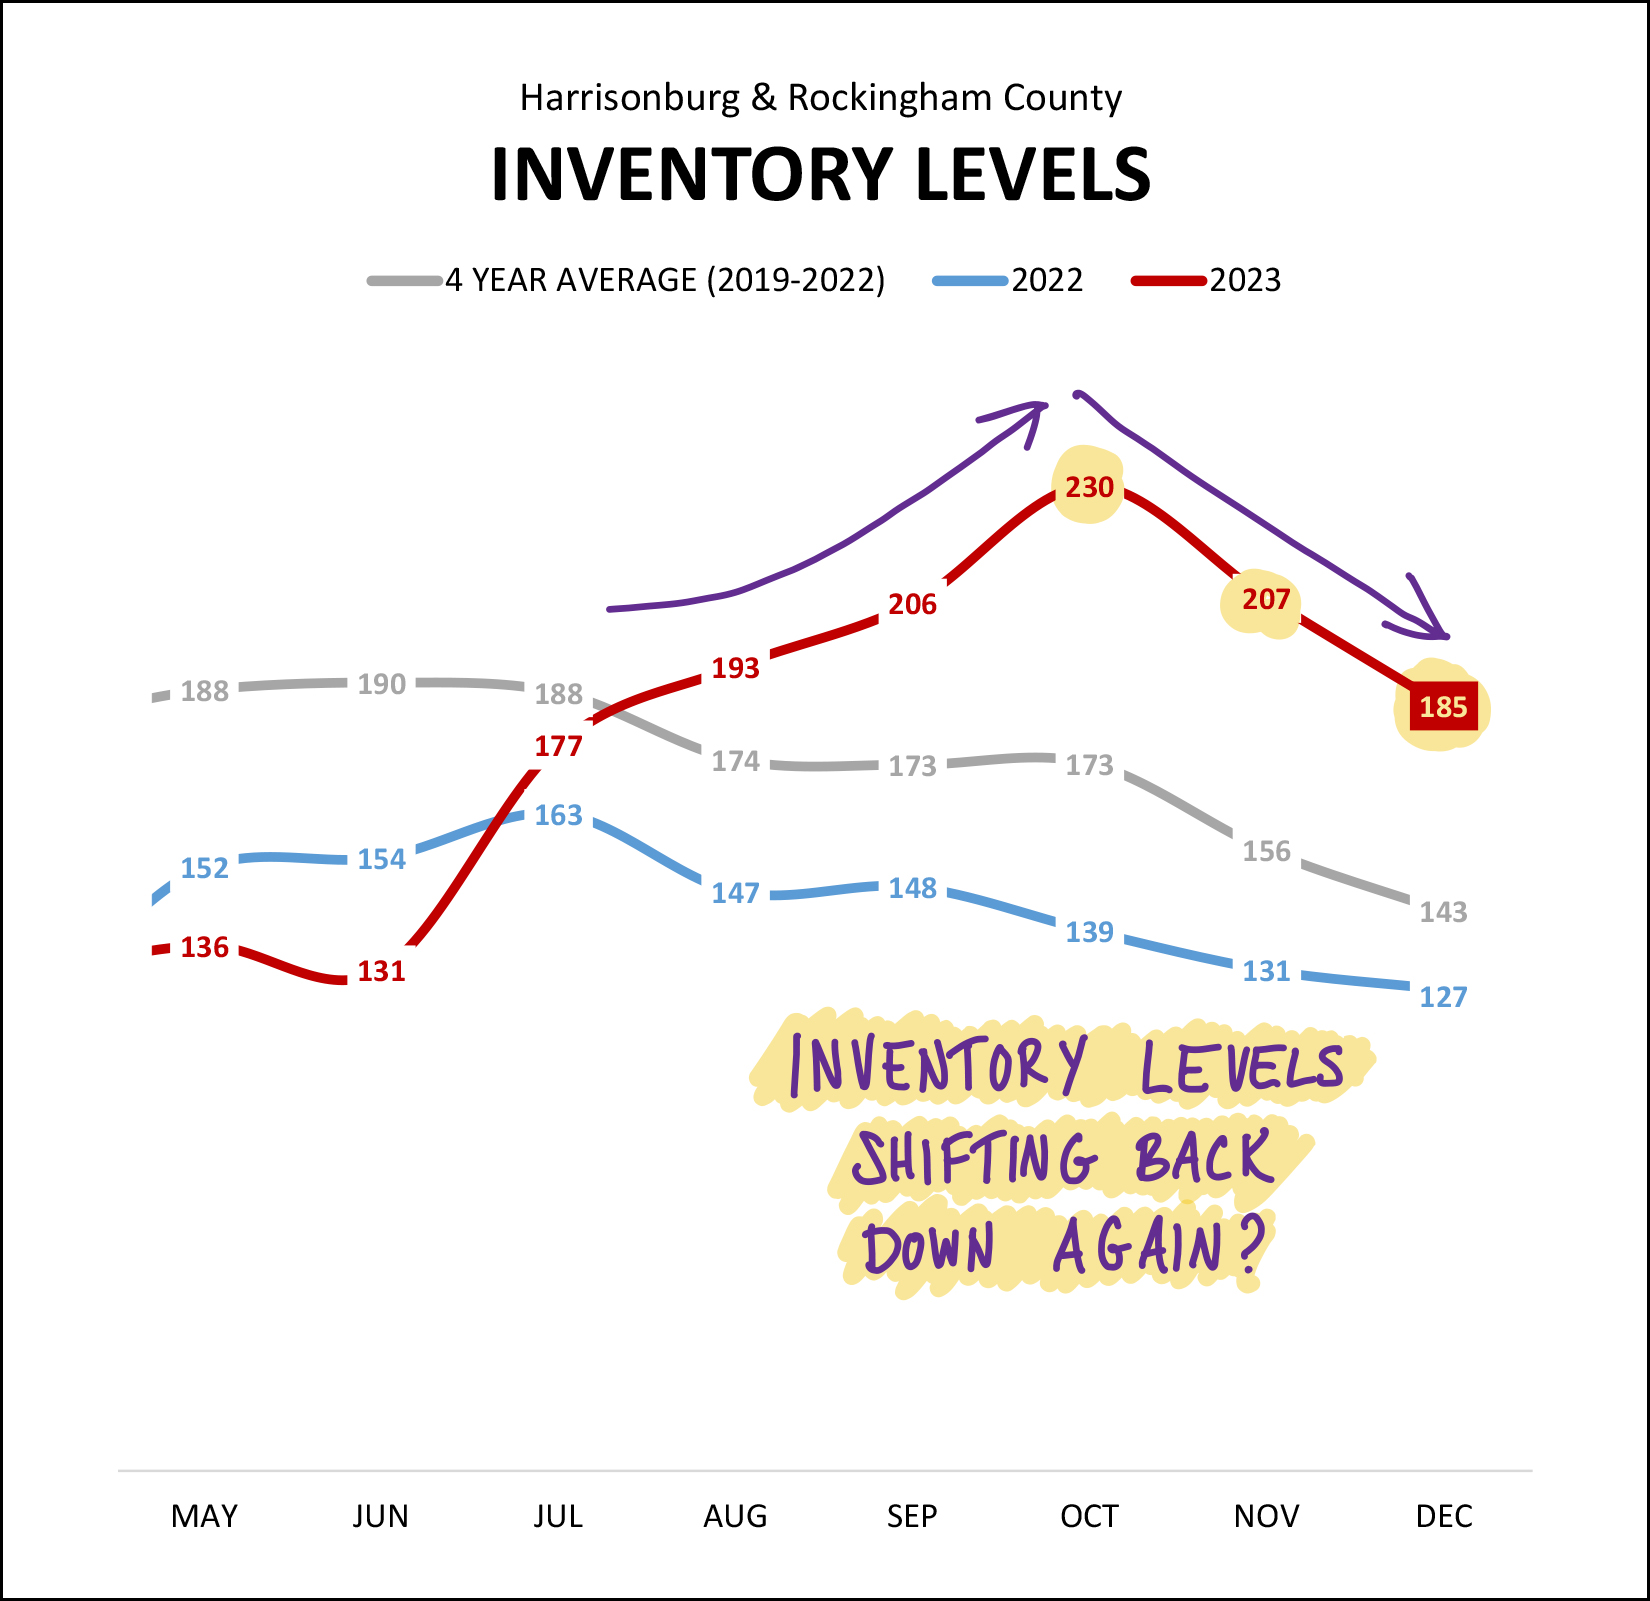 After seeing steady (rather rapid) increases in inventory levels between June 2023 and October 2023 (131 up to 230) those inventory levels started to decline again in November (to 207) and followed that trend in December (down to 185). Certainly, a higher than expected number of buyers signing contracts goes a long way towards reducing inventory levels. Was there anything else that declined, similarly, in November and December 2023? Let's see... 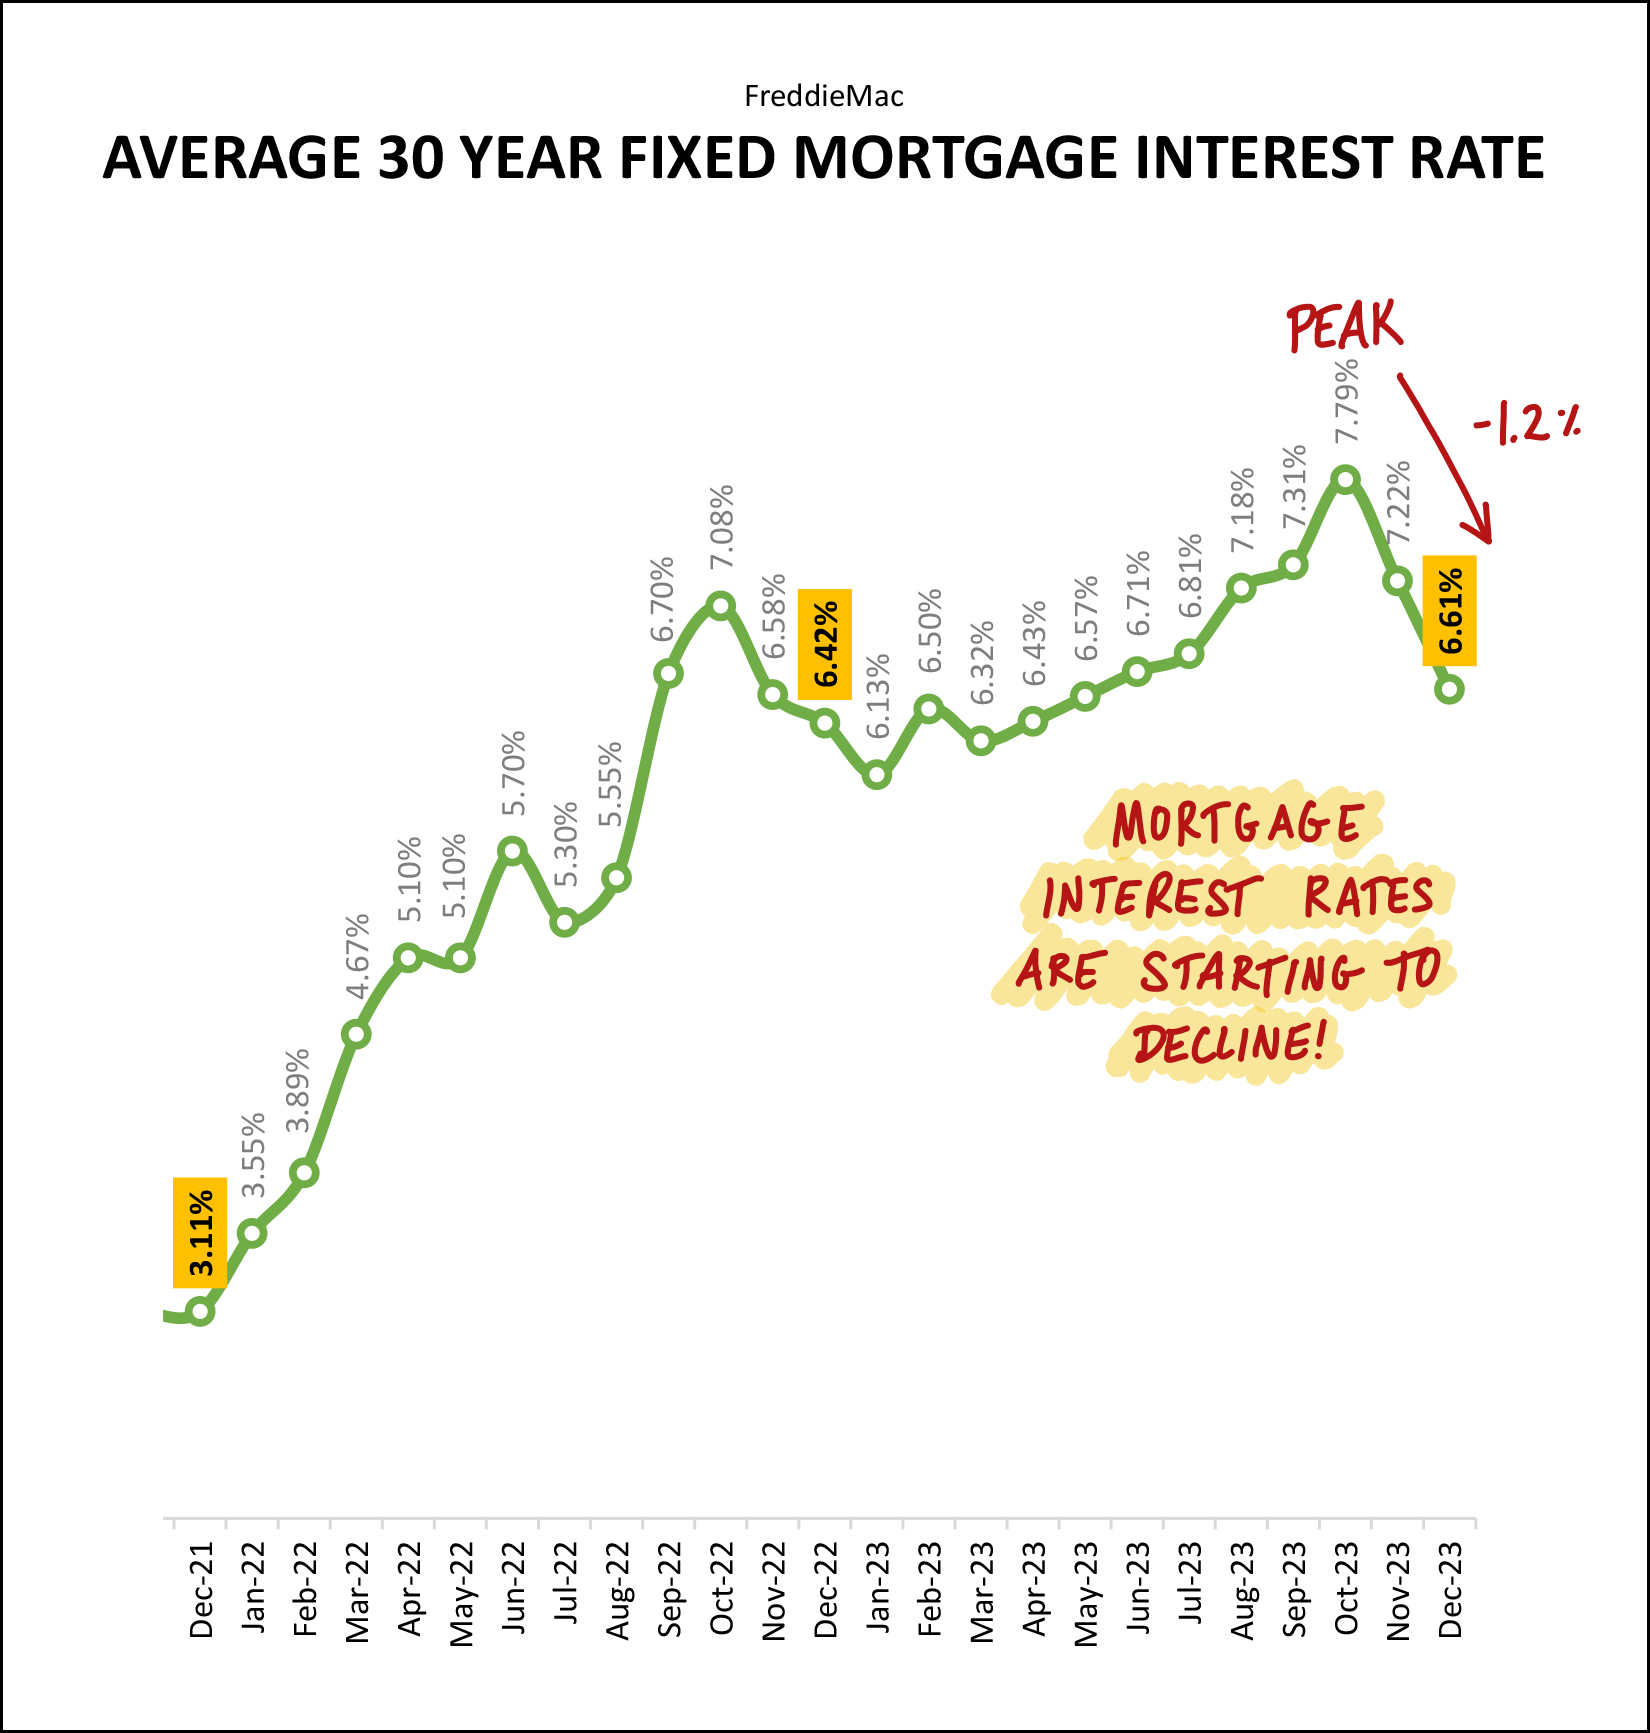 Indeed, if we're looking for at least one of the answers to why contract activity rose and inventory levels decline in November and December -- it's likely that we are looking at it above. Mortgage interest rates rose throughout most of 2023 from a low of 6.13% in January all the way up to a peak of 7.79% in October. But... they have been falling steadily since that time -- and in just two months they have dropped all the way back down to 6.61%. I suppose it's no surprise, then, that we saw contract activity start to tick back up in November and December -- it became (slightly, relatively, progressively) more affordable to do so in November and again in December! That, then, brings us to the end of the charts and graphs. So, let's take a look at what various people ought to be focusing on as they look ahead to the remainder of 2024. If your home is on the market now but not yet under contract... Lower mortgage interest rates seems to be bringing new buyers to the table for many properties. Let's hope that is the case for your home, but let's also examine our current pricing and determine whether an adjustment might be necessary to make your house attractive enough to buyers. If you plan to sell your home in 2024... Preparing your house well will likely be more important than ever this year so let's start developing and implementing those plans sooner rather than later. We'll also need to make sure to price your home appropriately to sell for the best possible price for you -- but also in a timeframe that works best for you. If you plan to buy a home in 2024... If it's been a few months since you talked to your lender, do so again soon. Mortgage interest rates have dropped quite a bit and your projected monthly payments will likely be lower than you had anticipated. Keep in mind that many new listings are likely to go under contract very quickly again in 2024, so be ready to go see new listings quickly and be prepared to make a speedy-ish decision about buying. If you own your home and don't plan to sell it anytime soon... Congrats to you on your (likely) ever increasing home equity. Enjoy the ride, and enjoy the likely low mortgage interest rate on your mortgage. :-) If you're me... Try really, really hard not to run for at least the next few weeks in order to follow the doc's orders and to avoid further injury to my ankle. And for ALL OF YOU reading this market report... If I can be of help to you related to real estate, or otherwise, don't hesitate to reach out. You can contact me most easily at 540-578-0102 (call/text) or by email here. I'll send you another update in about a month... now, who wants to guess how much snow we'll see between now and then? A foot? A few inches? None??? Recent Articles:
| |
| Newer Post | home | Older Post |
Scott Rogers
Funkhouser Real
Estate Group
540-578-0102
scott@funkhousergroup.com
Licensed in the
Commonwealth of Virginia
Home Search
Housing Market Report
Harrisonburg Townhouses
Walk Through This Home
Investment Properties
Harrisonburg Foreclosures
Property Transfers
New Listings

