| Newer Post | home | Older Post |
Despite An Increase In Home Sales In January, Contract Activity Is Down, Inventory Levels Are Up, Days On Market Is Up |
|
 â¤ï¸ Happy Valentine's Day! â¤ï¸ For those of you that just *love* reading my market reports each month... consider today's report my valentine to you. ð That said, the real estate indicators this month aren't all hearts and candy and hugs and kisses... so TBD if you'll still consider this to be a loving Valentine's Day message by the end. But first, as a peace (love?) offering... each month I provide a giveaway, of sorts, for readers of my monthly market report. This month I'm highlighting a delightful cafe / coffee shop just outside Dayton called Harvest Table. They offer great coffee beverages, a delicious array of baked goods, and a solid (all-day) breakfast and lunch menu as well! If you haven't checked out Harvest Table -- you should -- and click here to enter your name for a chance to win a $50 gift certificate use on your next visit! Now, on to the real estate data, starting with how many home sales we saw in the first month of 2024. 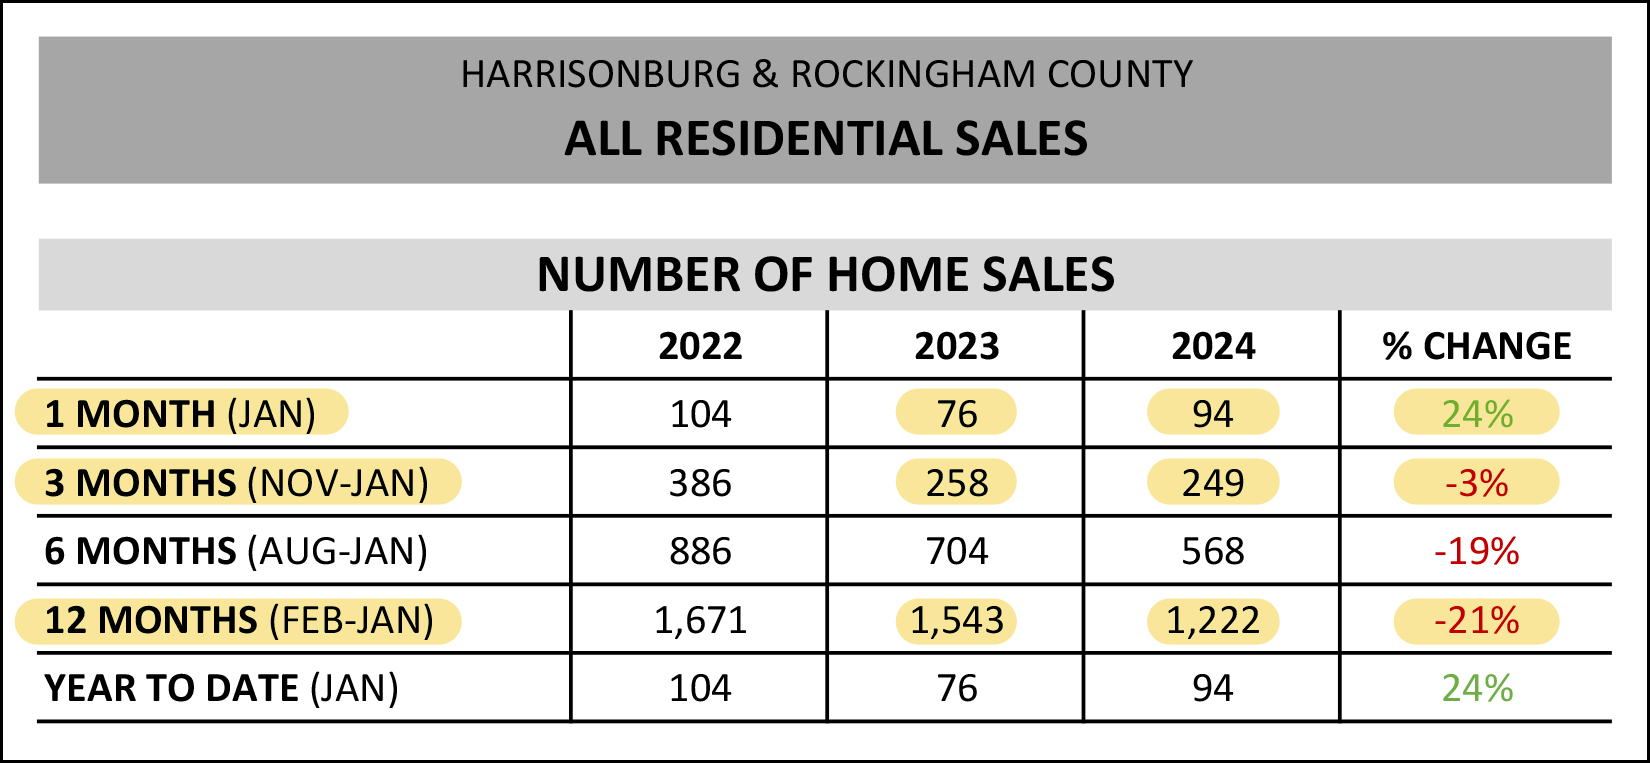 If we start with how many homes are selling right now (see above) we'll be starting with some rather positive news. After over a year of steady declines in the number of homes selling in our area, we did see a bit of a turnaround in January 2024. A few things I am noticing above... [1] After only 76 home sales in January 2023 we saw 94 in January 2024. I wasn't expecting that we would see this 24% increase in the first month of 2024. I don't necessarily think that means we'll see a 24% increase in the number of homes selling throughout 2024 -- as this is just one month of data -- but it was a pleasant surprise to see more buyers able to buy homes this January than last January. [2] The third highlighted line (above) shows that over the past year we have seen a 21% decline in the number of homes that are selling in Harrisonburg and Rockingham County. This certainly stands in contrast to the 24% increase in January 2024... but if we want to broaden our view a touch we see (in the second highlighted line) that home sales have only declined by 3% when looking at the most recent three months (Nov-Jan) compared to the same three months a year prior. So... based on several bits of data... maybe (just maybe) we won't see another 20-ish percent decrease in the number of homes selling this year in our market... maybe we could actually see some stability in this metric, or a slight increase in the number of homes that are selling in 2024? Wait and see... only 11 more months to go. And how about those home prices... 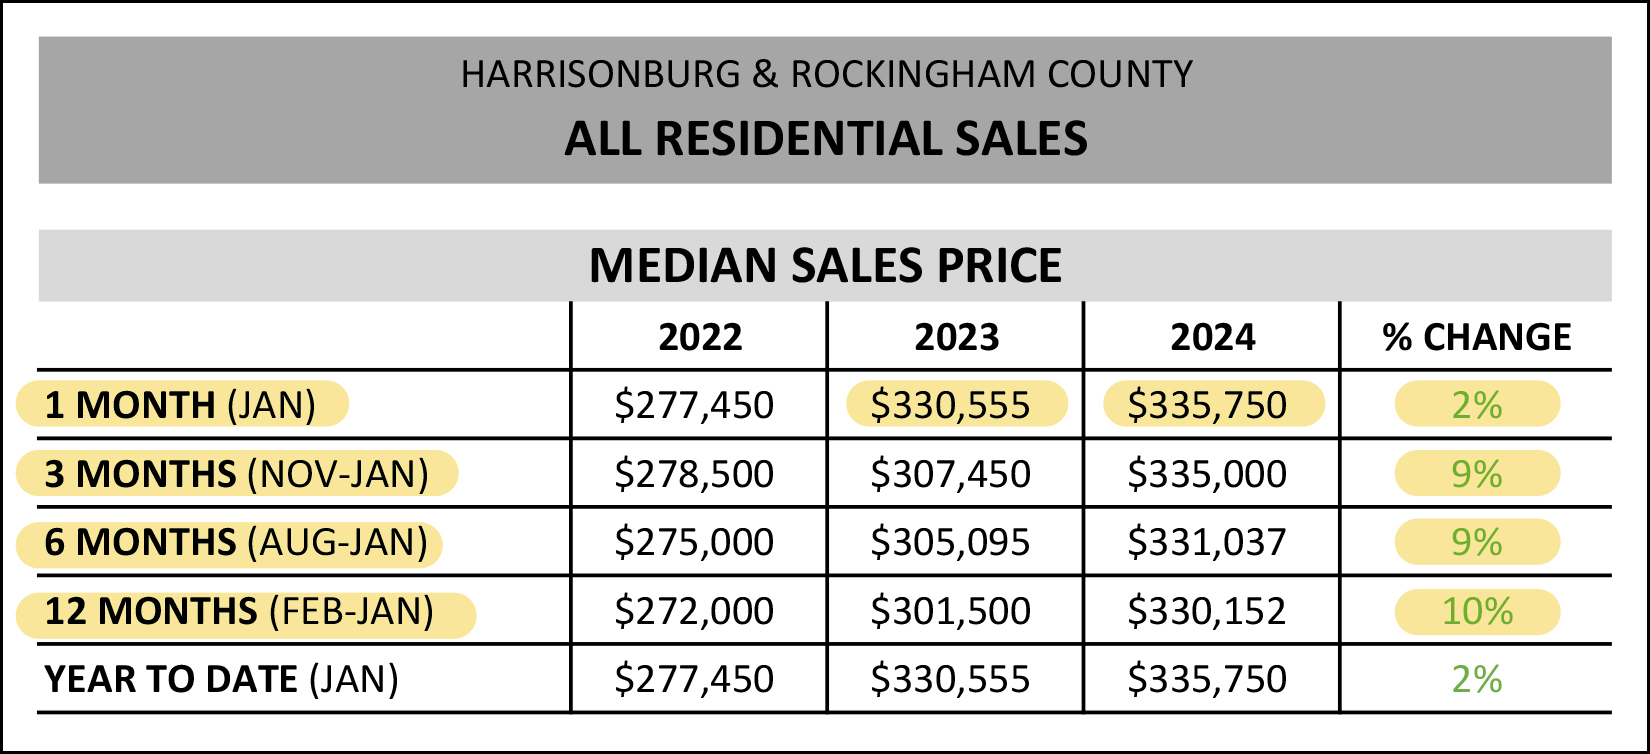 Just as we can't necessarily believe that the 24% increase in home sales in January 2024 will be a lasting trend, we also shouldn't necessarily believe that the 2% increase in the median sales price in January 2024 will be a lasting trend. As shown above, when looking at three, six or twelve months of data, the median sales price in our area has been rising by 9% - 10%. When looking at just one month of data (January 2024 vs. January 2023) we only see a 2% increase in that median sales price, but I don't think we'll see that low of an increase once we get a few more months into the year. And how about how quickly homes are selling... 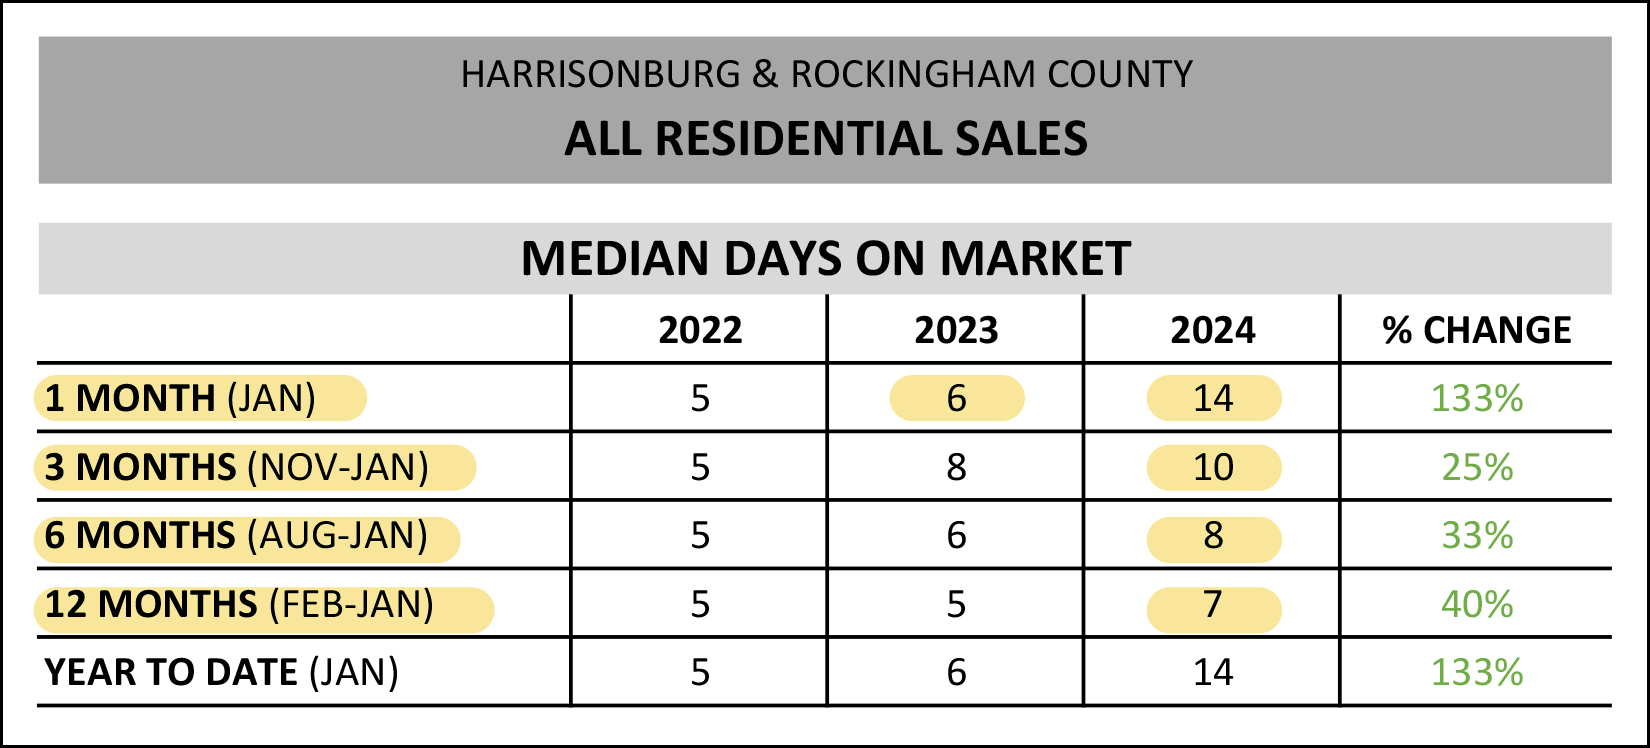 There are enough changes on this table (between 2023 and 2024) to give me confidence in saying that the market will almost certainly move at least a bit more slowly in 2024 than it did in 2023 (and 2022). The median "days on market" was 14 days in January 2024, which means that of the homes that sold in January, half of them took more than two weeks to go under contract. This is quite a bit slower than the median of six days last January. Also, if we zoom out a bit to look at the three month, six month and twelve month metrics, we also see higher median days on market in those timeframes as well. We started to see days on market creep up a bit in 2023 but I think we will see an even more significant increase in this "speed of sale" metric in 2024. Many homes will likely still sell very quickly in 2024, but not all homes. This next graph is a bit hard to read with only one data point for 2024, but see if you can find it... hiding on the left side, and highlighted... 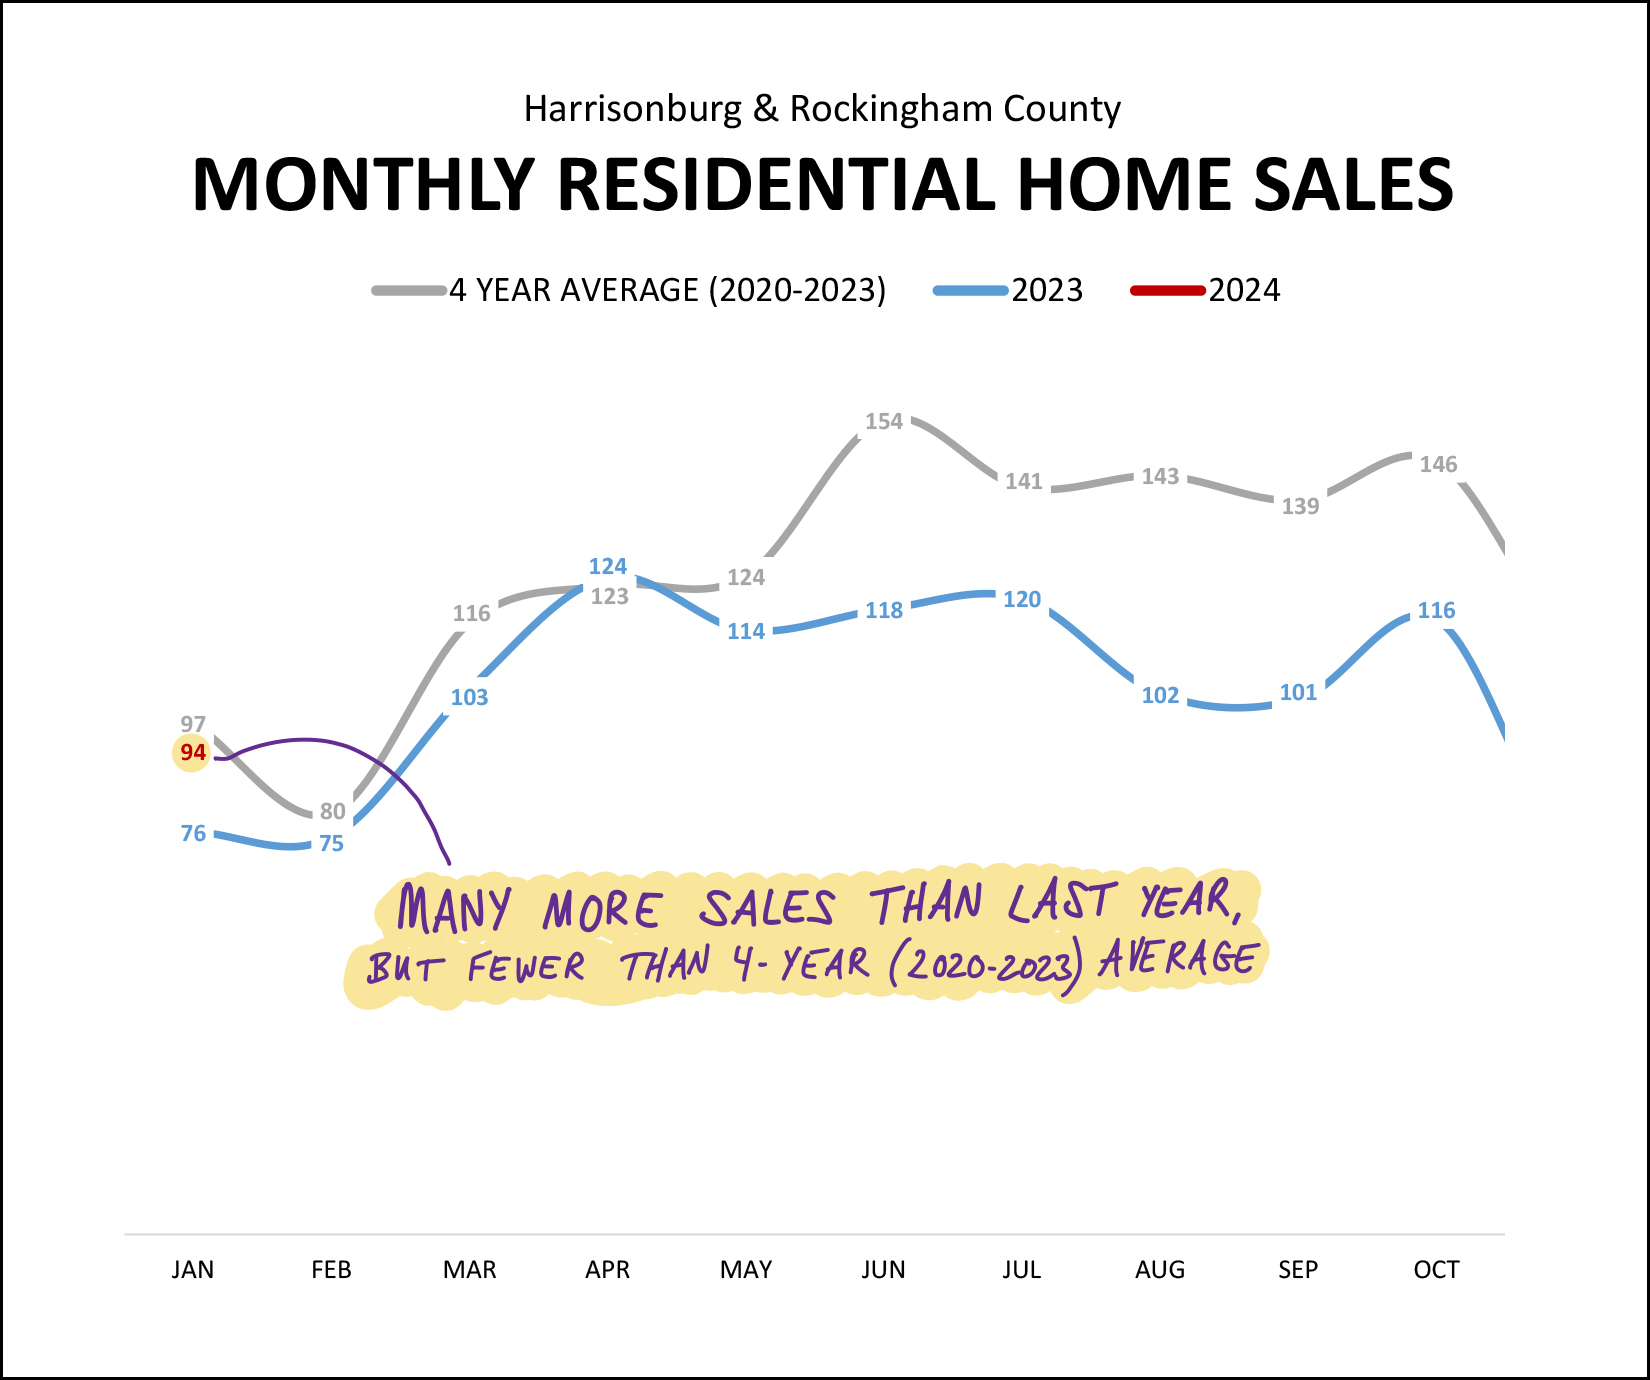 That highlighted "94" is showing the number of homes that sold in January 2024... which was well above the 76 home sales we saw last January (in blue) and only barely above the four year average of 2020 through 2023. Looking and thinking ahead towards the next few months the question that remains is whether home sales in 2024 will remain stronger than in 2023, or whether the monthly sales count will drift back down towards 2023 levels. I'll hit on contract activity and pending sales a bit later to allow us to think more about what the coming months might look like. And now, a look at the overall big picture trends as it relates to how many homes are selling and the prices at which they are selling... 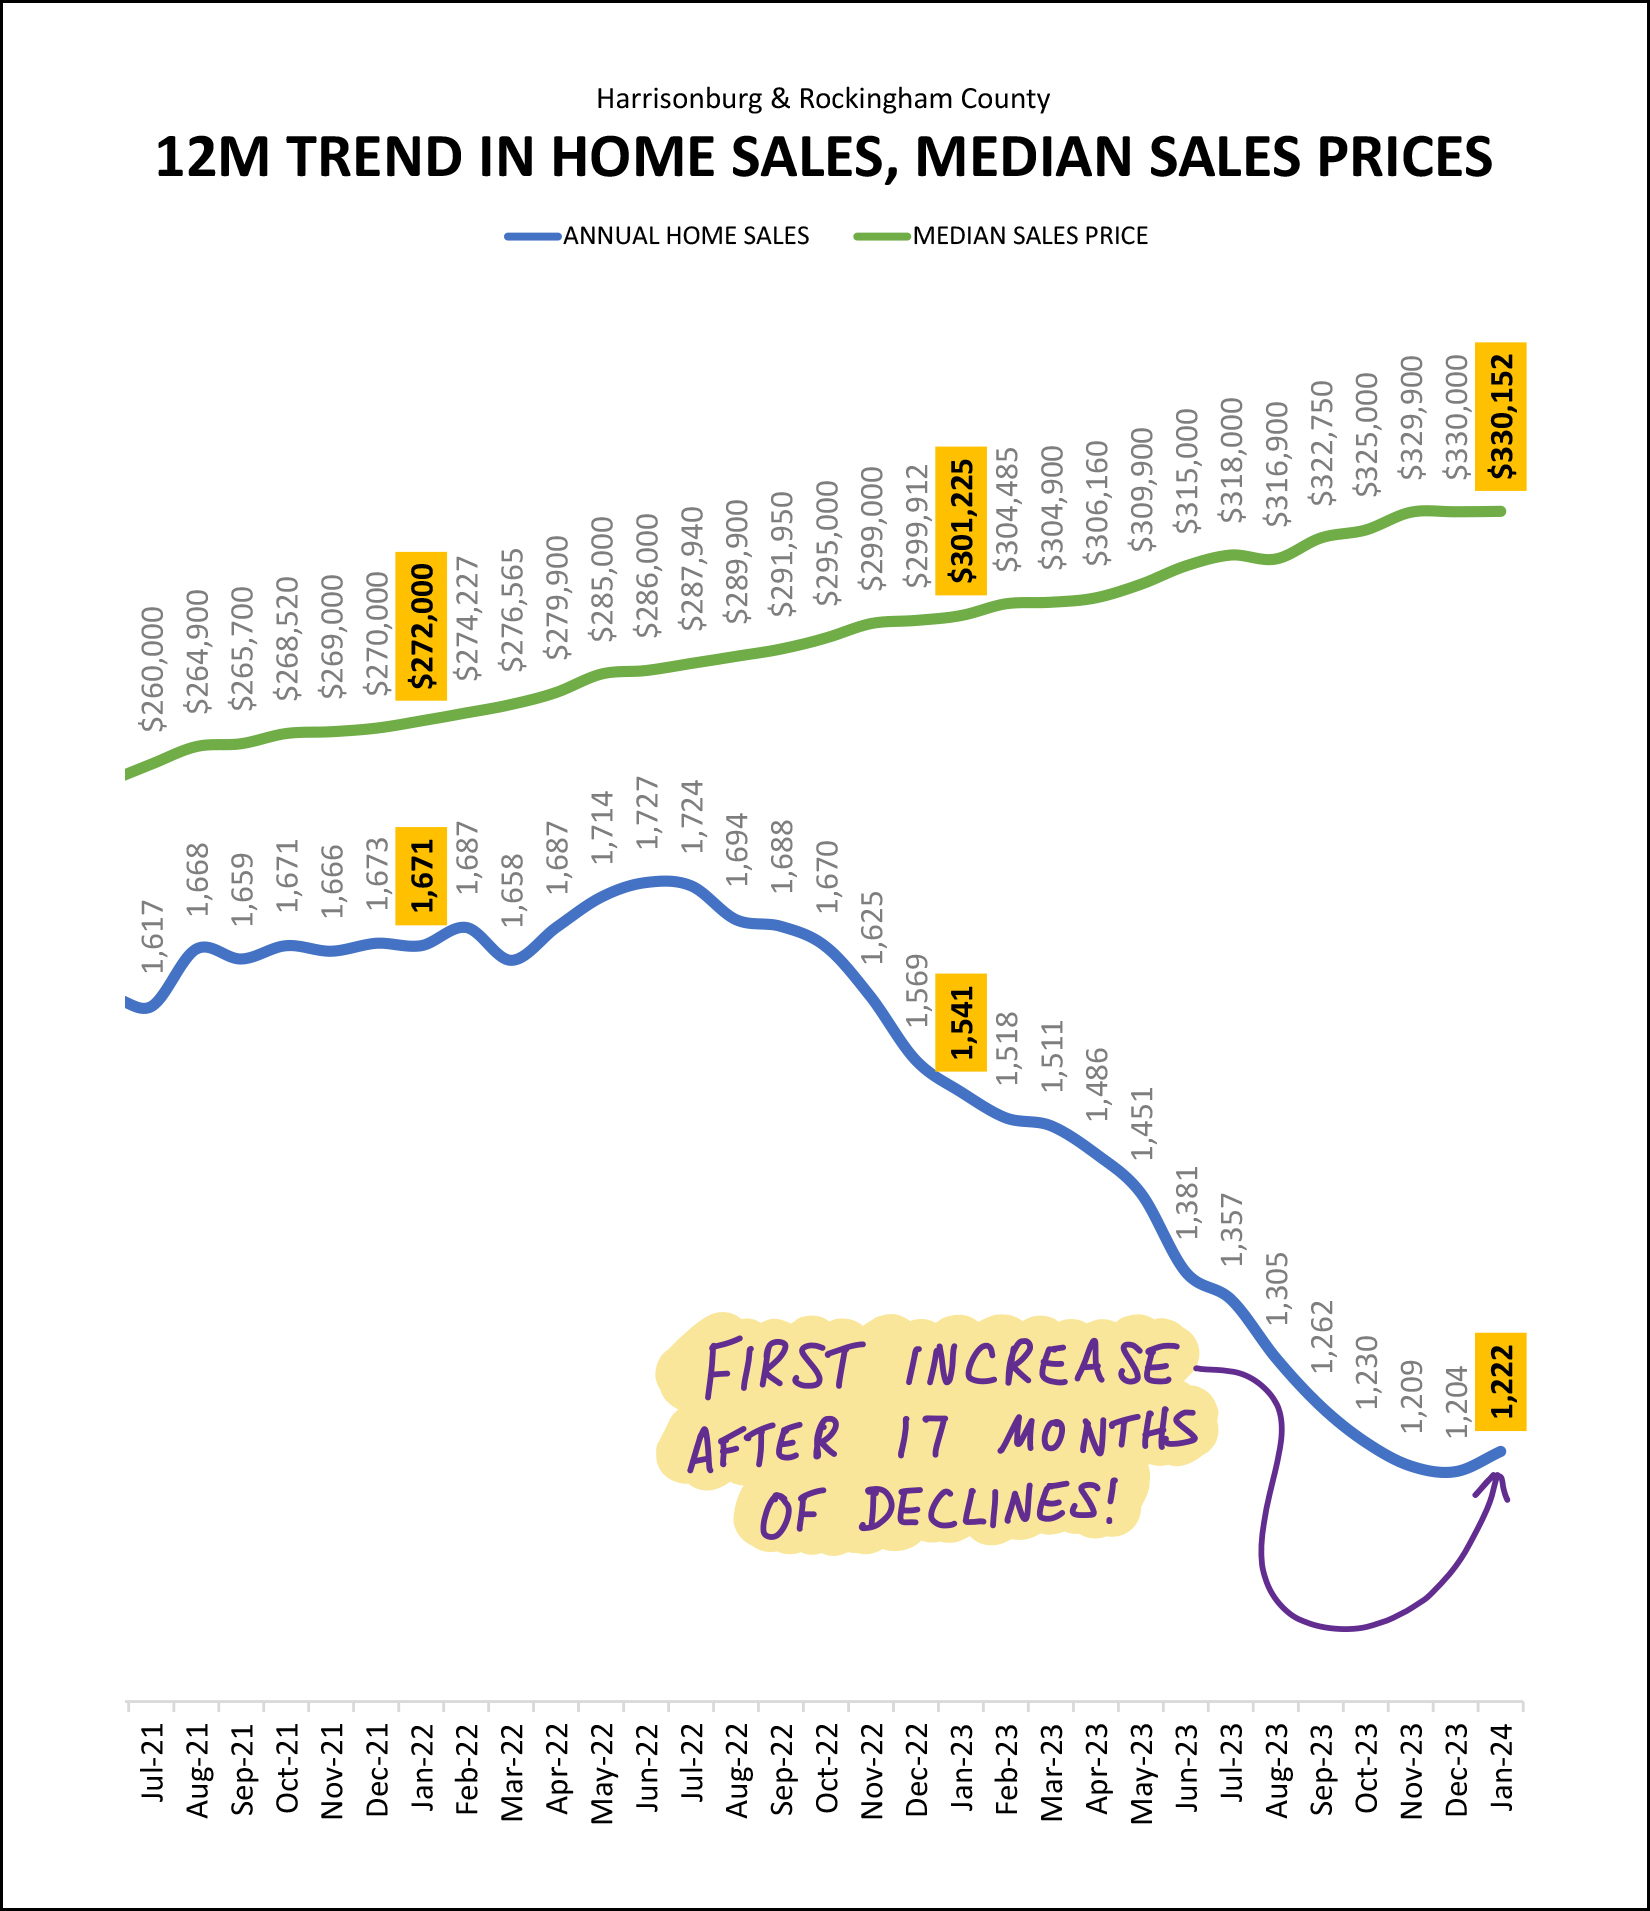 At this point you might be wondering why I warned you in the beginning of the report about some of the metrics not being entirely positive this month. Well, keep reading, but this graph (above) is still in the positive category. The blue line above tracks the number of annual home sales taking place in Harrisonburg and Rockingham County (per the HRAR MLS) when measured on a monthly basis. After 17 months of a declining pace of annual home sales, we saw the first increase in January 2024... from 1,204 home sales to 1,222 home sales. This change in direction in this trend is a result of strong January 2024 home sales compared to January 2023 home sales. If that continues in February 2024, we'll see this line continue to rise again. The top (green) line shows the median sales price over a year's time, measured each month. Clearly, the median sales price has been increasing for many (!!) months (years) now. This metric has flattened out a bit over the past two months, so stay tuned to see if the median sales price continues to increase in 2024 as quickly as it did in 2022 and 2023. Here's another look at that possible change in how quickly prices are rising... 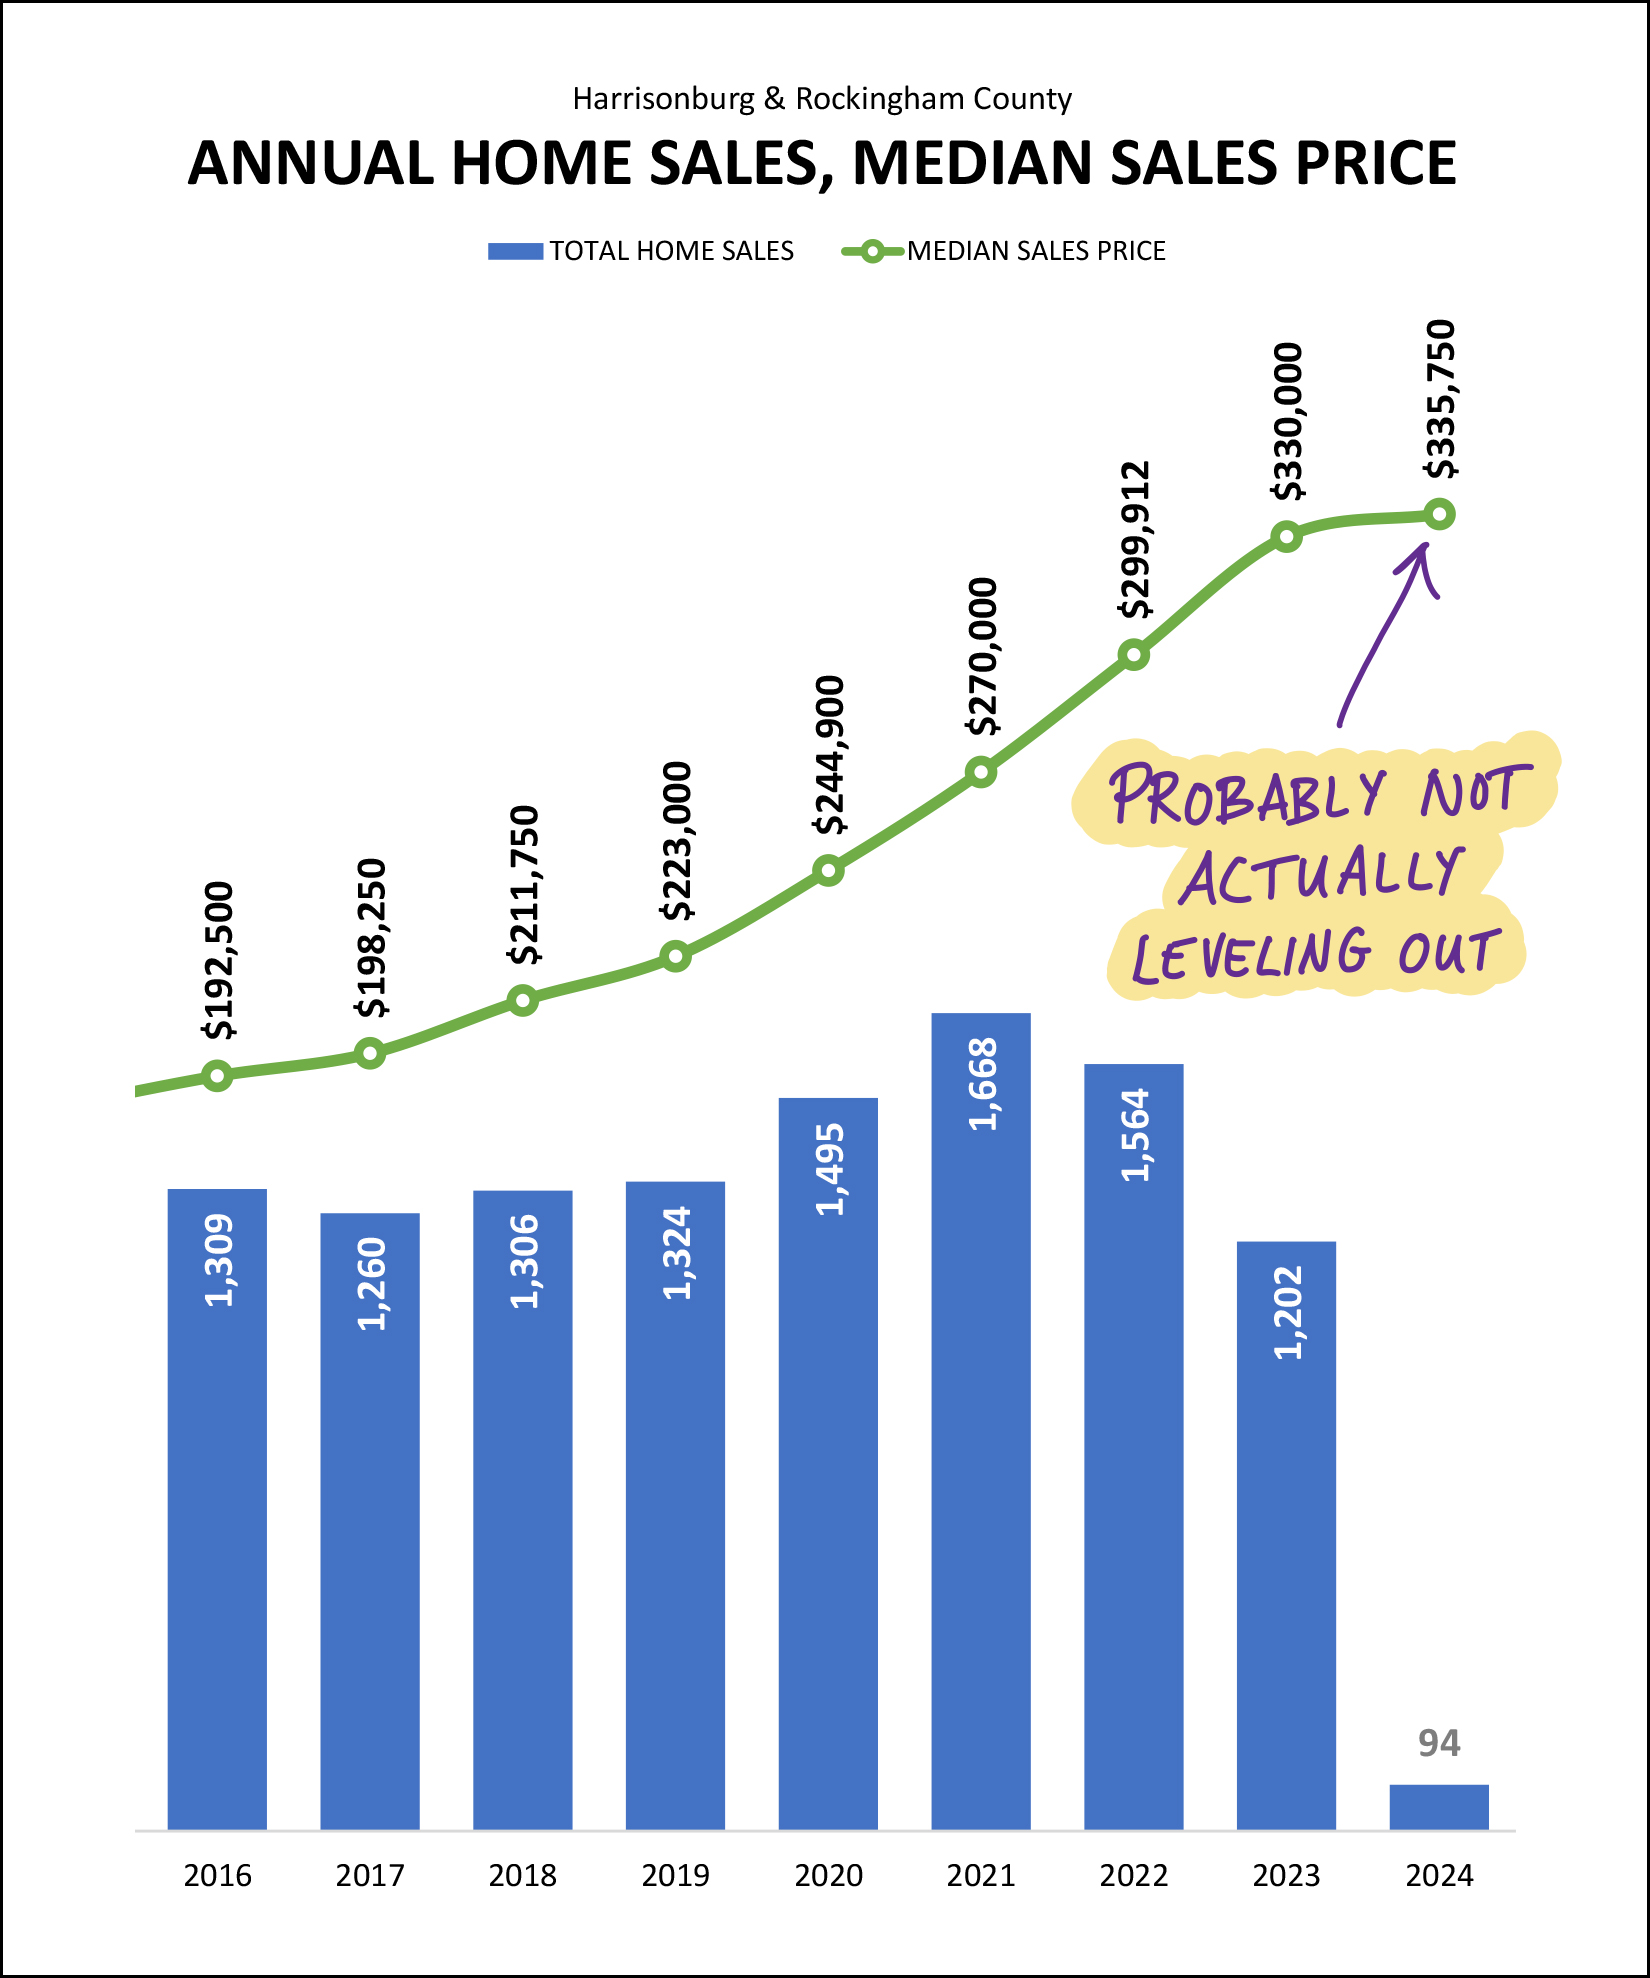 At first glance, it would seem that the rapid increases in the median sales price that we saw in 2020, 2021, 2022 and 2023 might finally be coming to an end in 2024. And, that might be true. We could see a much smaller increase in the median sales price this year. But... keep in mind that the graph above is comparing 12 months of data in 2023 to only one month in 2024. Once we have a few more months of data to consider in 2024 -- a larger data set than the 94 January home sales -- we'll be able to have a better sense of whether we will see similar or smaller increases in the median sales price in 2024. Next up, contract activity, one of the indicators of what we should expect next... 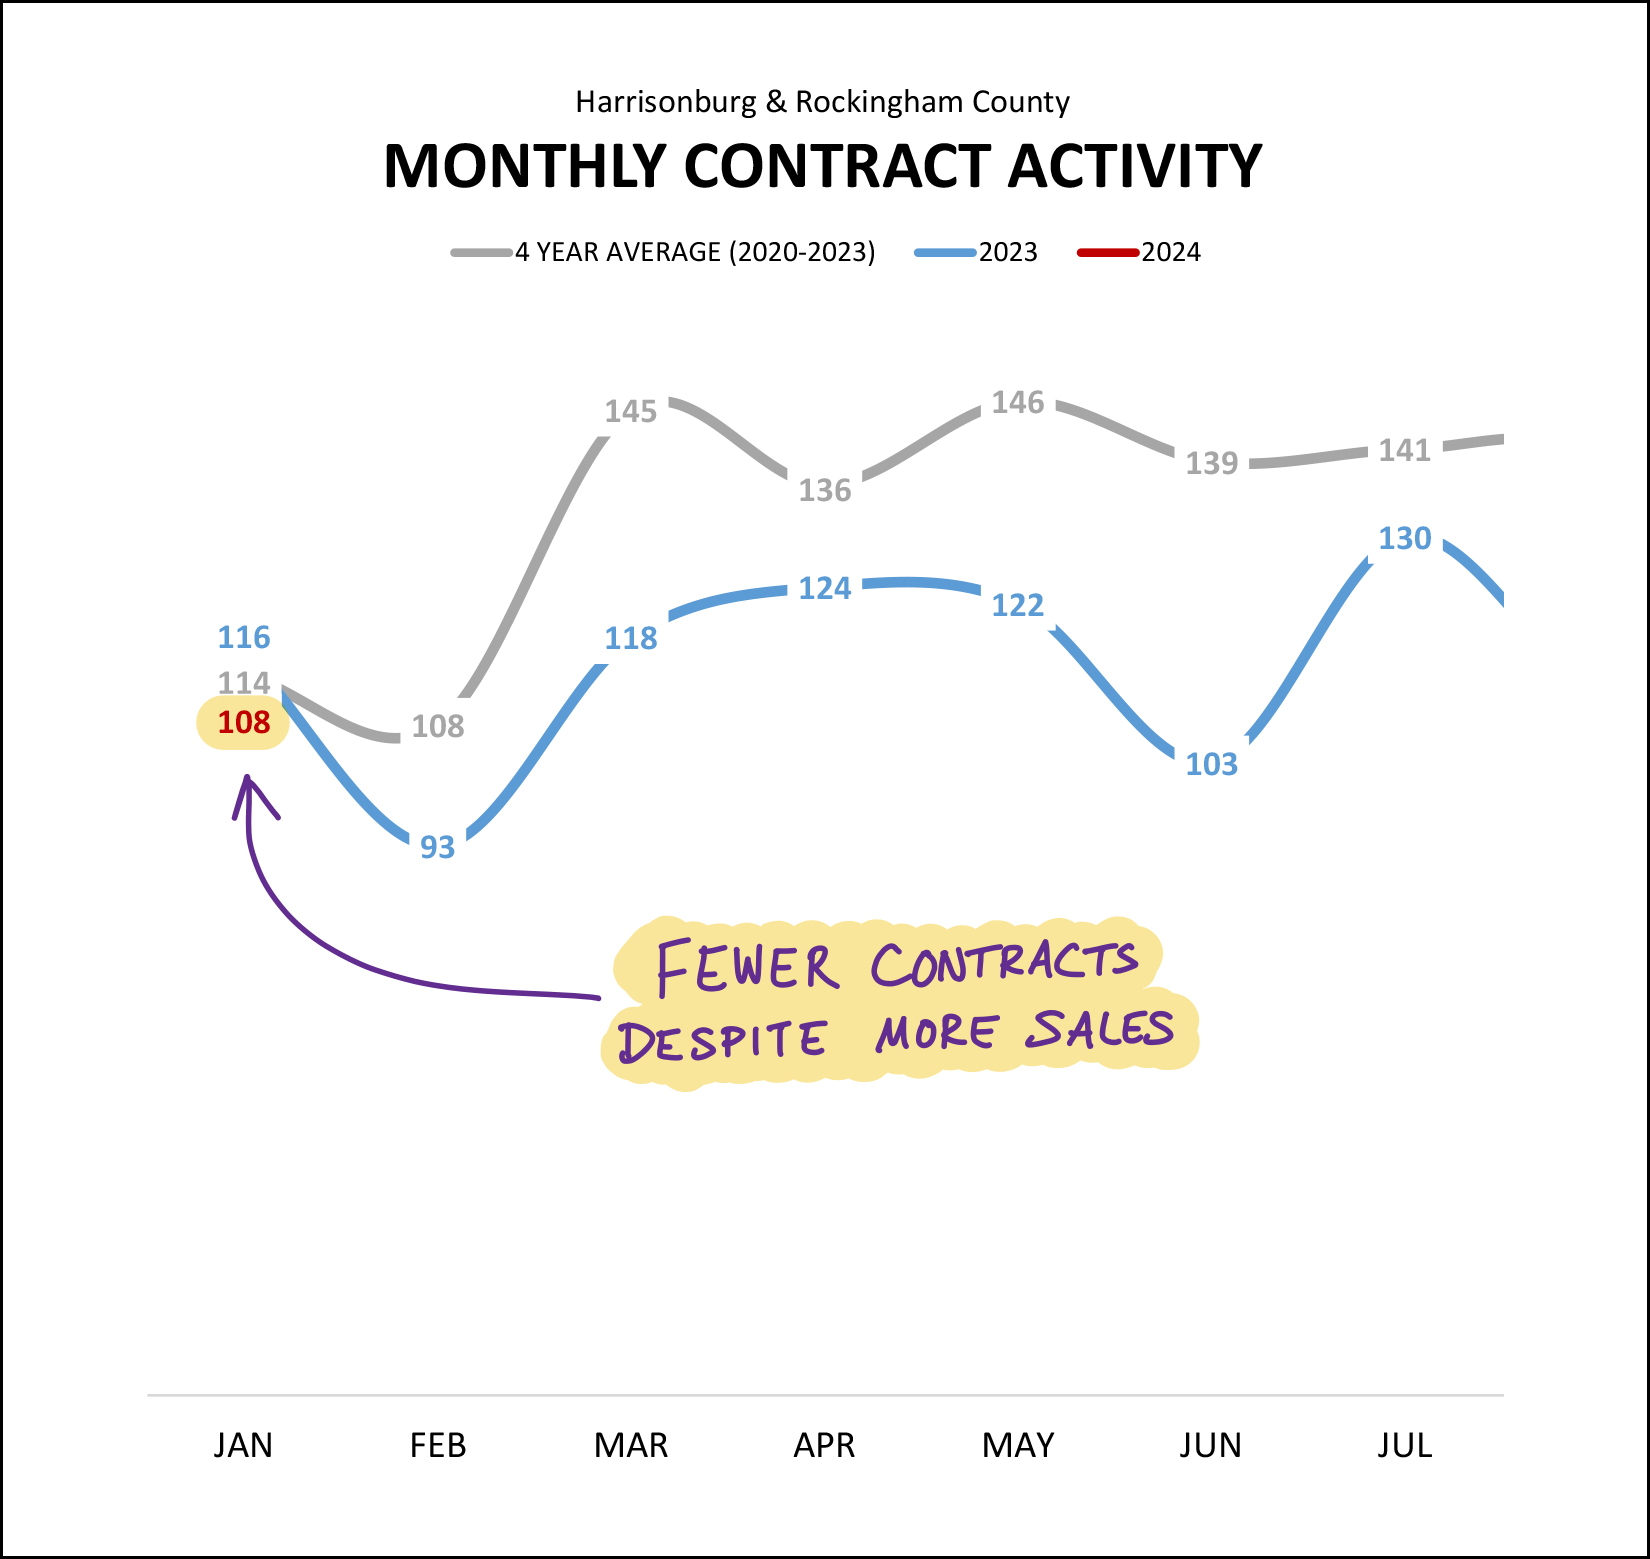 I suppose I shouldn't focus too much on contract activity being slower in January 2024 than in January 2023 because it wasn't that large of a difference... a decline from 116 contracts last January to 108 contracts this January. But, after seeing a big uptick in closed sales in January 2024, I was expecting to see more contracts in January as well -- which would allow us to more confidently expect to see overall home sales activity to increase in 2024. So, with more sales in January, but fewer contracts, what will February (and March) look like in 2024? Well, here's another potential indicator... pending sales... 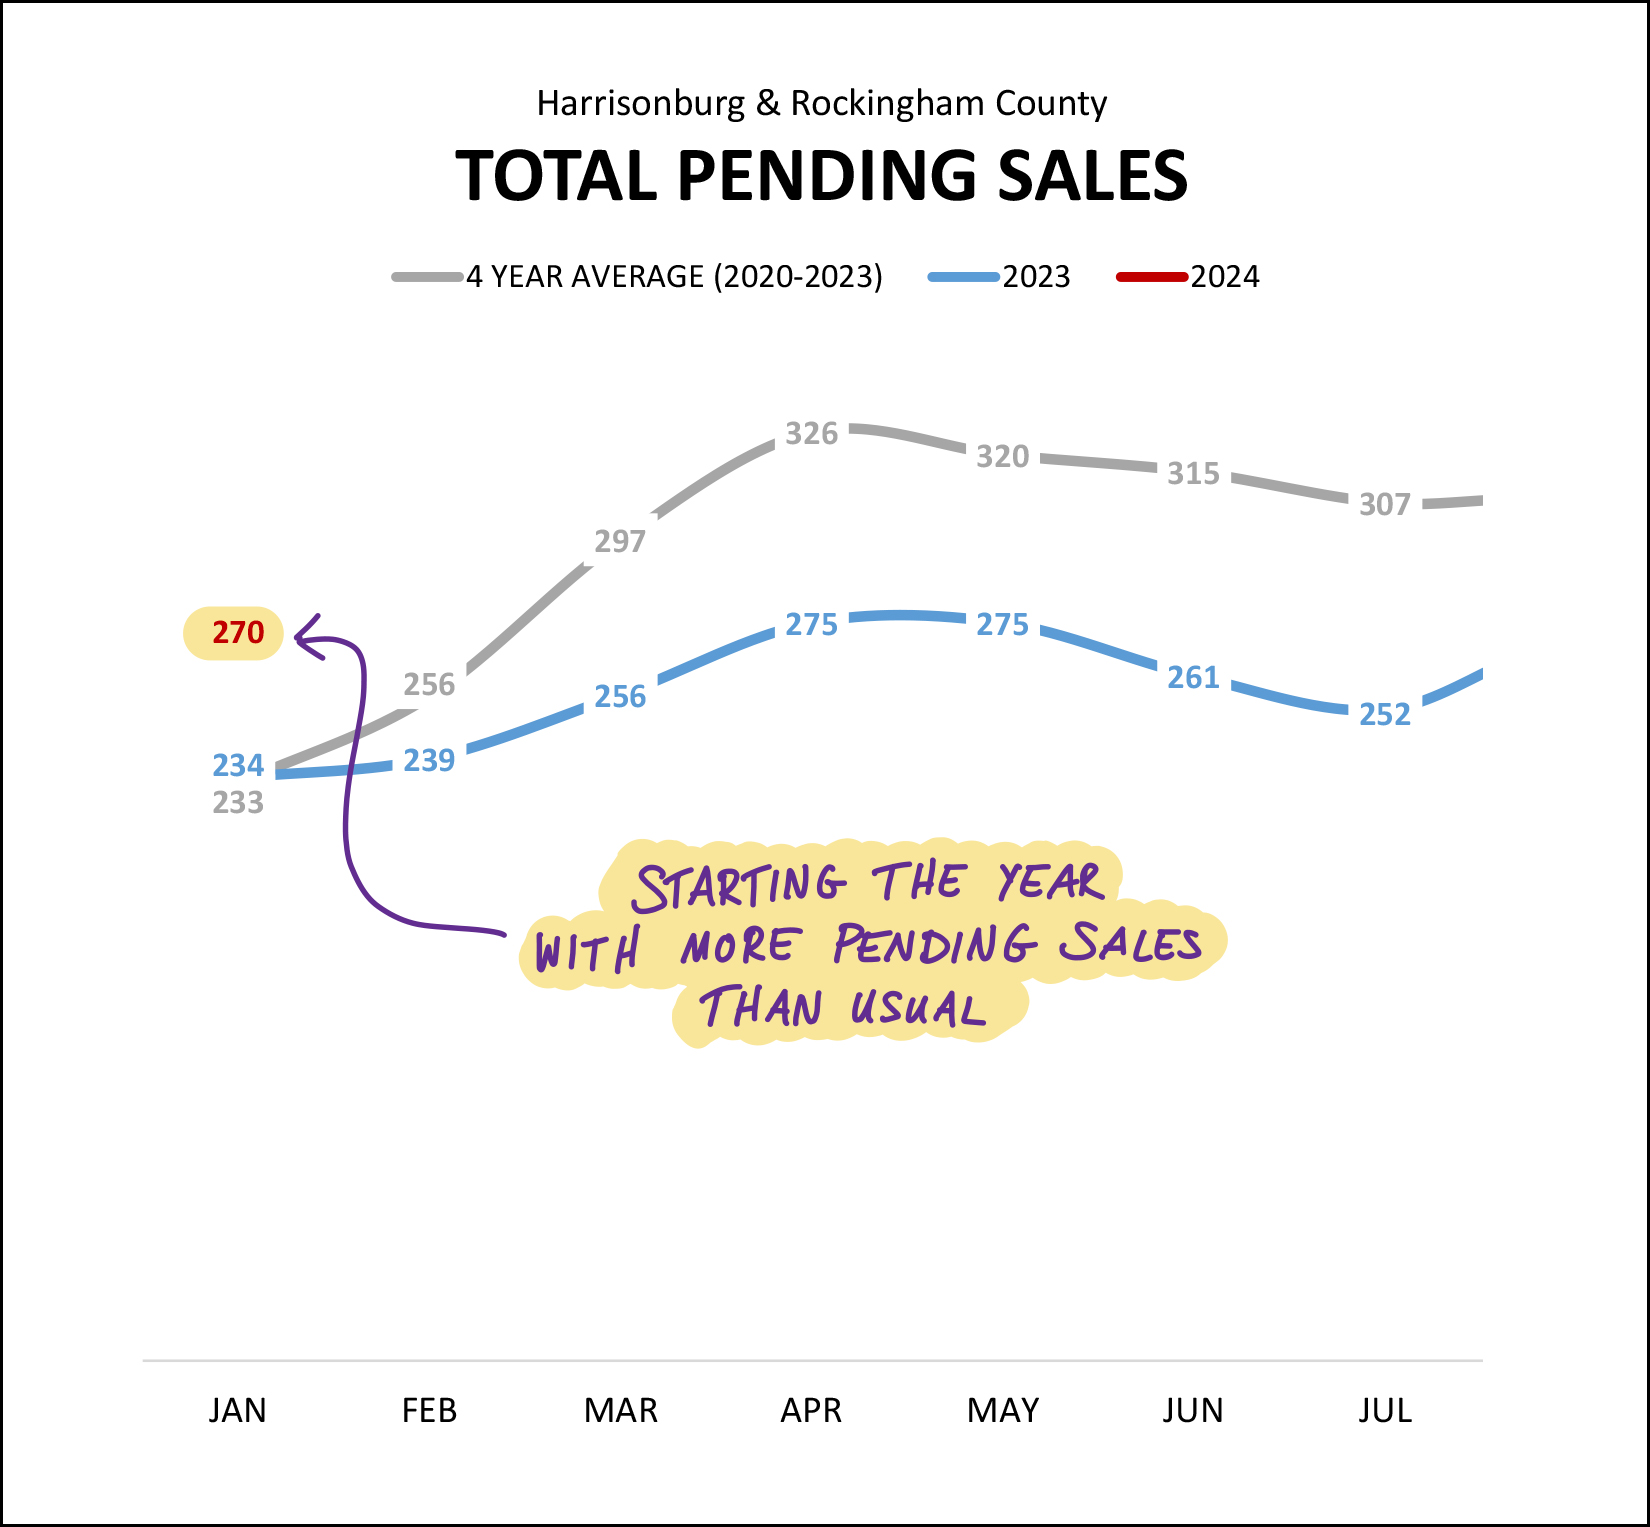 Pending sales is a measure (a count) of how many properties are under contract (pending) at any given moment in time. A year ago there were 234 pending sales at this time, which was in line with the four year (2020-2023) average of having 233 pending sales at this time of year. But then, January 2024. At the end of January (beginning of February) we are now seeing 270 pending sales -- much more than any time recently. So, despite fewer homes going under contract in January, the total number of homes waiting to make it to closing is much higher than we might have otherwise expected. All of this points to the possibility that we will actually see an increase in the number of homes selling in 2024 as compared to 2023. Give it a few more months to see if the data keeps reinforcing that hypothesis, but I am starting to think we'll see an increase in home sales this year as compared to last year. And perhaps more homes are selling because more are available for sale? 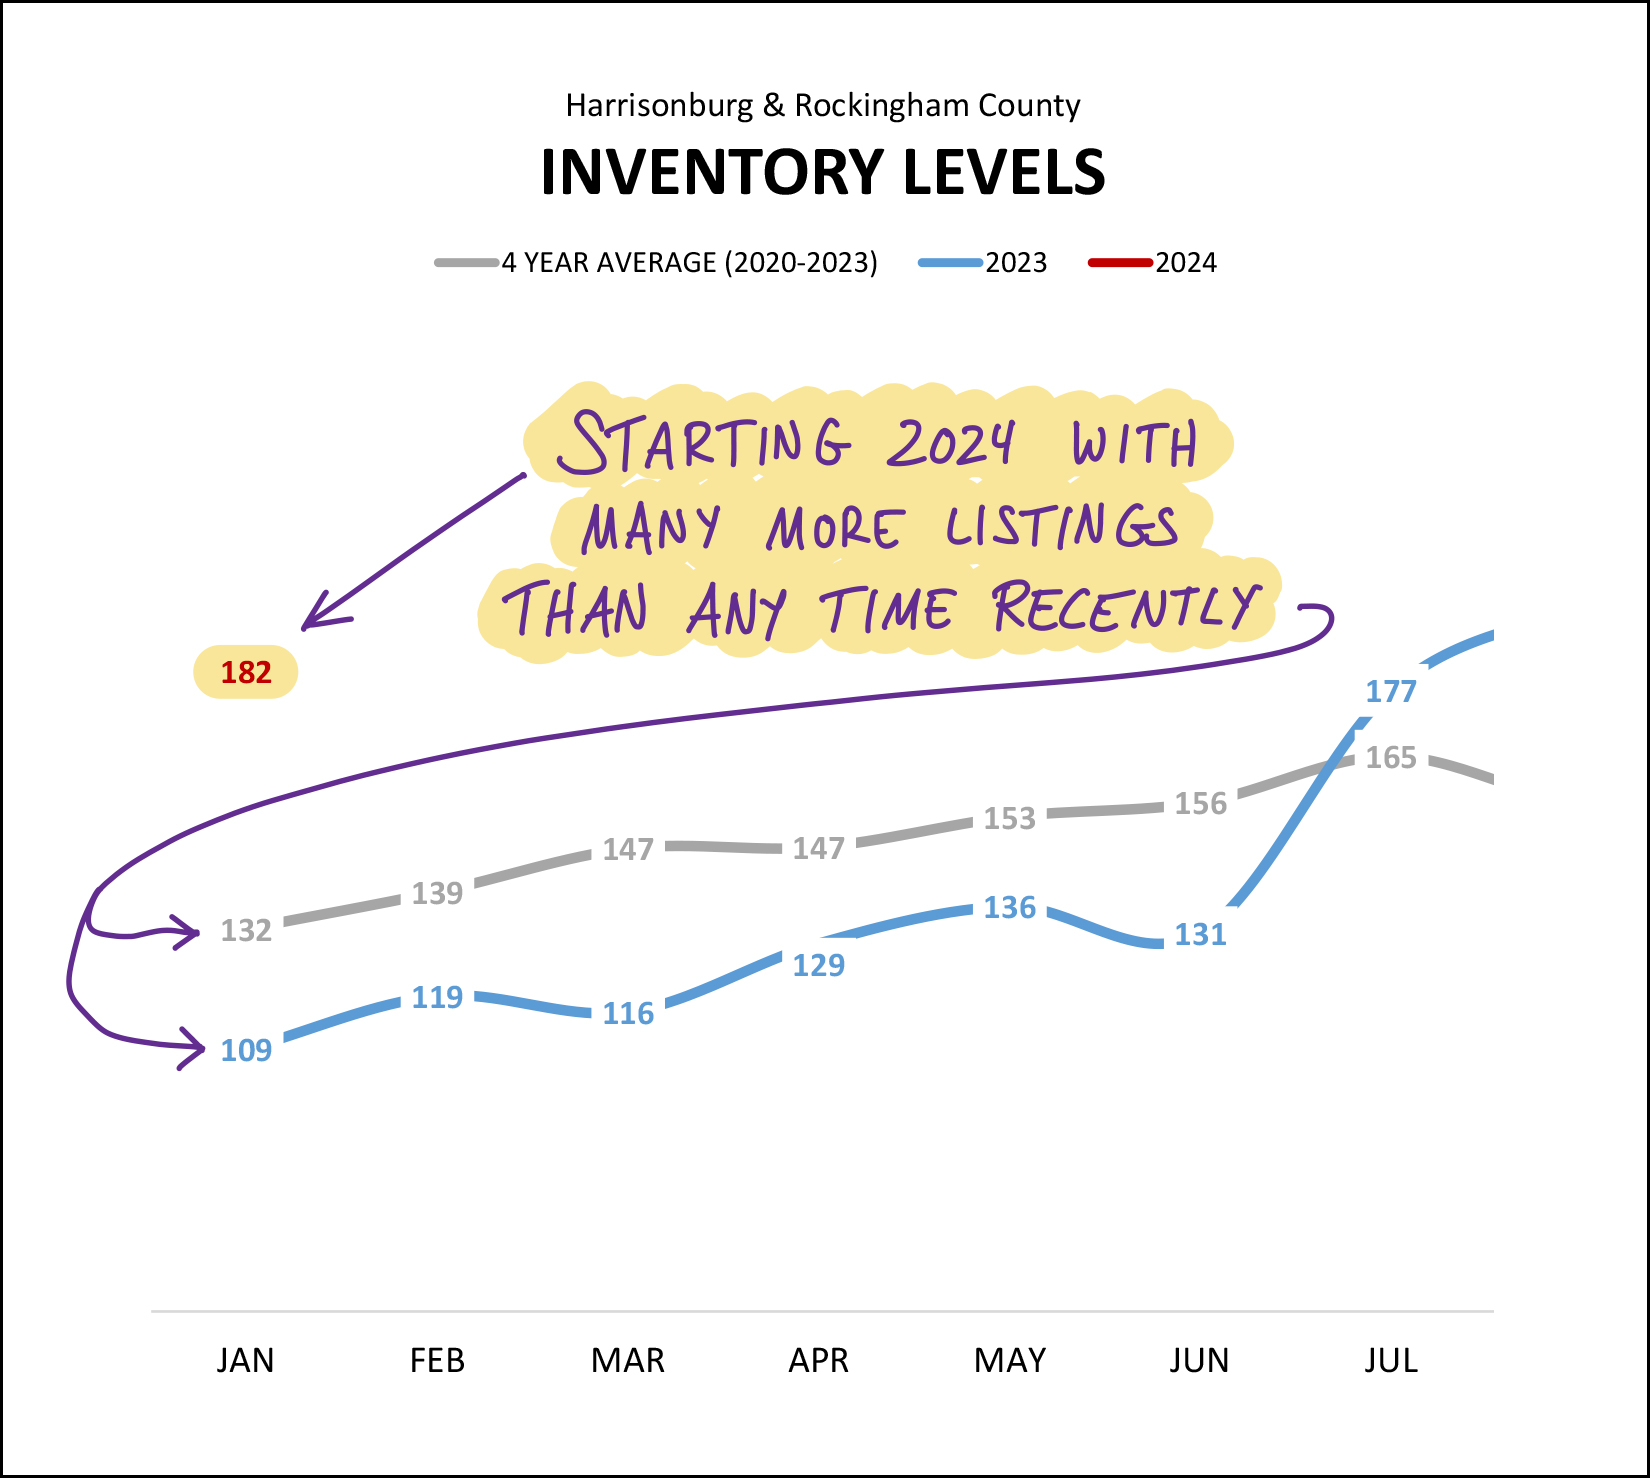 Not only are there many more (15% more) pending sales right now as compared to a year ago, there are also many more (67% more) homes for sale right now as compared to a year ago. That's actually a pretty significant (67%) increase in inventory levels in a year's time. One year ago a buyer would have been able to choose from 109 homes to give to their special someone on Valentine's Day. This year, they can choose from 182 homes for sale. If you've been hoping your loved one will give you a new home for Valentine's Day... you might be in luck, there are sooo many more options this year. If you don't get that new home along with some roses and a box of chocolates, don't let them blame it on the low housing inventory levels... Now, back to that median "days on market" metric... 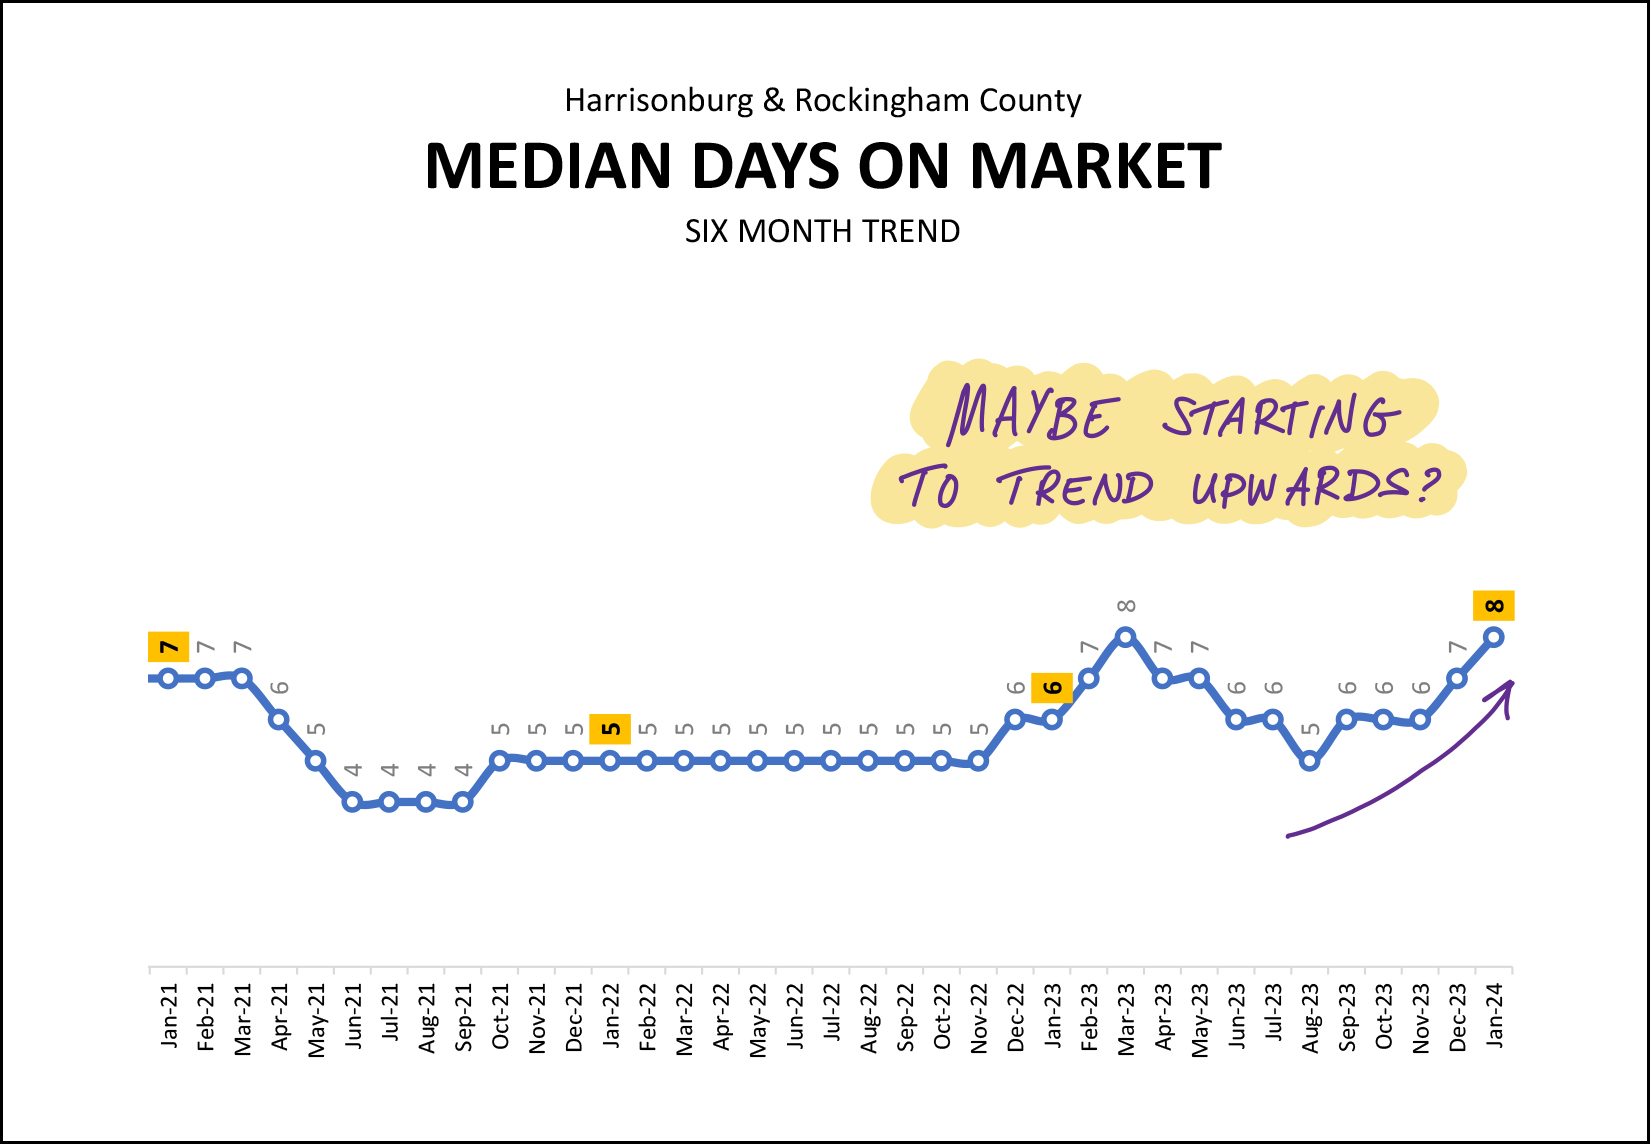 Way back in mid-2021 the median days on market dropped all the way down to four days... and then stayed at five days for more than a year after that. We started to see the median days on market bounce around a bit more in 2023 as we went from a market where absolutely every home seemed to sell very (very) quickly to a market where many homes still sold very quickly, but not all of them did. As we look at the increase from a median of five days on the market back in August to a median of eight days on the market today, we may just be seeing a seasonal increase that we will start to see every year... or we may be seeing the beginning of a slight slowing in the market. But... keep in mind... if the median days on market increases from five to eight days, that is not a drastically different market. It's an increase, but it's not an increase to 10 or 20 or 30 days on the market. Thus, it will be important to continue to monitor this metric over the coming months to see if 2024 is and will be a more slowly moving market than last year. Finally, how about those mortgage interest rates... 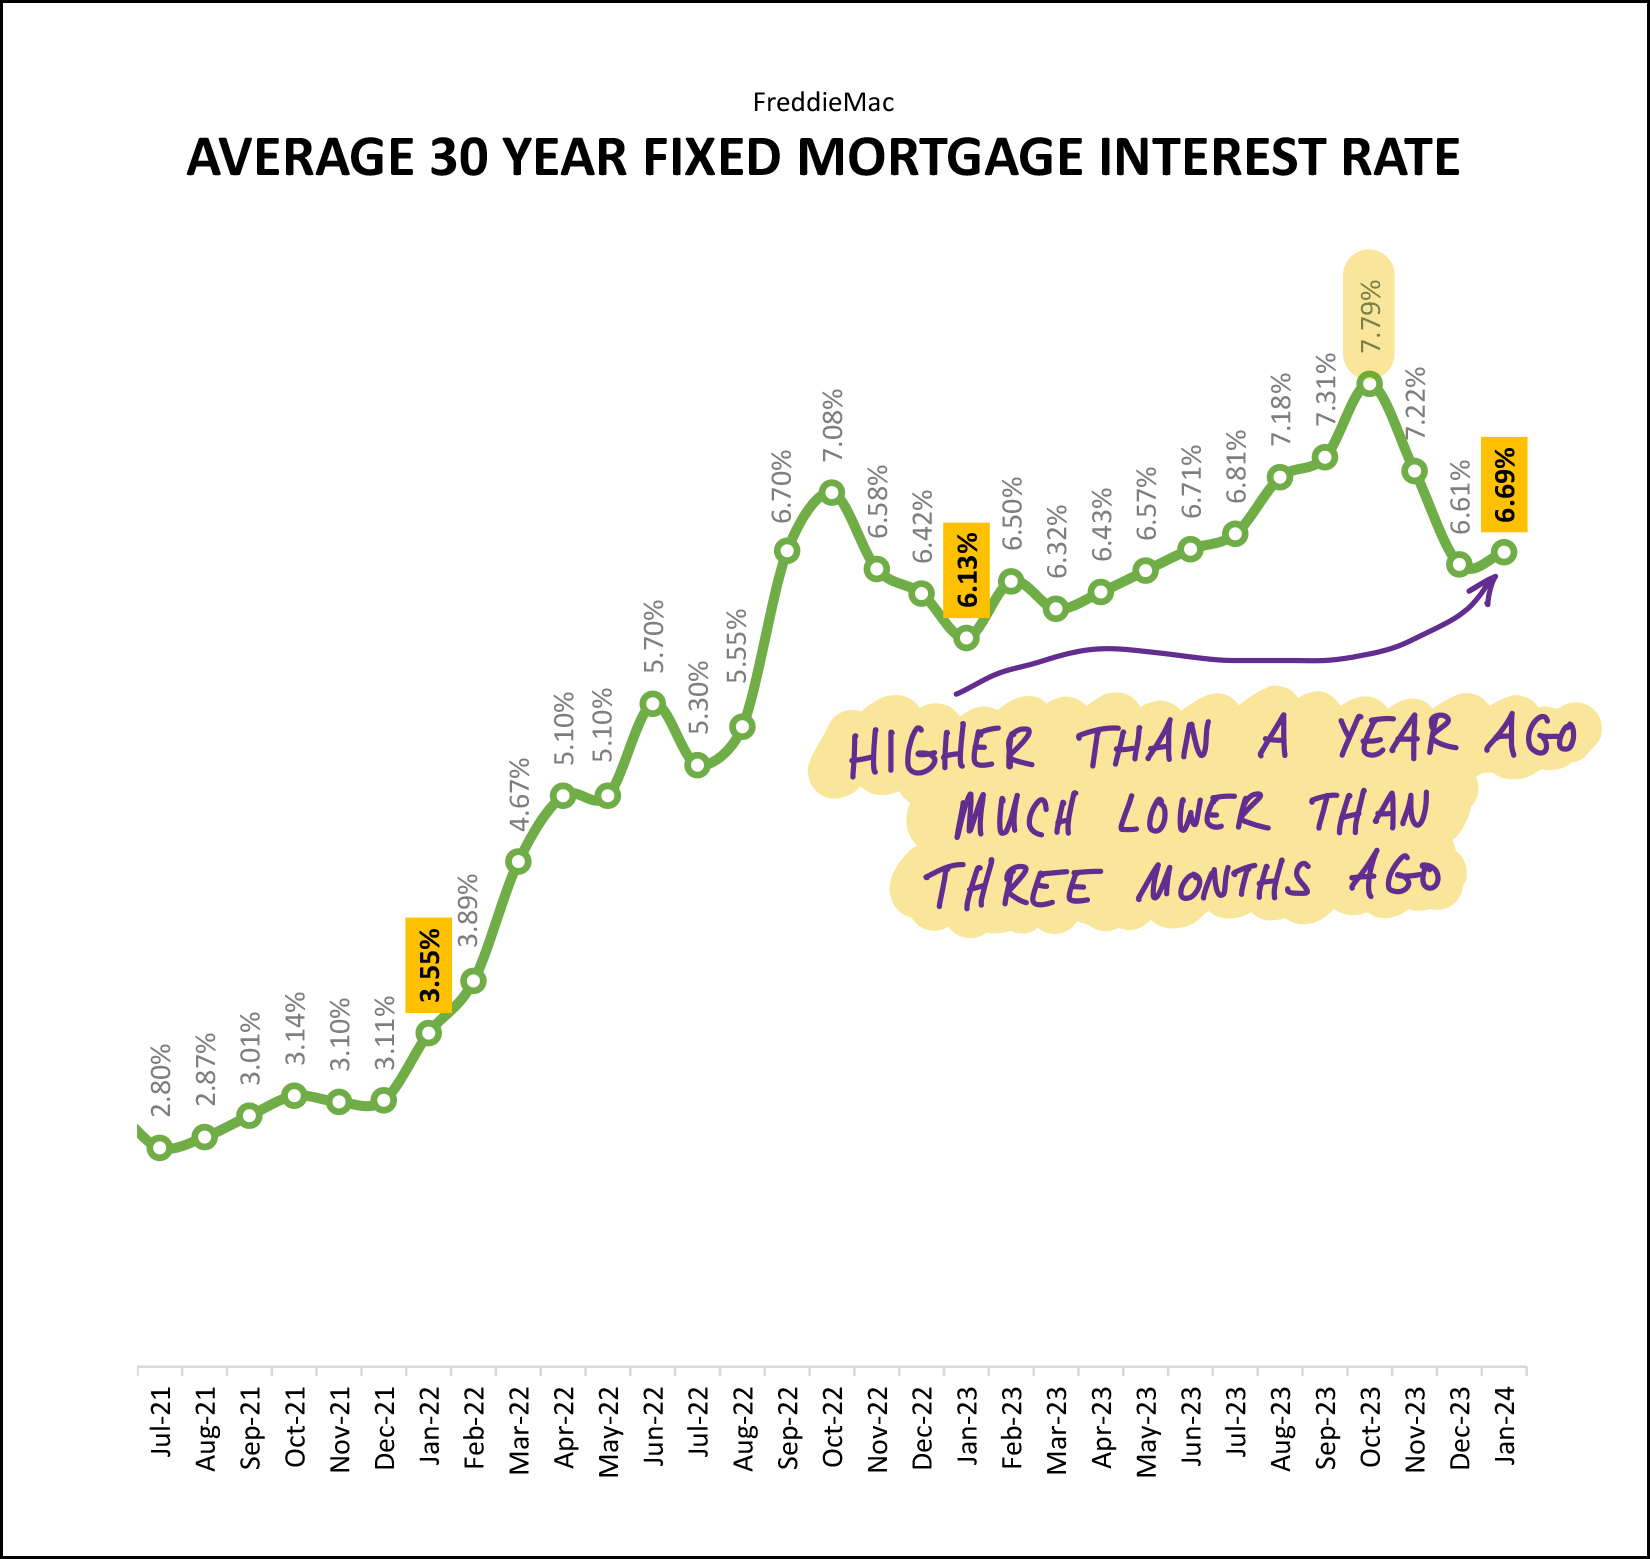 One of the main causes for the decline in the number of home sales in 2023 was rising mortgage interest rates. In 2022 mortgage interest rates rose from 3.11% to 6.42%. Then as 2023 went on, they rose even further, up to a peak of 7.79%. Can you blame buyers for not wanting to buy with a mortgage interest rate above 7%... or for sellers not wanting to sell and then have to buy with an interest rate above 7%? Over the past few months we have started to see mortgage interest rates decline, back to around 6.7% by the end of January. If we continue to see declines in mortgage interest rates in 2024 that will likely encourage further buying activity, though I don't expect that they will get all the way down 6% by the end of the year. And there we have it, very much a mixed bag of market metrics this month. More home sales, fewer contracts but more pending sales, higher inventory levels, higher days on market. All of that likely adds up to 2024 being yet another interesting and not entirely predictable year in our local housing market. If you plan to buy this year - talk to a lender soon and then frequently over time to understand how changing mortgage interest rates affect your budget and monthly payment. If you plan to sell this year - prepare your home well, price it in line with recent similar home sales, and know that your home might be on the market for more than a few days. If you own a home and do not plan to sell it - this will likely be another good year for you with your home increasing in value and another year of paying down a mortgage that likely has a very low interest rate. And to each of you -- if I can be of any help to you with real estate or otherwise, don't hesitate to reach out. You can contact me most easily at 540-578-0102 (call/text) or by email here. I hope you have a wonderful Valentine's Day! XOXO -Scott Recent Articles:
| |
| Newer Post | home | Older Post |
Scott Rogers
Funkhouser Real
Estate Group
540-578-0102
scott@funkhousergroup.com
Licensed in the
Commonwealth of Virginia
Home Search
Housing Market Report
Harrisonburg Townhouses
Walk Through This Home
Investment Properties
Harrisonburg Foreclosures
Property Transfers
New Listings

