| Newer Post | home | Older Post |
May 2024 Home Sales Outpace Projections, With Median Prices Increasing More Slowly |
|
 Happy Monday, friends, and Happy Summer! Summer is well underway over here at the Rogers household, with Luke having finished his first year of college and Emily wrapping up 10th grade. The start of our summer has included getting away for a few days to the lake for some water skiing and tubing, celebrating my niece's graduation (congrats Sofia!) and looking forward to Red Wing Roots Music Festival in less than two weeks! I hope your summer is off to a great start and that you'll find some time to relax or get away for a few days at some point this summer.  Before we dive into the lake, or rather, the real estate data... each month I offer a giveaway for readers of my market report. This month I'm giving away a $50 gift card to Bruster's. Yes, I realize that is a lot of ice cream... but they have SO many delicious flavors! Click here to enter to win the gift card. Now, on to the latest happenings in our local housing market... 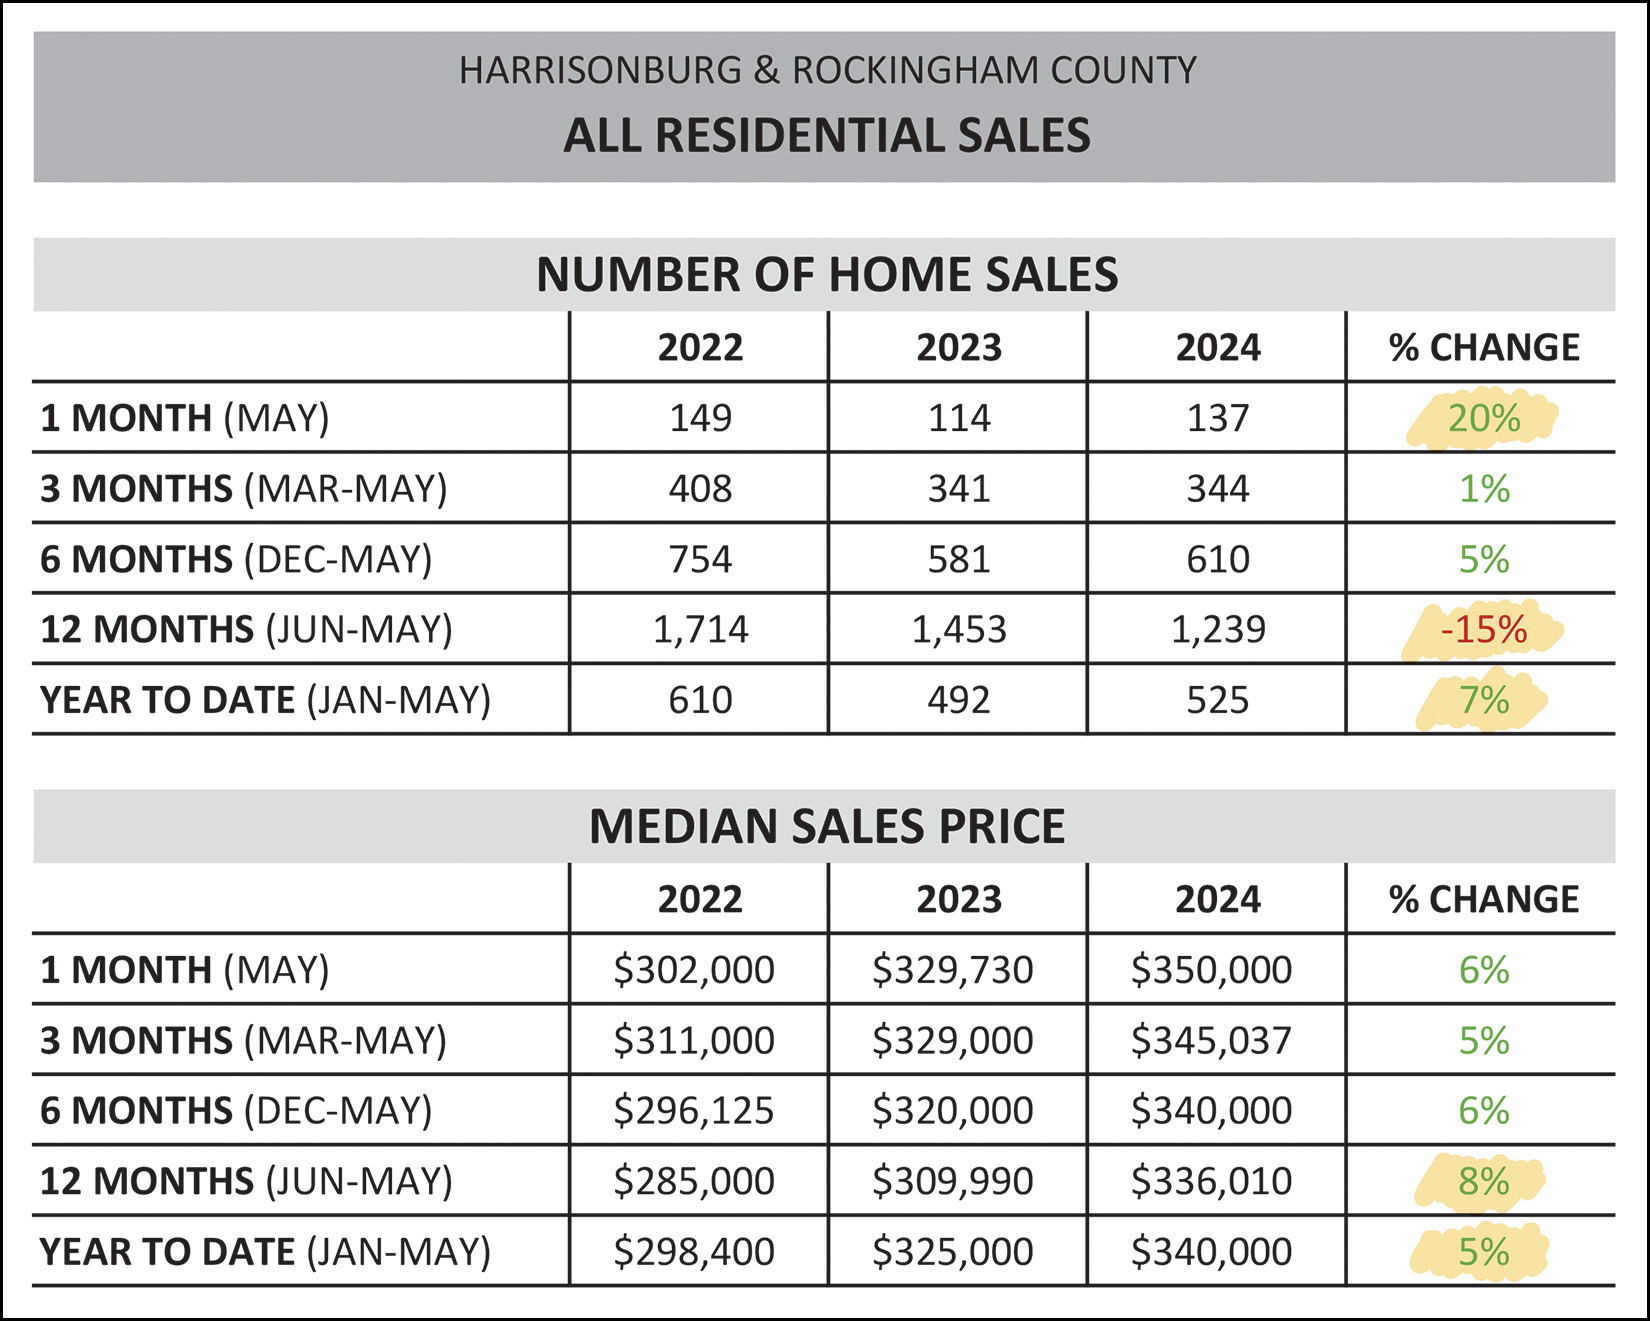 Above you'll find the basic numbers related to how many homes are selling in Harrisonburg and Rockingham County and the prices at which those homes are selling. Here are a few things that stand out to me... [1] Home sales this May (last month) were much higher than expected... with 20% more sales than last May. [2] Despite seeing a 15% decline in the number of home sales in the past 12 months compared to the 12 months before that, we are now seeing a 7% increase in year to date home sales, thanks in part to the strong month of sales in May. [3] You might recall that for the past few years we have been seeing a (surprising) 10% increase in the median sales price each year. The median sales price over the past 12 months ($336,010) is now 8% higher than in the 12 months before that -- and the year to date median sales price is only 5% higher than in 2023 year to date. Thus, it seems that the median sales price may be increasing a bit more slowly this year than in recent years. Looking for a moment just at detached single family homes... 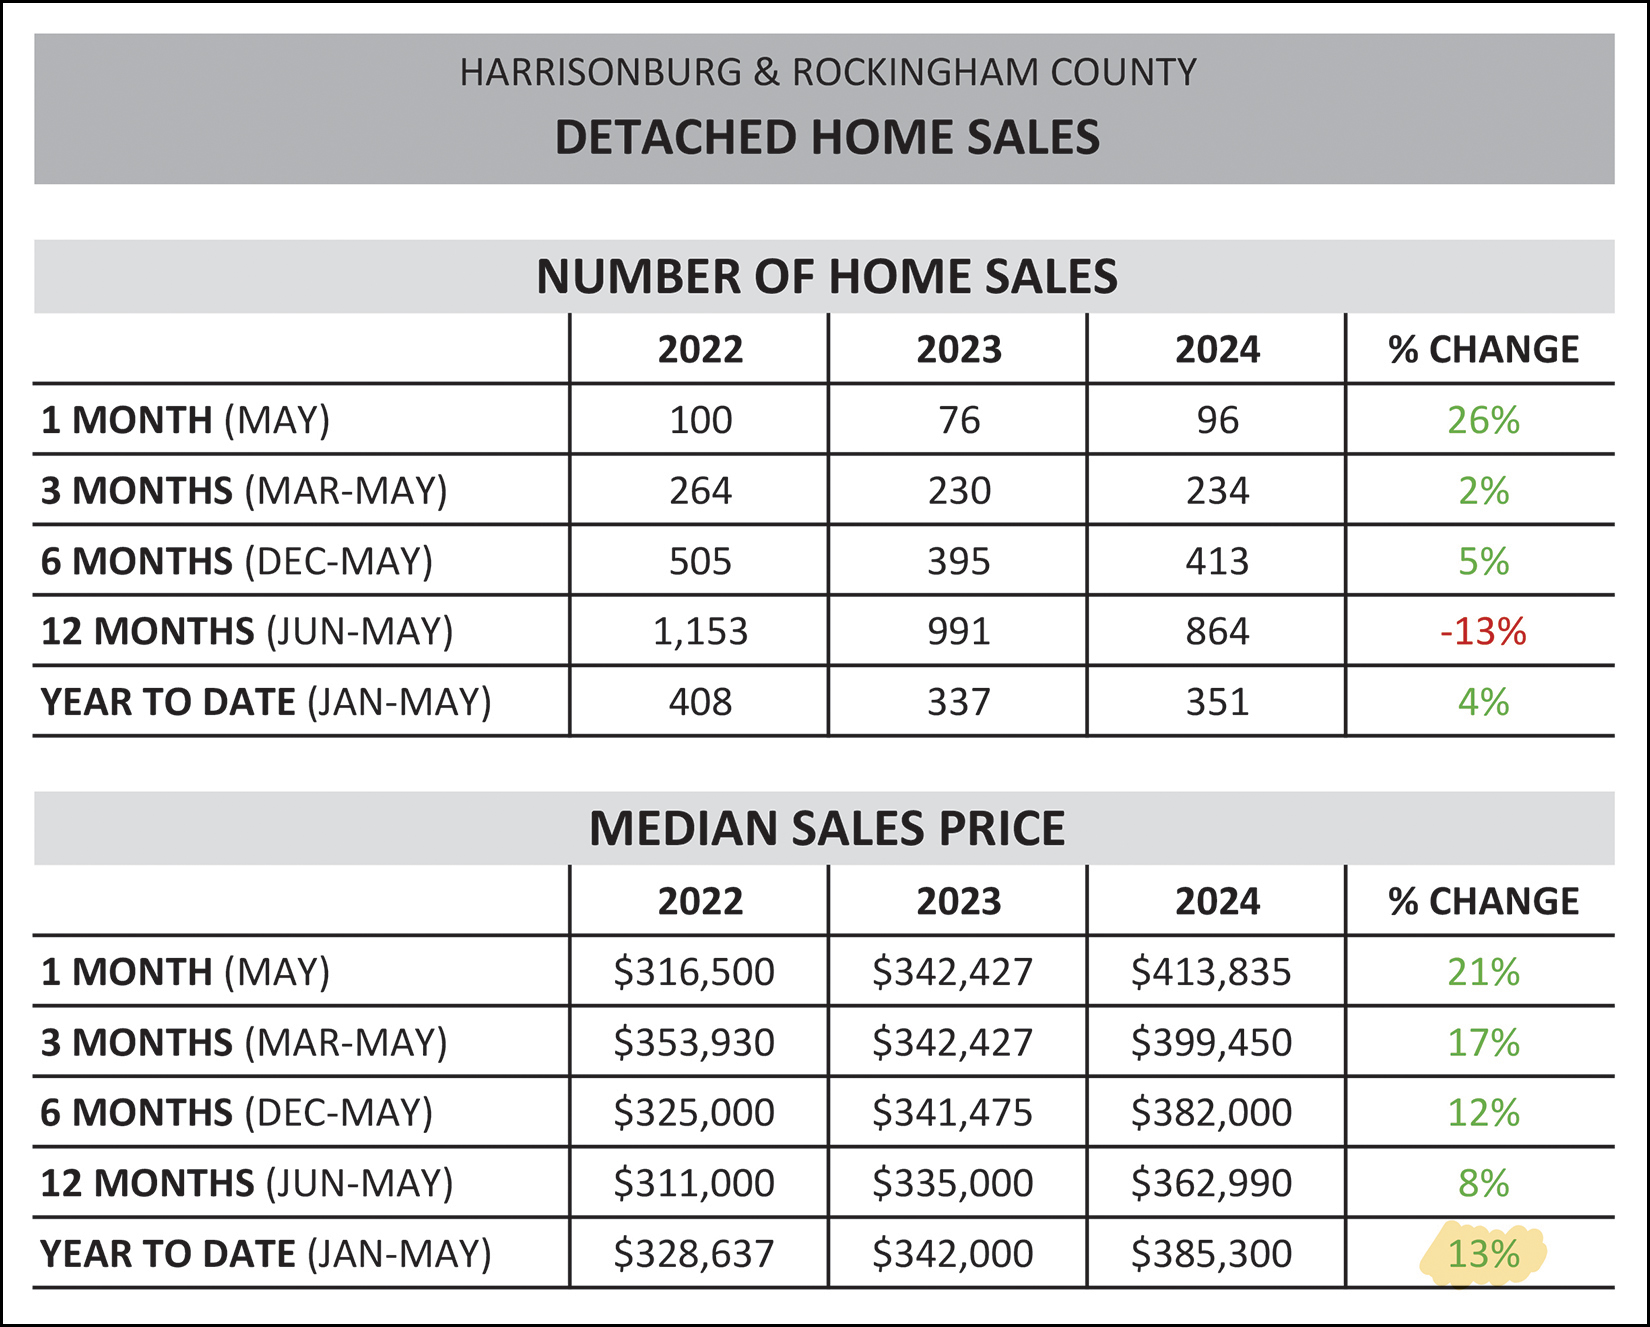 Sometimes it can be helpful to look only at detached home sales to see how they are comparing compared to the overall market. This month I am noting that the median sales price of all homes sold has only increased by 5% year to date (from $325K to $340K) but the median sales price of detached homes has increased by 13% year to date (from $342K to $385K). If you're trying to buy a home, you are likely paying a higher price now than you would have a year ago. If you are trying to buy a detached single family home, you are likely paying a much higher price now than you would have a year ago. As one final subset of the overall market data, here's a look at only existing homes... excluding new construction homes... 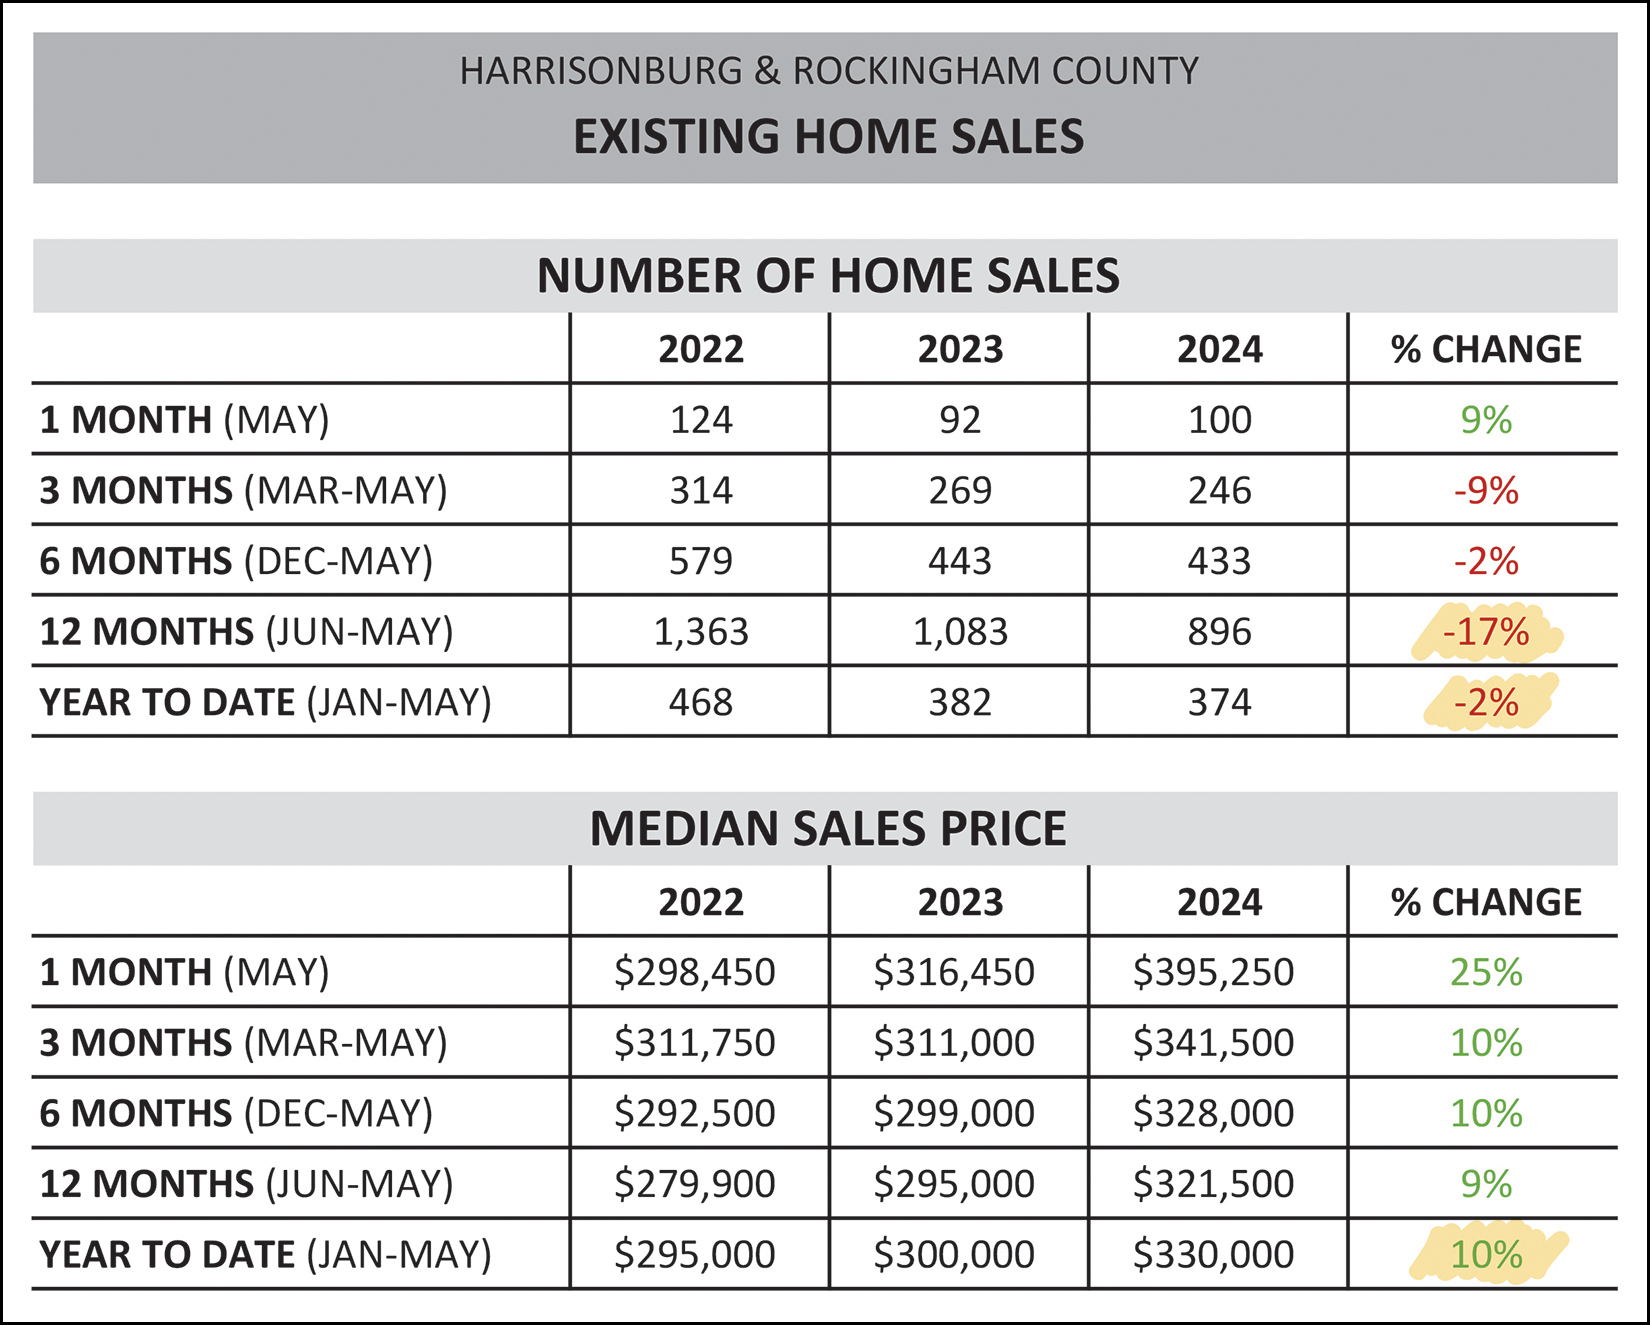 If you don't happen to want to buy a new home (based on their size, location, price, etc.) then you'll be focusing just on resale homes -- and there have been far fewer of those home sales over the past 12 months. We have seen 17% fewer resale home sales over the past 12 months (compared to the 12 months before that) mostly due to sellers not selling - rather than buyers not buying. In slightly better news, we have only seen a 2% decline in existing home sales year to date, so as to say that the decline is slowing in the number of existing homes that are selling. Perhaps it is unsurprising then that the median sales price of existing homes is 10% higher this year to date compared to last year to date, which shows a higher rate of increasing prices for existing homes as compared to the overall market. Now, I started off by mentioning that May home sales exceeded expectations... and you can see that more clearly here... 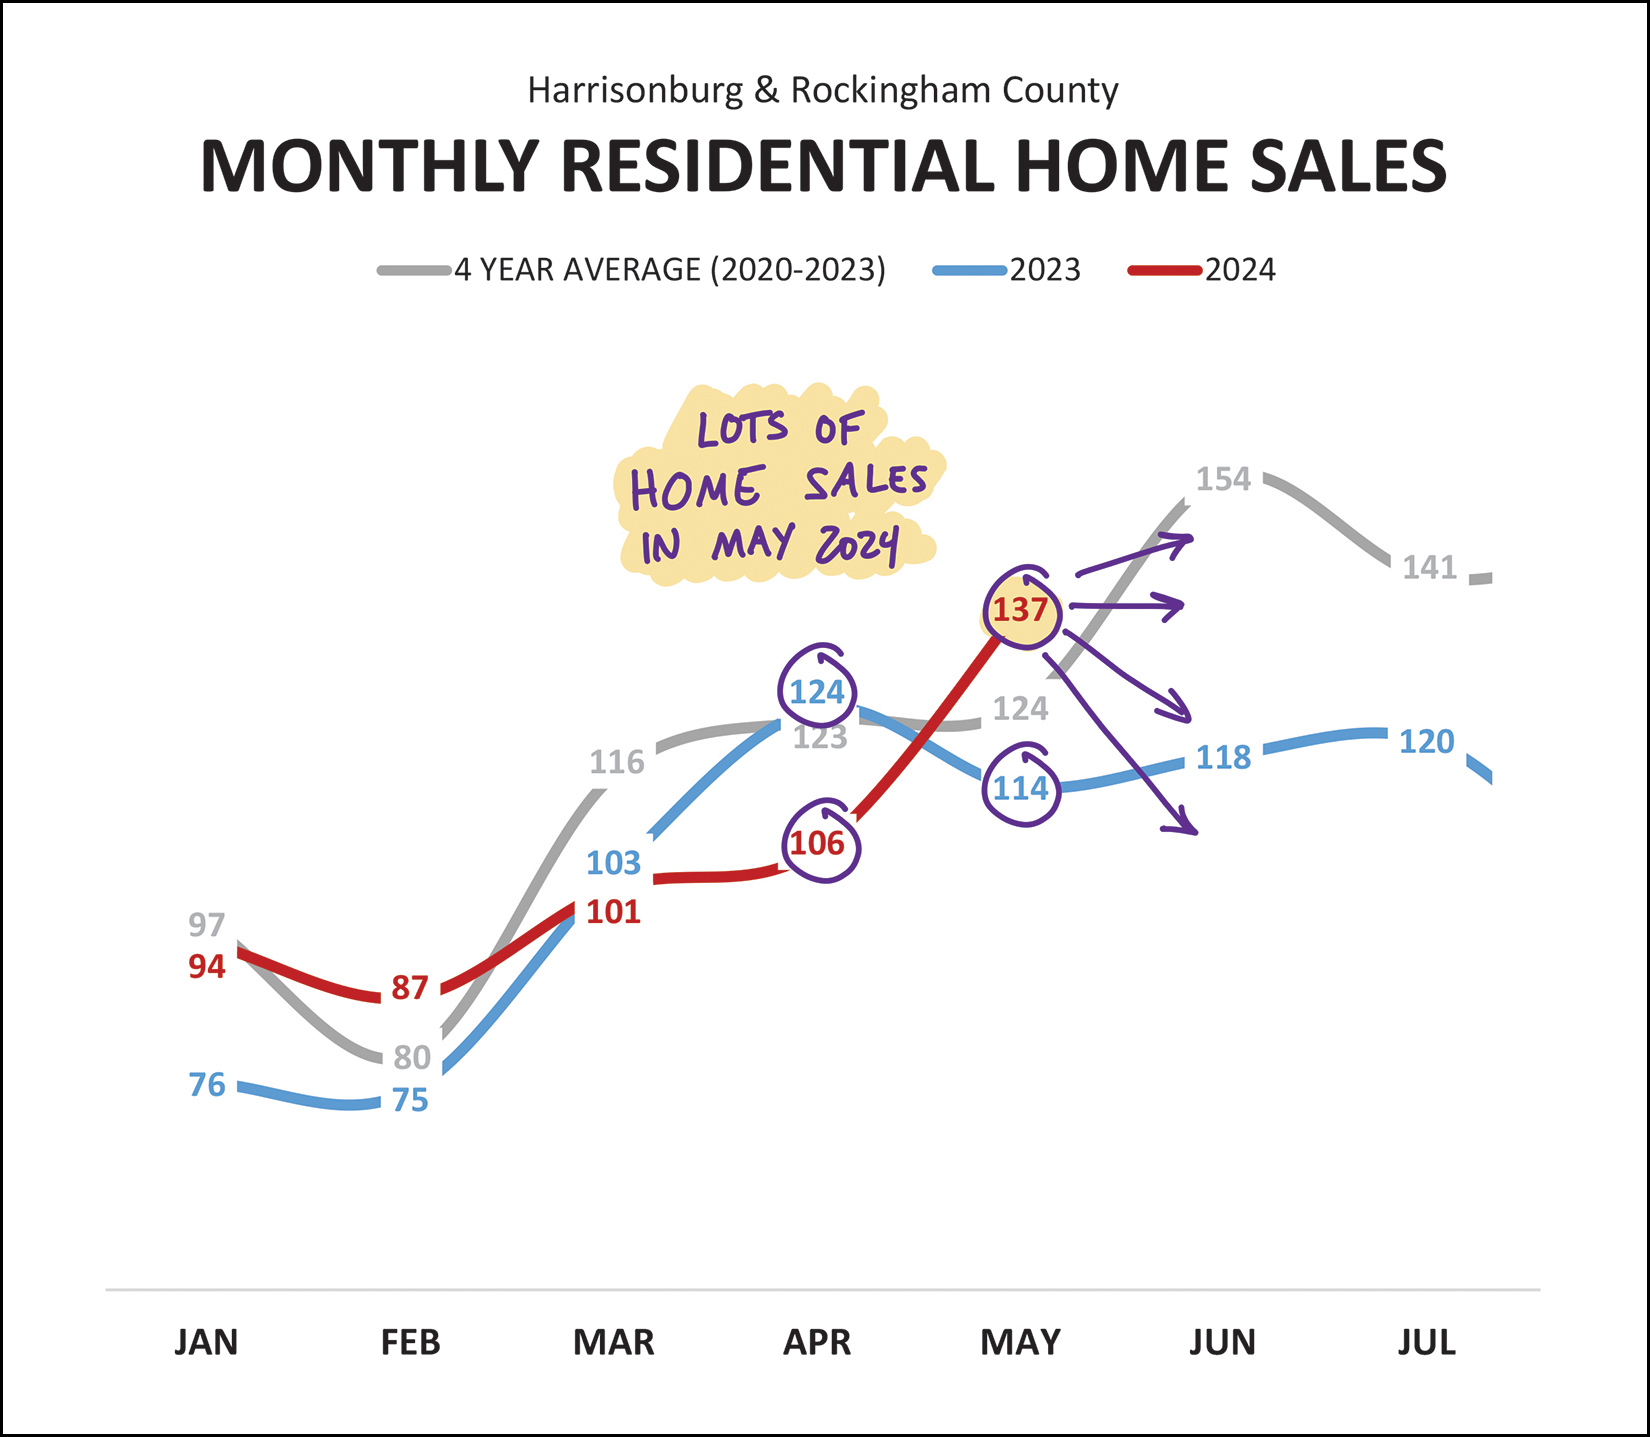 April home sales (106) were much (!) lower than last April (124) but May did not follow that pattern. After only seeing 114 home sales last May... there were 137 this May! Adding up those two months to see how April+May is tracking year over year, we find 243 home sales this year compared to 238 home sales last year. As you can see from my abundance of purple arrows above, it's hard to say where things will head in June... will home sales drop below 2023 again, or match 2023, or exceed 2023? It's hard to know for sure, but keep reading for the latest on contract activity and pending sales, both of which should give us somewhat of a hint of what is ahead. But first, let's see how this year stacks up compared to prior years... 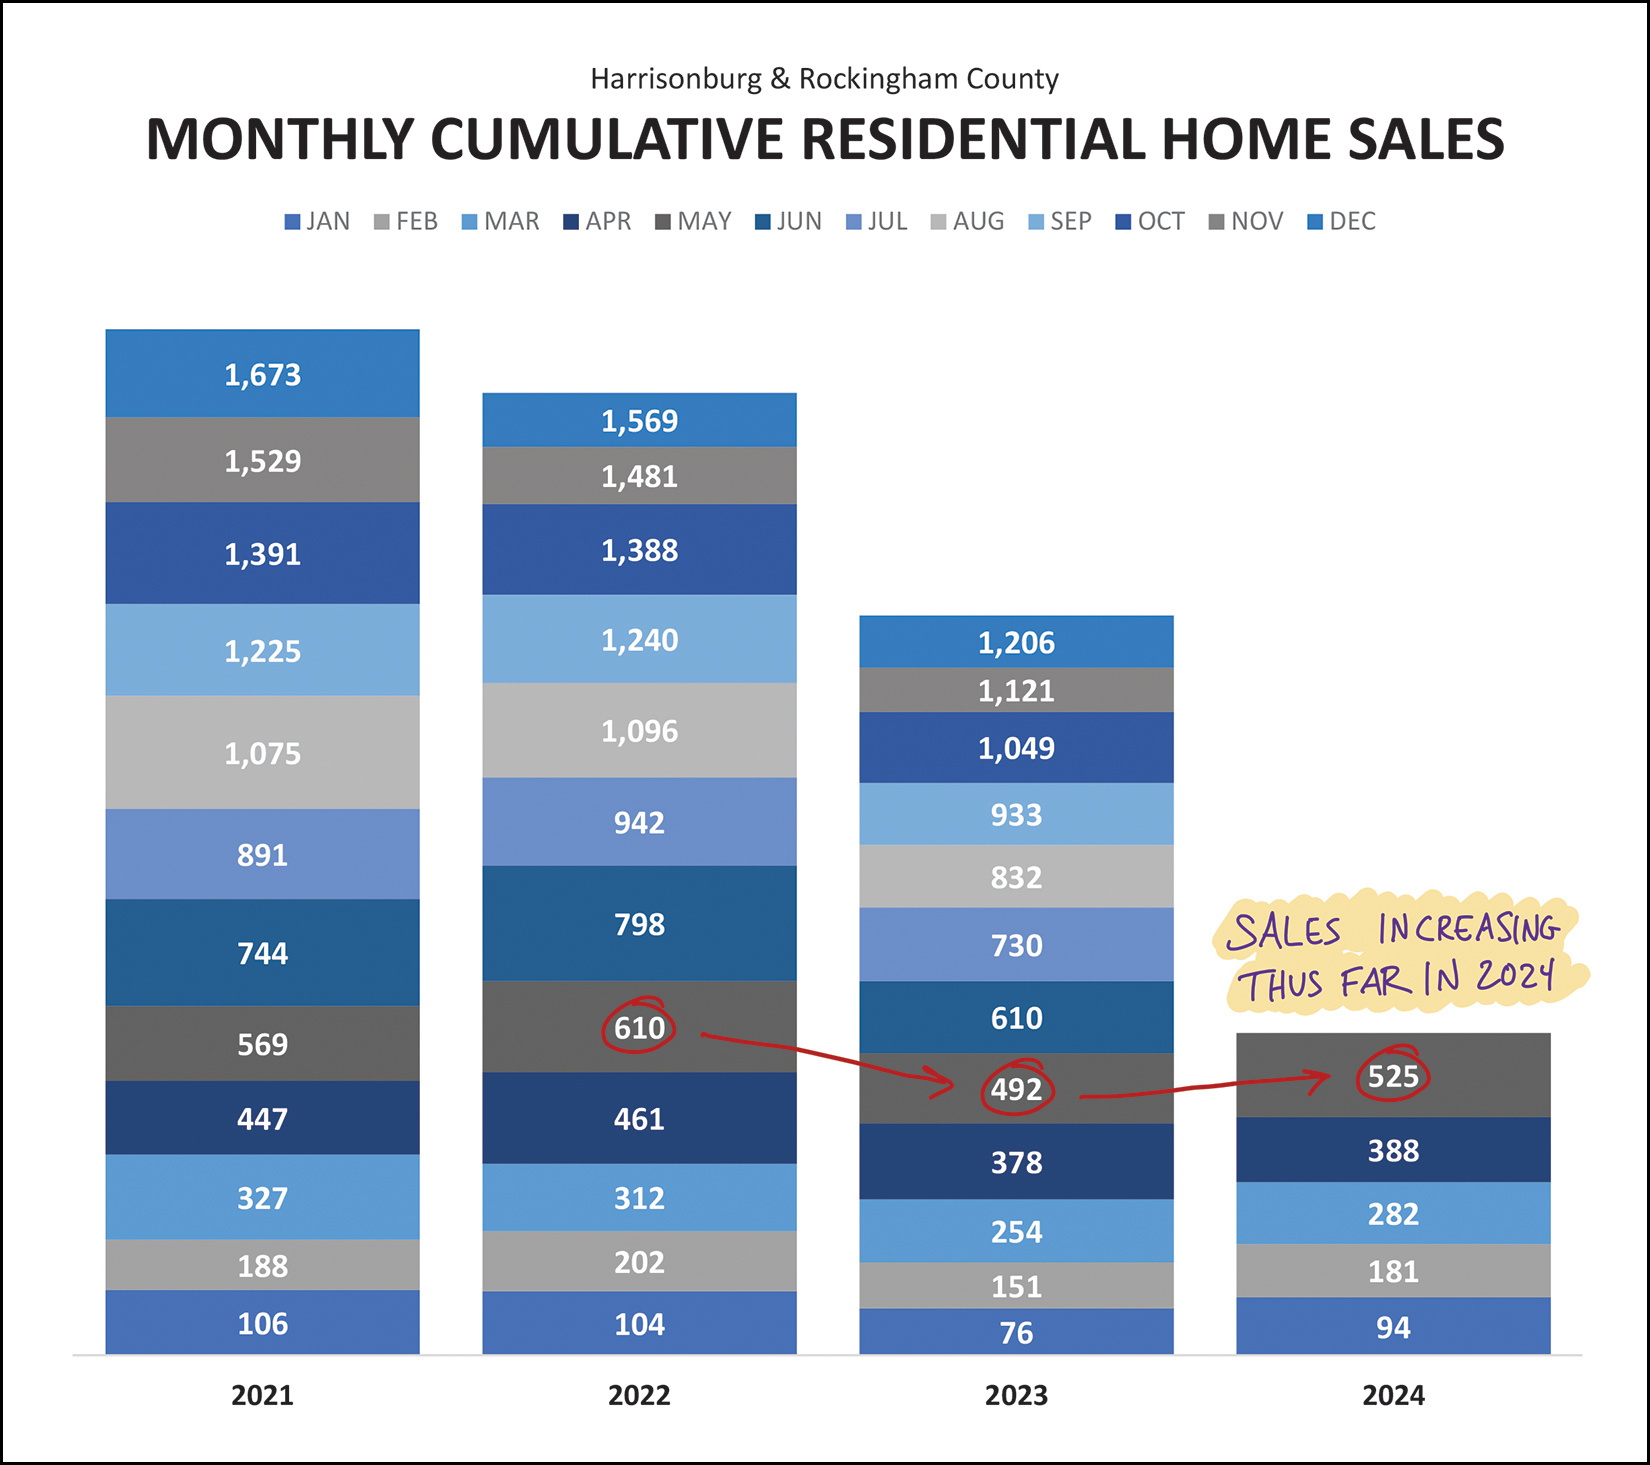 We have been seeing a decline in the number of home sales over the past few years (2021 to 2022 as well as 2022 to 2023) but that might be reversing itself in 2024. The 525 home sales we have seen in the first five months of 2024 puts us ahead of 2023, though certainly still behind 2022 and 2021. Stay tuned to see if we can come out ahead of the 1,206 home sales we saw last year. Next up is a monthly look at rolling 12 month trends... 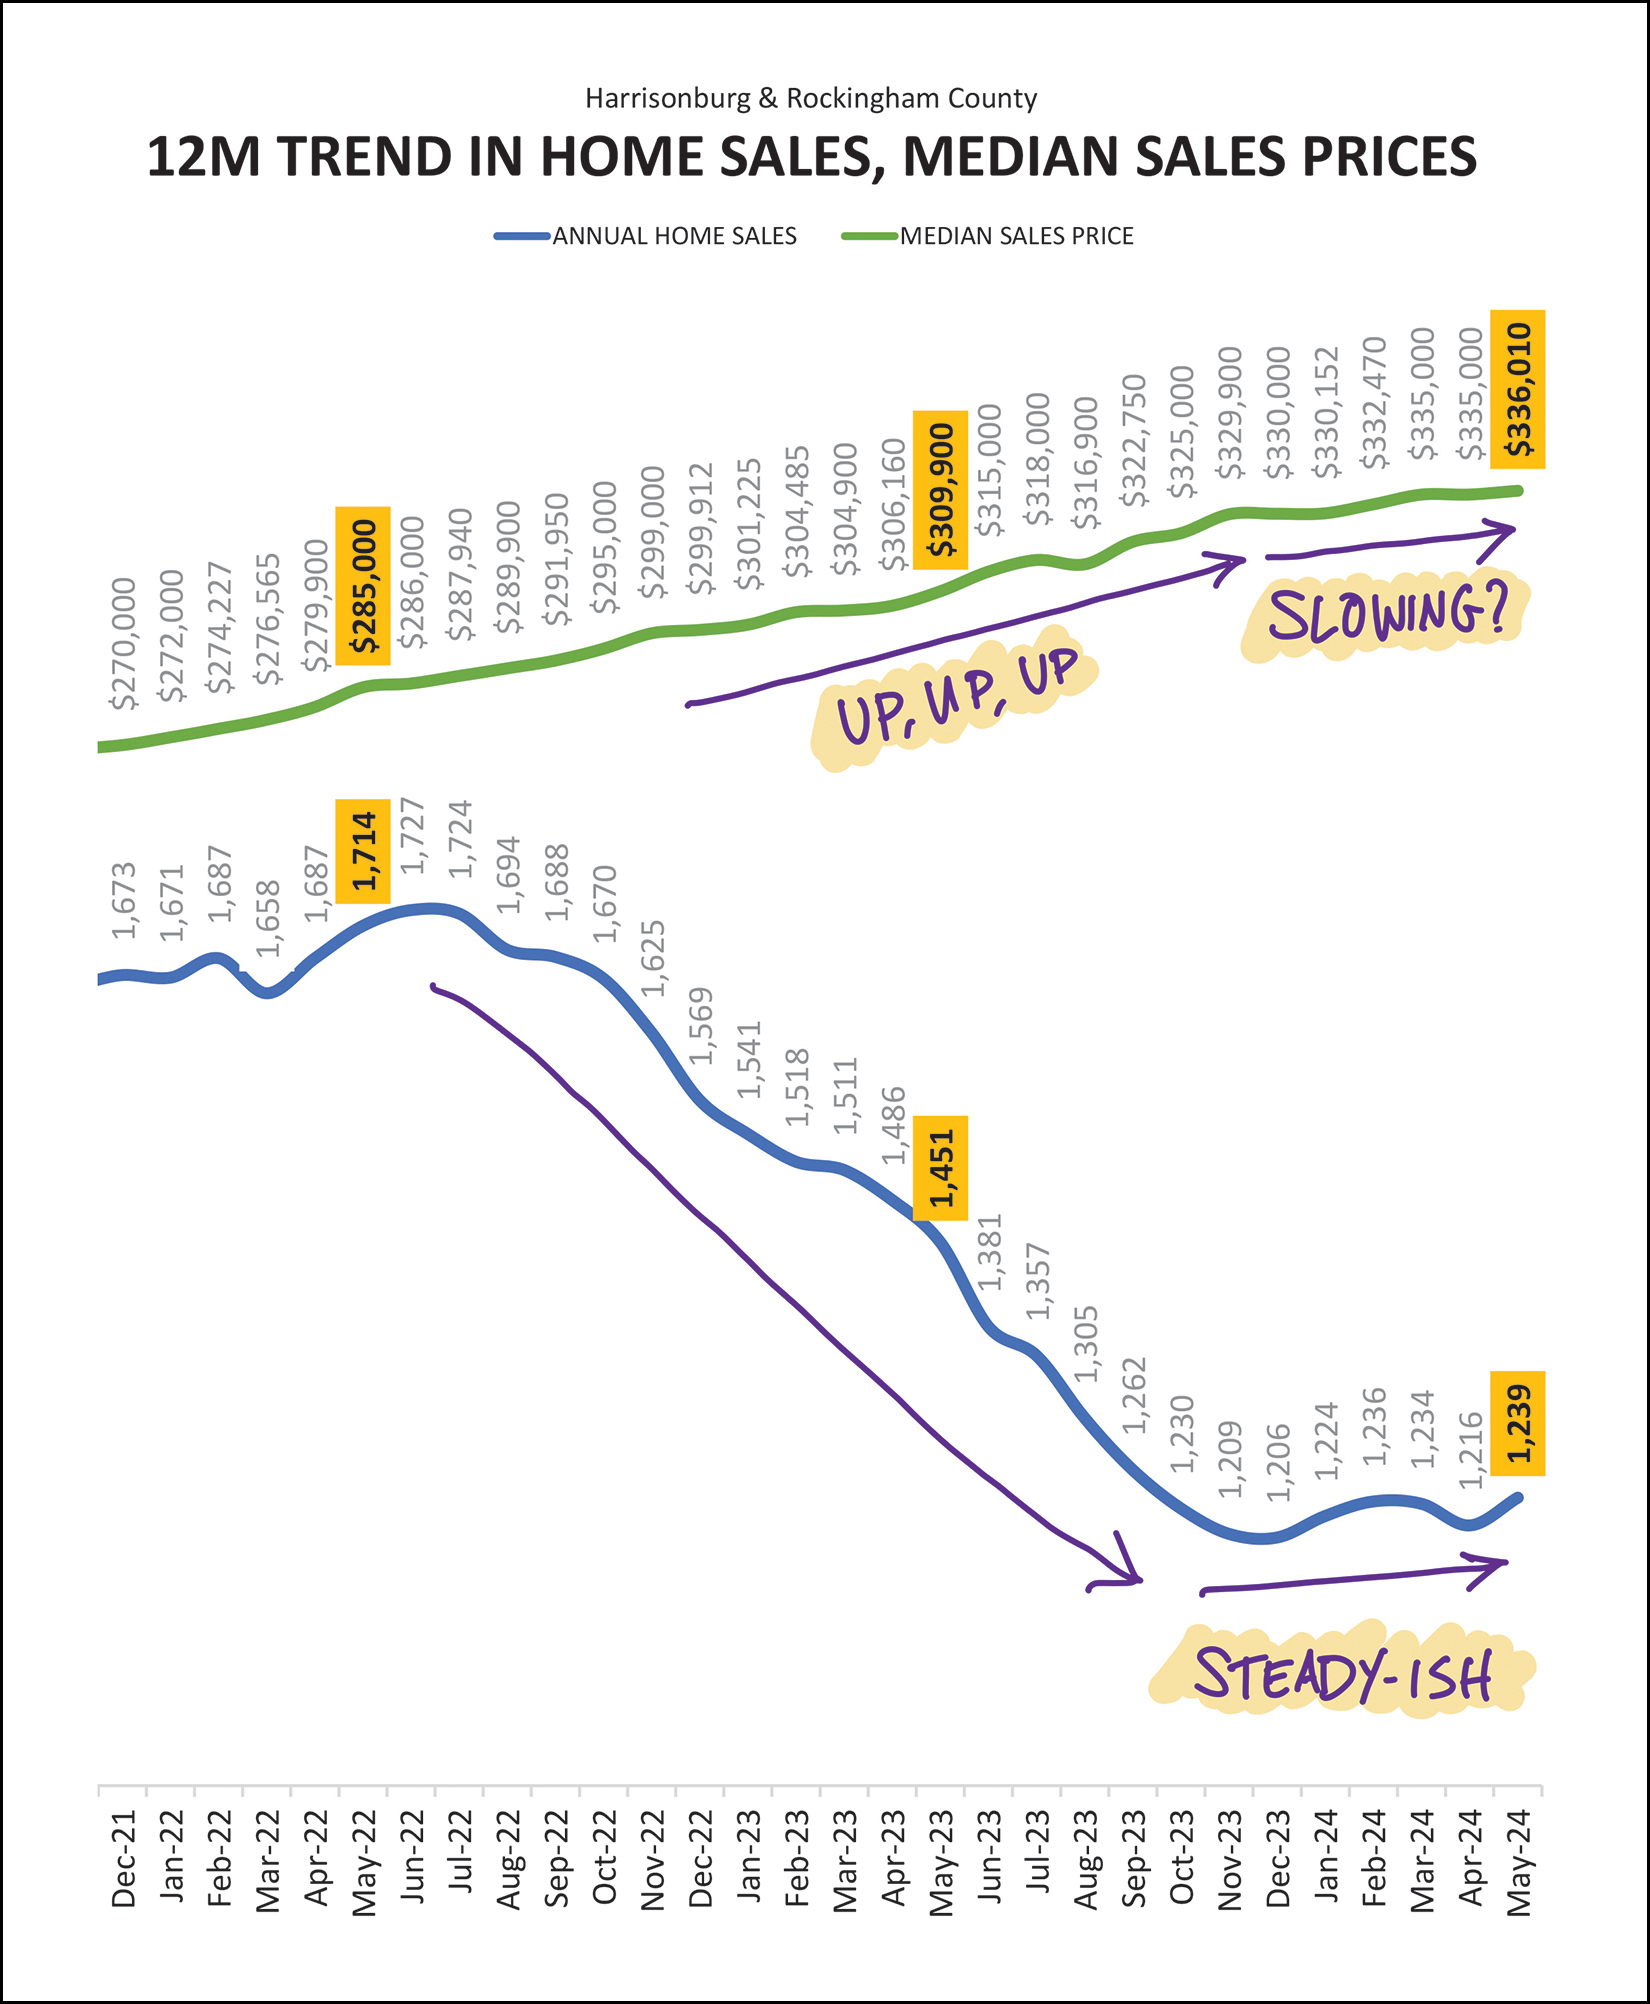 The top (green) line shows (barely, if you squint) what I have already mentioned in this month's report... median sales prices are increasing, but maybe not quite as quickly over the past six months as compared to their trajectory over the past few years. But, we'll need to continue to watch this metric to see if price increases are indeed settling down a bit. The bottom (blue) line shows that after almost two years of a downward trend in the number of homes selling in Harrisonburg and Rockingham County... we might finally be seeing things level out and increase a bit. We peaked above 1,700 home sales a year... and over about two years then saw things bottom out at just over 1,200 home sales a year. Will this trend slowly make its way back up to 1,300 home sales a year? If so, how soon? I mentioned new vs. existing home sales a bit earlier, but here's how the breakdown looks over the past few years... 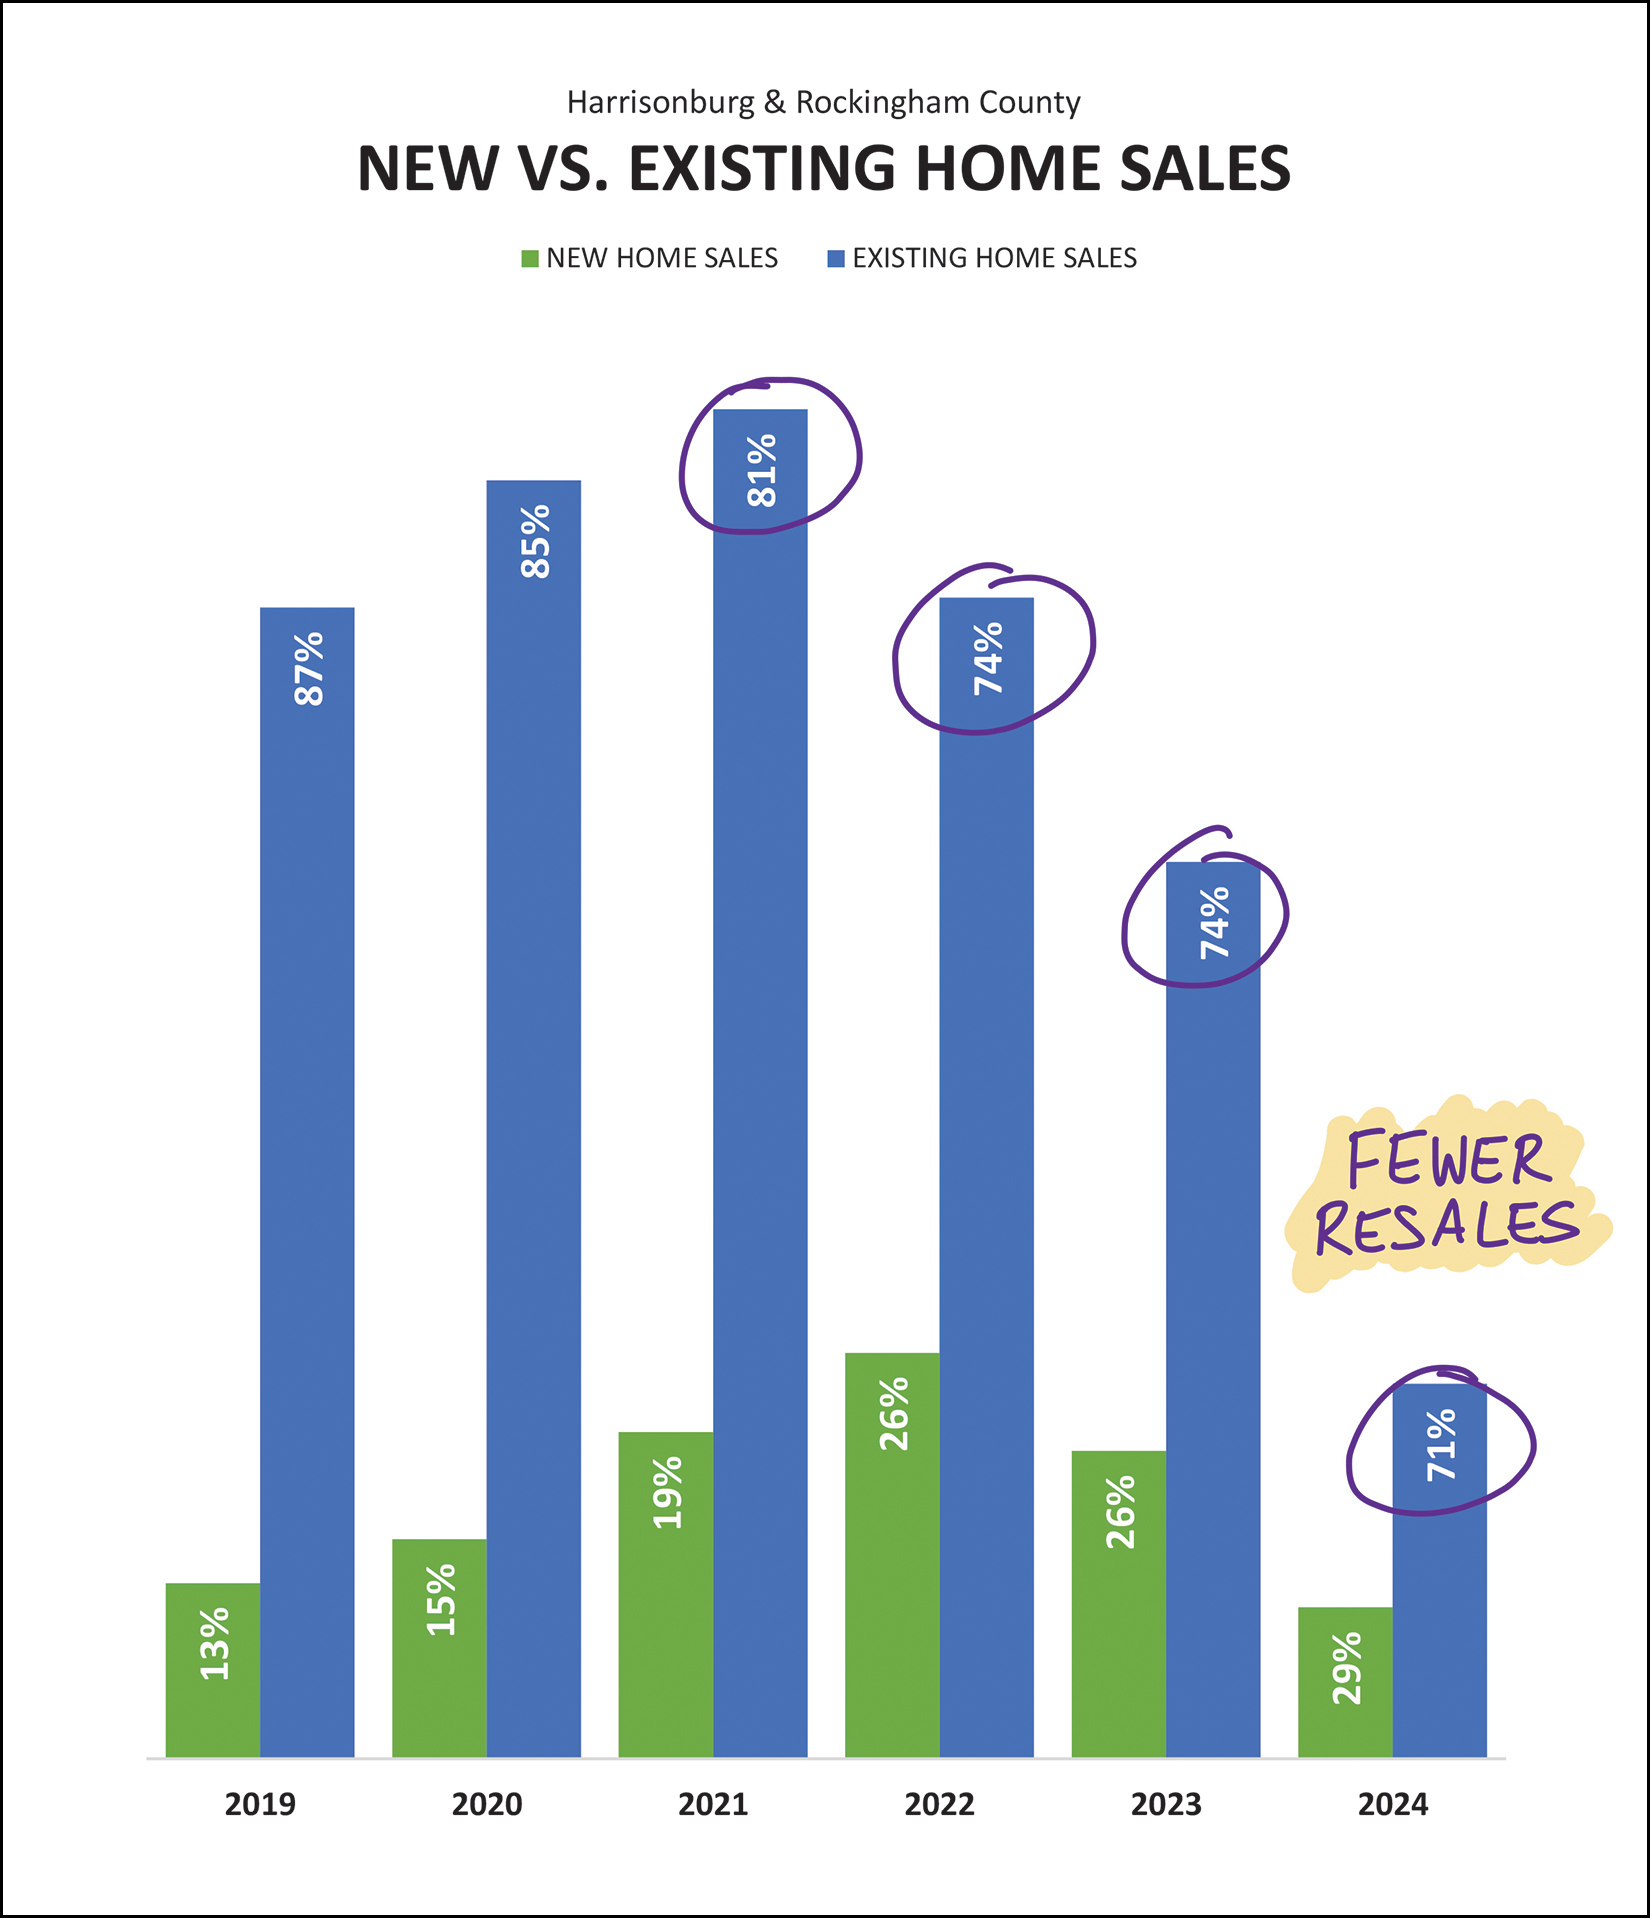 We have seen a steady decline in the number of existing homes selling in our market... and in the percentage of home sales that are existing homes. Three years ago 81% of home sales were existing homes and only 19% were new homes. This year only 71% of homes that are selling are existing homes and 29% are new homes. Many homeowners have low mortgage interest rates on their existing mortgages and thus do not want to sell their homes -- which is contributing to lower numbers of existing home sales. We are also seeing many more new home communities in our area -- from local builders, but mostly from regional builders. I suspect we will continue to see new homes making up 25% or more of all home sales over the coming years. Now, for predicting the future... 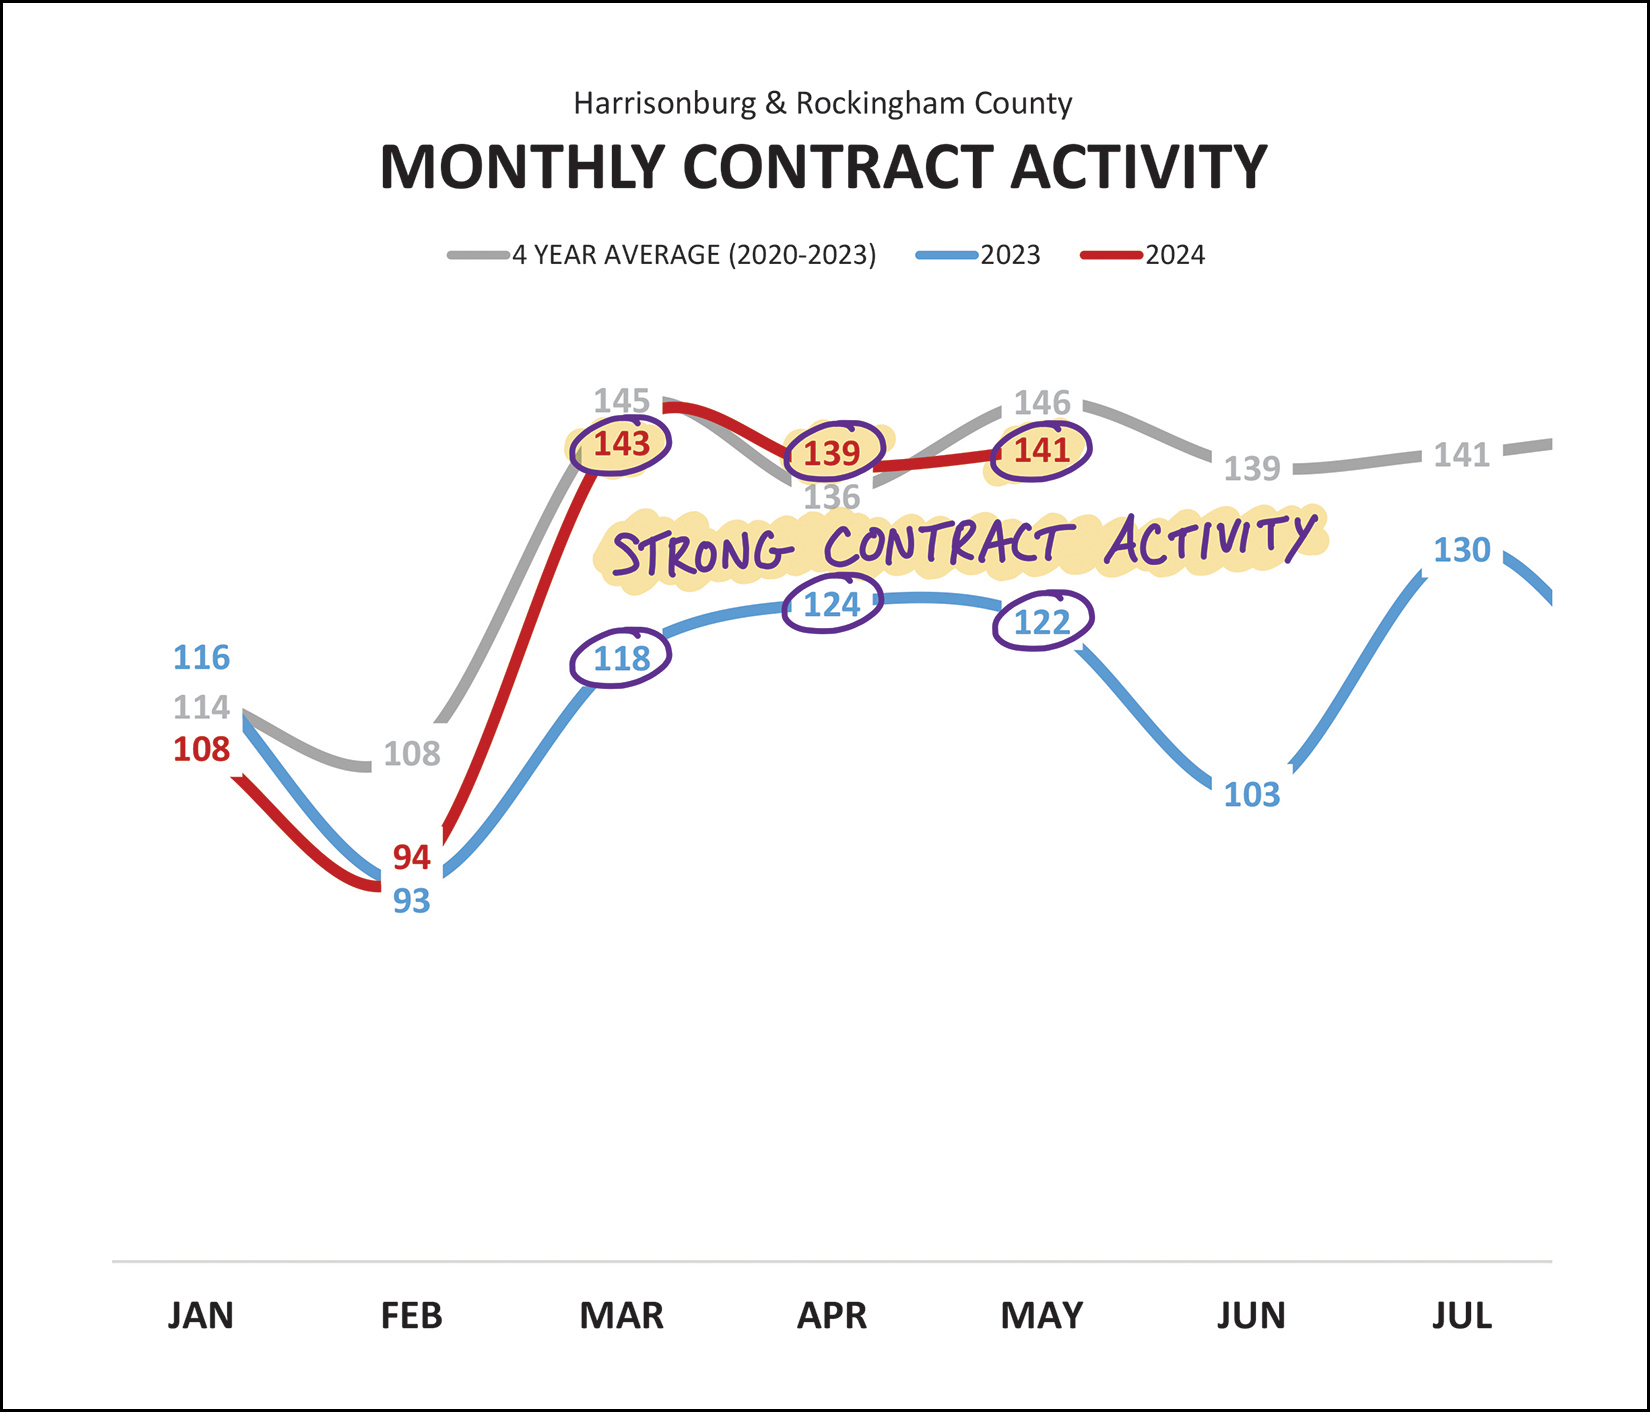 After a strong month of sales activity in May, one might wonder what the next few months will hold. As shown above, we have now had three straight months of solid contract activity (red line) compared to those same months last year (blue line). Over the past three months, 423 buyers (and sellers) have signed contracts compared to only 364 in the same three months last year. These strong levels of contract activity suggest that we will continue to see at least several more months of strong home sales. Trends in pending home sales also supports that theory... 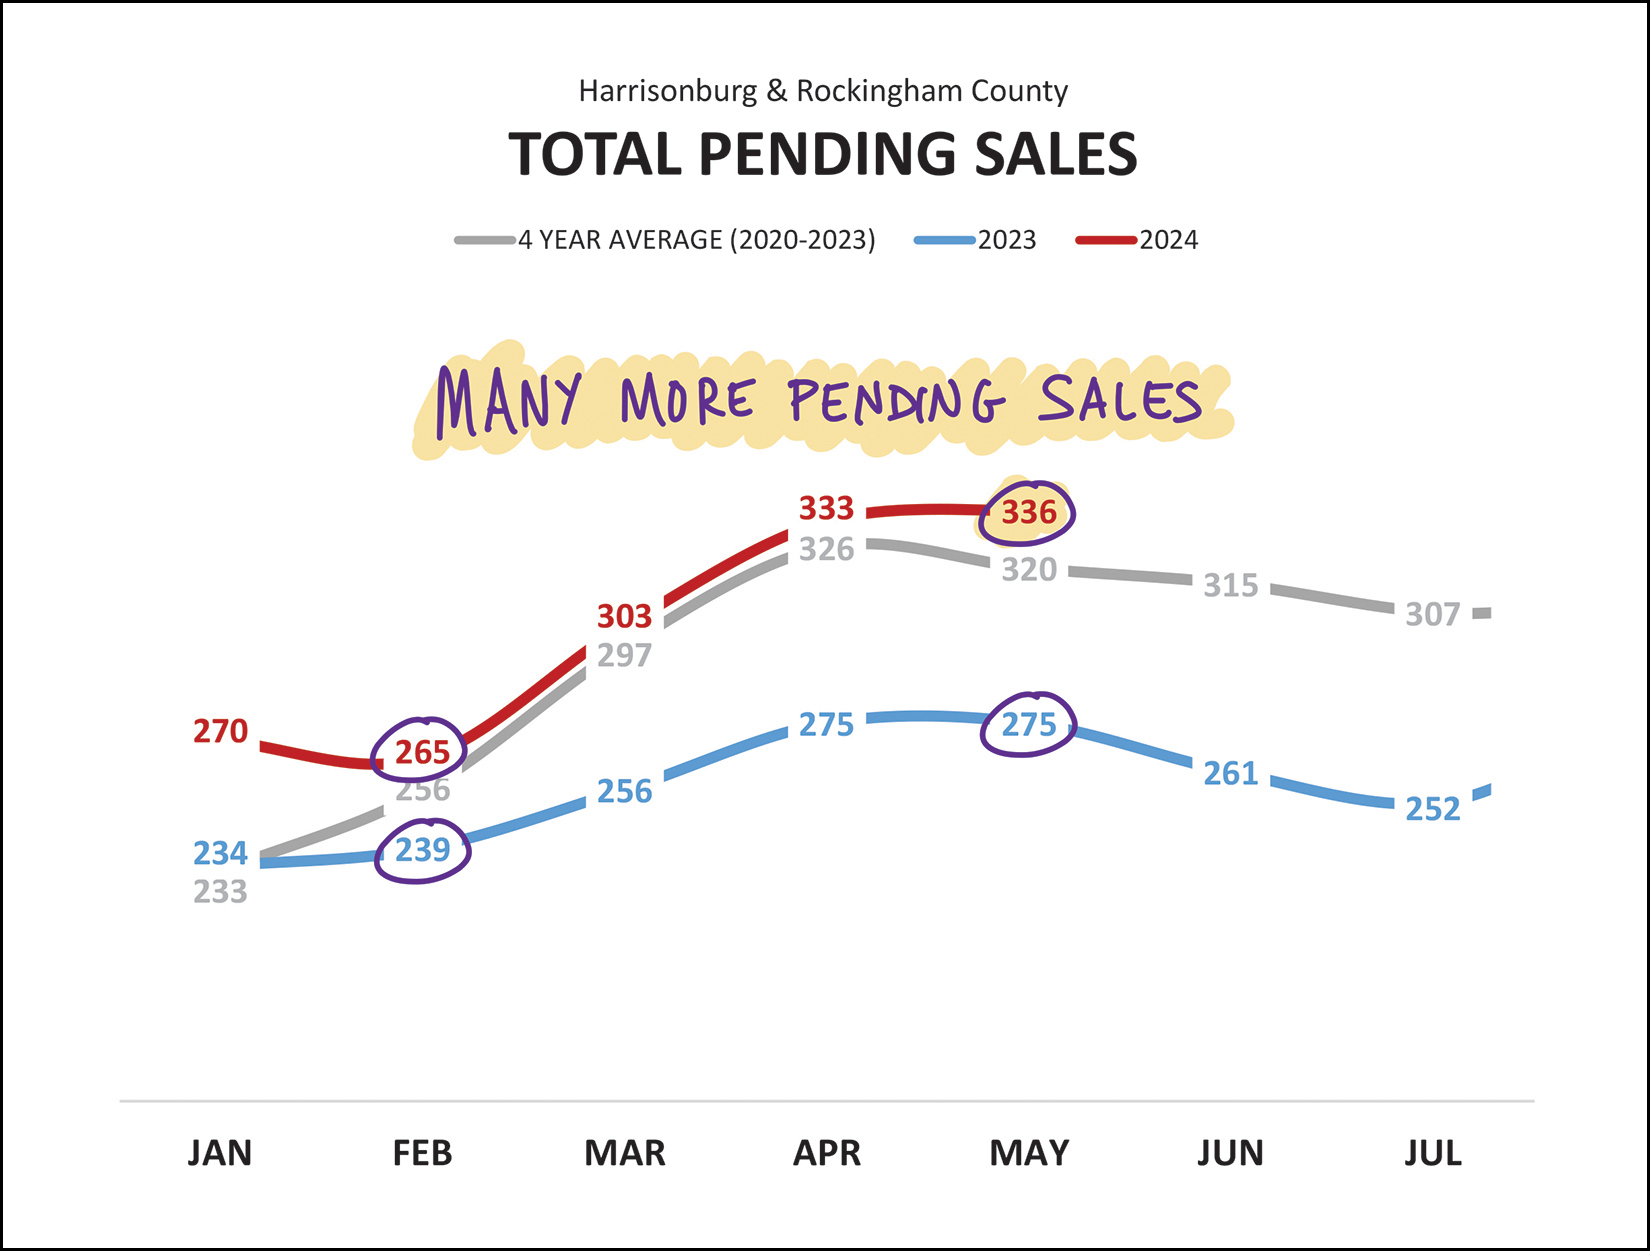 A year ago (blue line) there were only 275 homes under contract (pending) in Harrisonburg and Rockingham County. Today, that has risen to 336 homes under contract in our market. The overall declines in the number of homes selling may be behind us at this point given recent months of strong contract activity and the current trends in pending home sales. Perhaps unsurprisingly, inventory levels are also declining a bit... 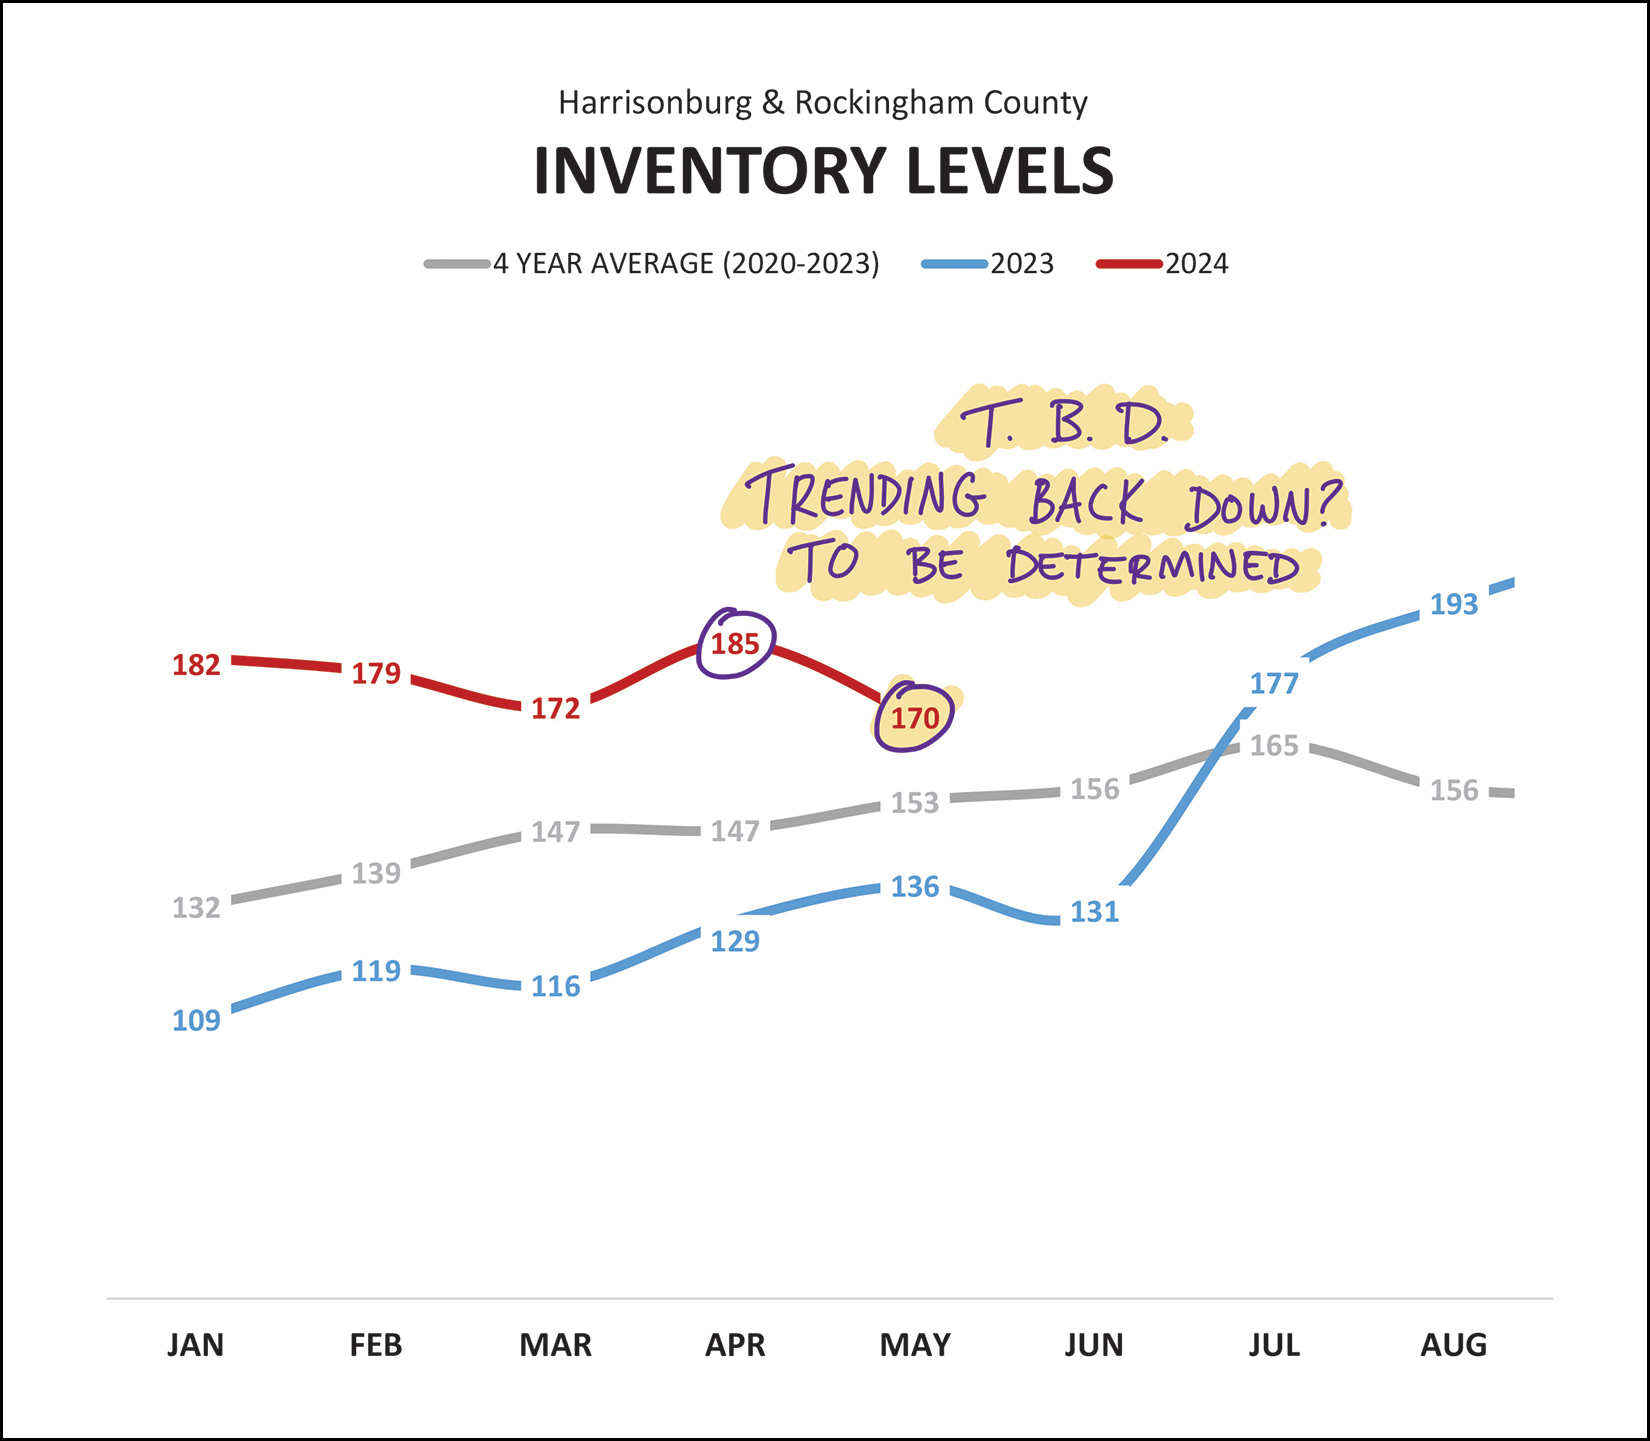 Back in July 2023 we saw inventory levels start to rise... and they have stayed higher than expected since that time. But... at least as of today, inventory levels are trending back down a bit. Will this trend continue? Or is it a one month blip? Stay tuned. Keep in mind that even as inventory levels rose from the 100-130 range to the 180-200 range, all of those levels are well below pre-COVID inventory levels. Days on market -- how quickly homes go under contract -- is also keeping things interesting lately... 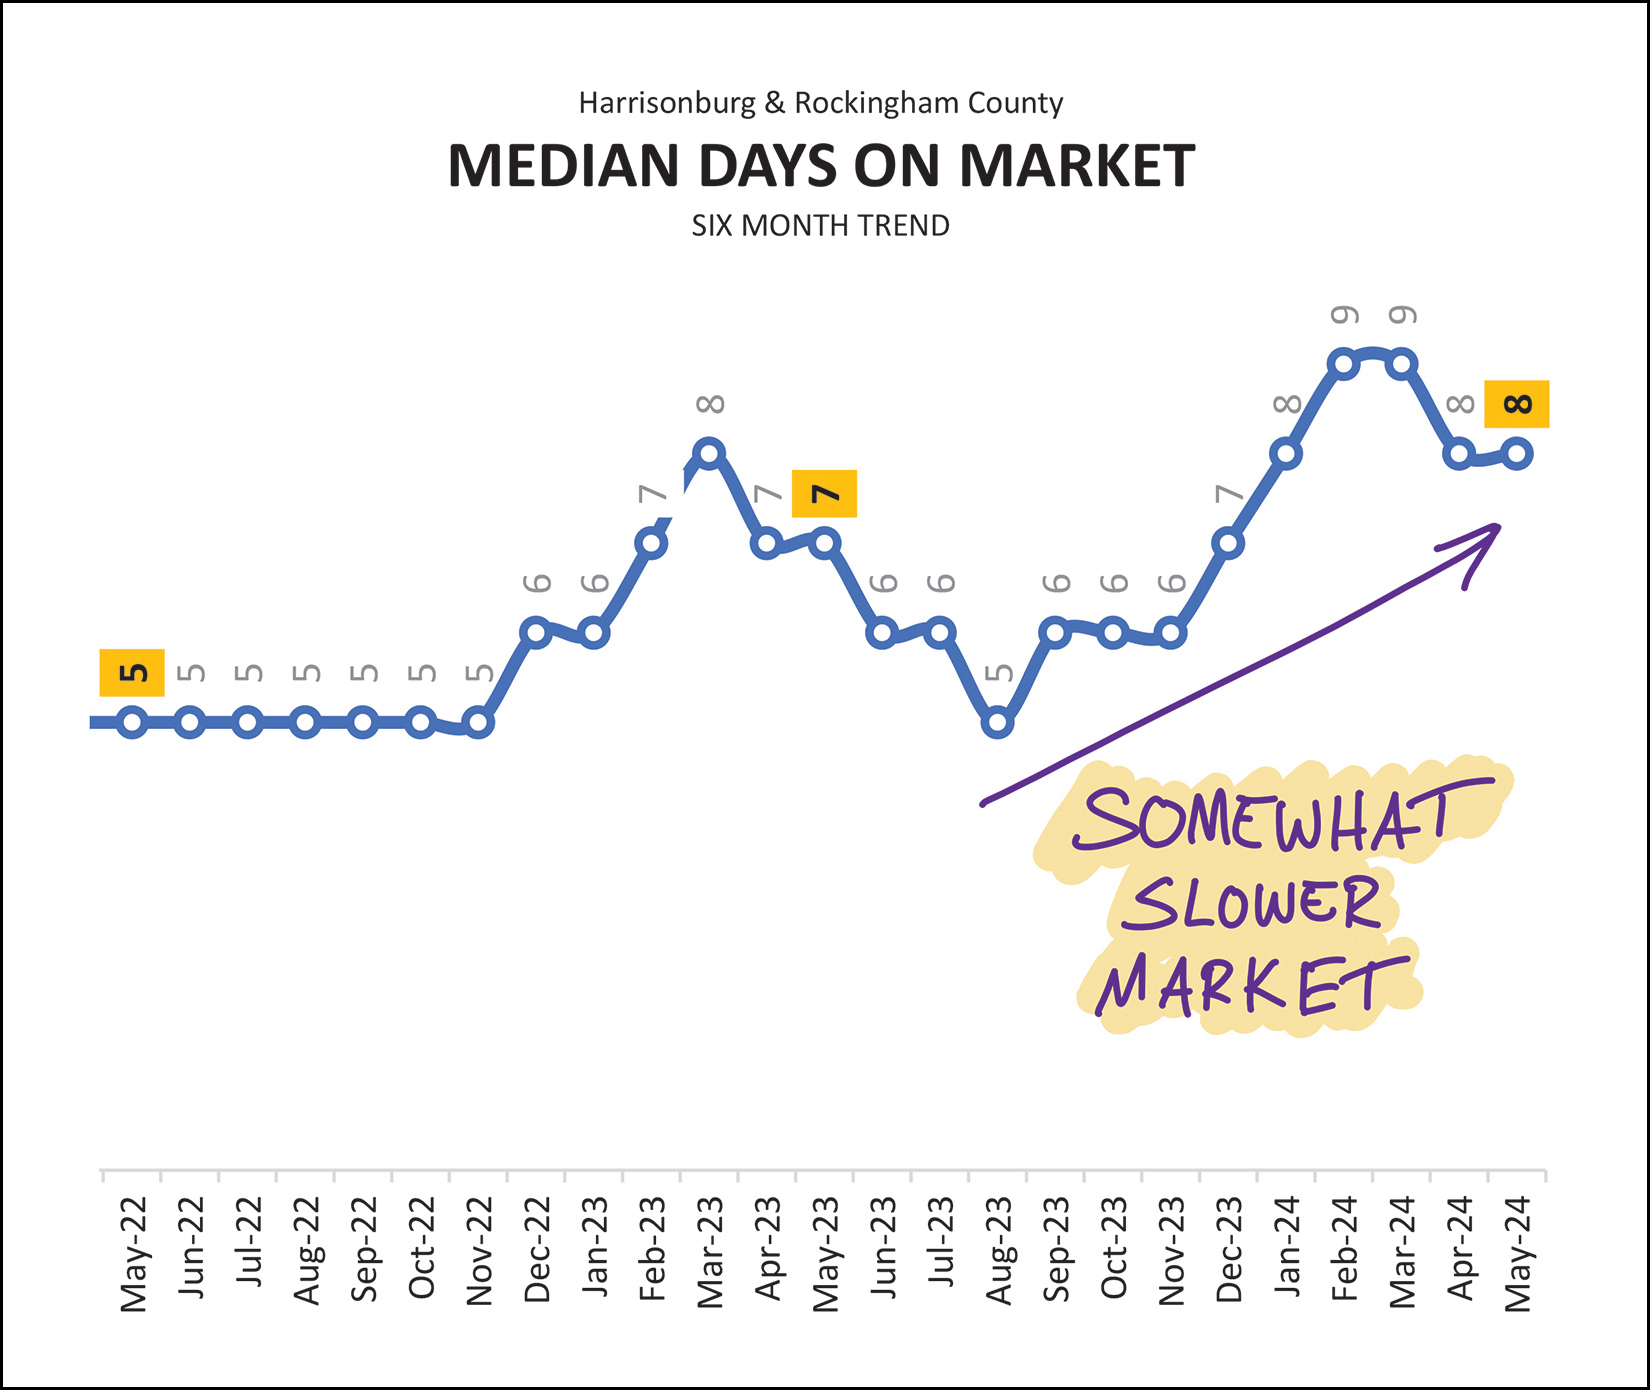 After several years of a median days on market of four or five days, we started to see this metric drift upward in late 2022, corresponding in large part to increases in mortgage interest rates. Last summer we saw days on market start to decline again (back down to five days in August 2023) but then it rose through early 2024. Has the market slowed back down since that time -- or are we starting to see a seasonality to this metric? We'll need to see how things develop as we progress through the remainder of the summer months. And, finally, those mortgage interest rates... 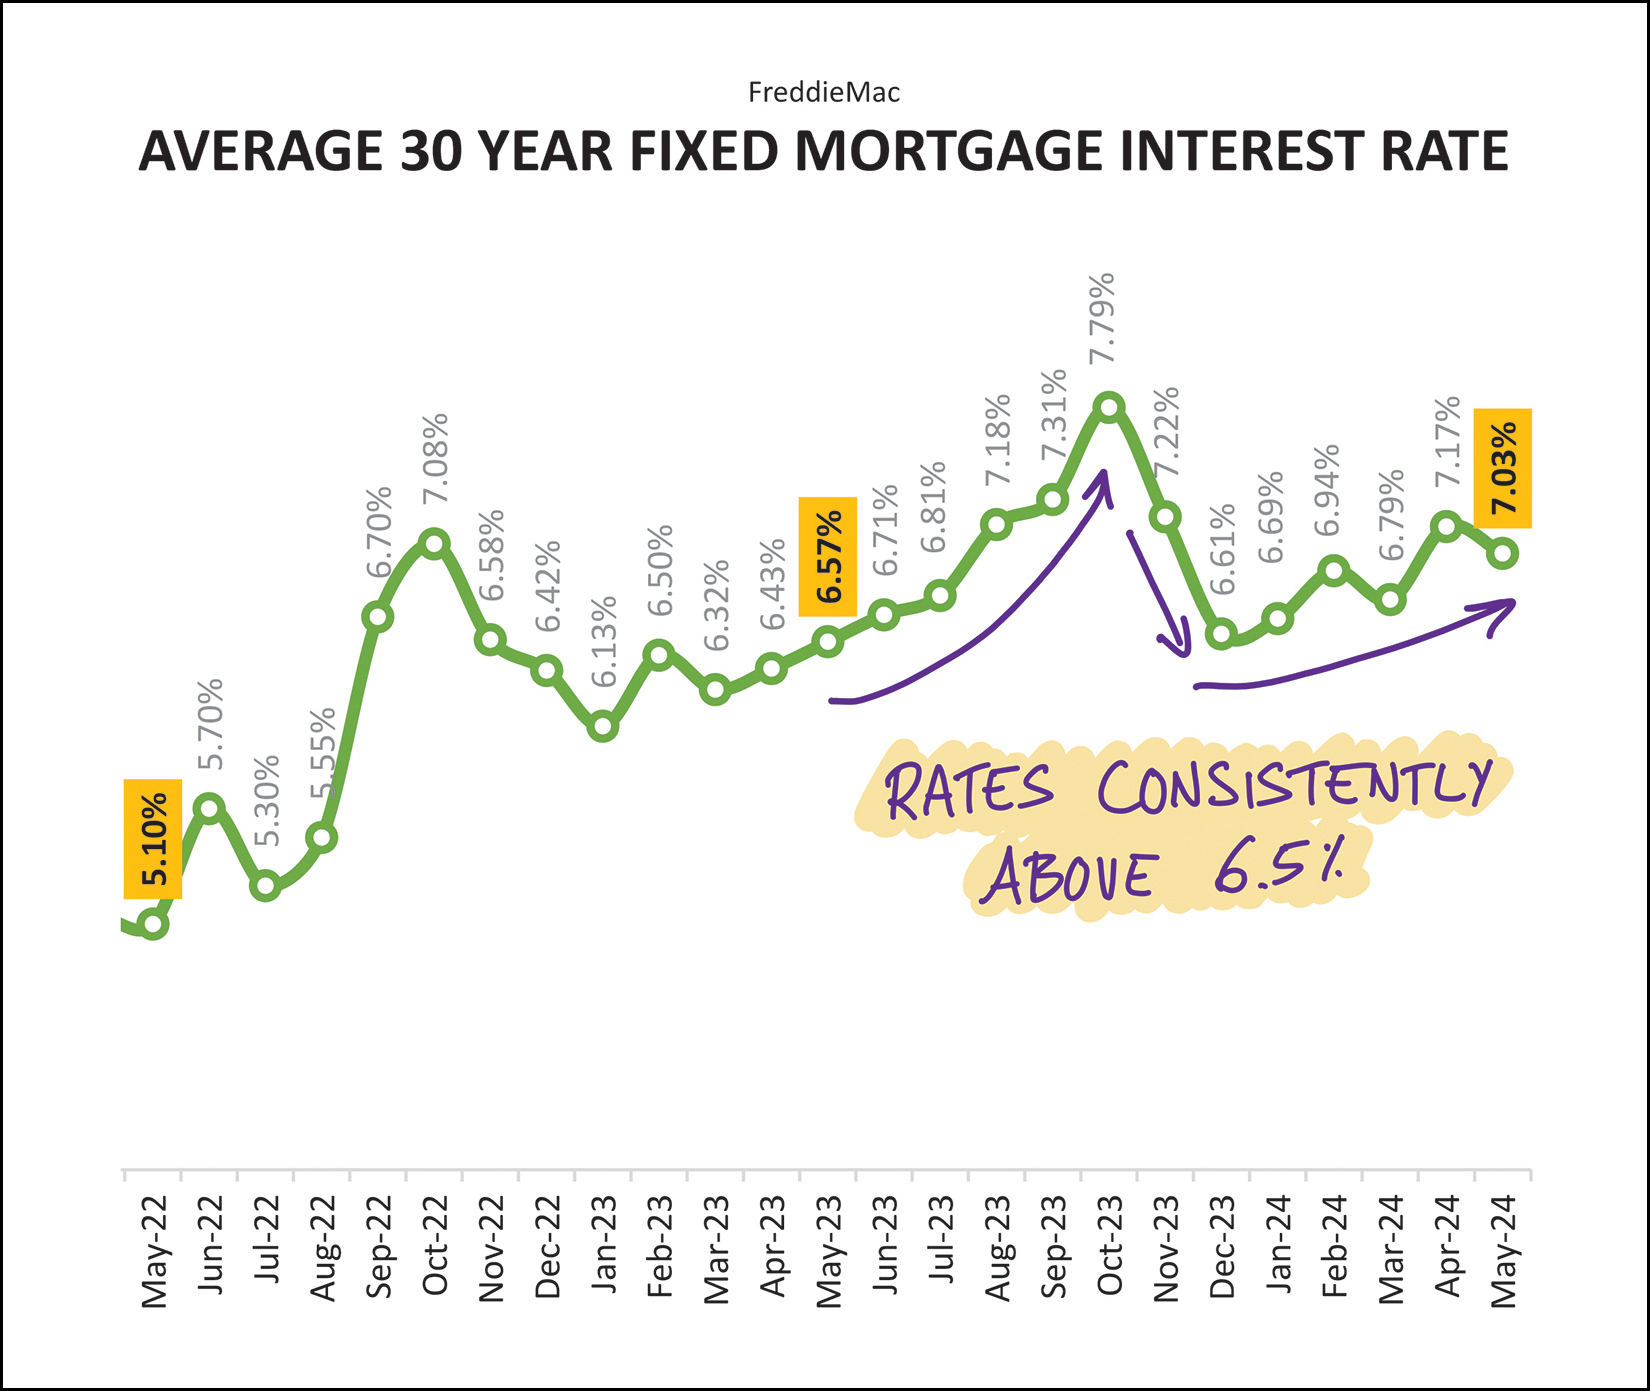 Two years ago the average rate was just above 5%, and rates peaked last Fall just under 8%, but the average 30 year fixed mortgage interest rate has been consistently above 6.5% for a year now... and there are not any indications that we'll see anything below 6.5% anytime soon. Most home buyers (or would be home buyers) have now adjusted to this new interest rate environment, and hopefully nobody is planning to wait to buy until rates get below 5%. There is talk of mortgage interest rates potentially coming down some over the remainder of the year, but we've heard that talk quite a few times over the past six (+) months and it hasn't measurably happened yet. As I bring this monthly market recap to a close, I'll point out that I post even more charts and graphs for your perusal each month over here. And finally, as we look ahead through the summer and towards the fall... If you plan to sell your home in the next six months, let's chat sooner rather than later about market conditions, your home preparations, your timing objectives and more. If you are considering a home purchase in the next six months, I'd be happy to chat with you about the buying process, the market and introduce you to some mortgage lenders who can help you consider your financing options. Reach out to me anytime via phone/text at 540-578-0102, or by email here. Recent Articles:
| |
| Newer Post | home | Older Post |
Scott Rogers
Funkhouser Real
Estate Group
540-578-0102
scott@funkhousergroup.com
Licensed in the
Commonwealth of Virginia
Home Search
Housing Market Report
Harrisonburg Townhouses
Walk Through This Home
Investment Properties
Harrisonburg Foreclosures
Property Transfers
New Listings

