| Newer Posts | Older Posts |
Local housing market stable in January 2012 |
|
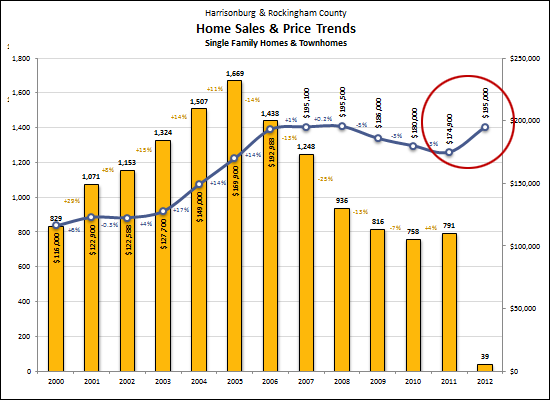
Our local housing market remained relatively stable in January 2012, showing some indicators that we will continue the new trend we saw in 2011. To remind you..... In 2011, after a five year slide (and a 55% drop) in the pace of home sales, our local real estate market showed a 4% improvement in the pace of home sales last year, even though the median sales price declined another 3%. Jump to the PDF of my monthly market report, or keep reading for an overview. 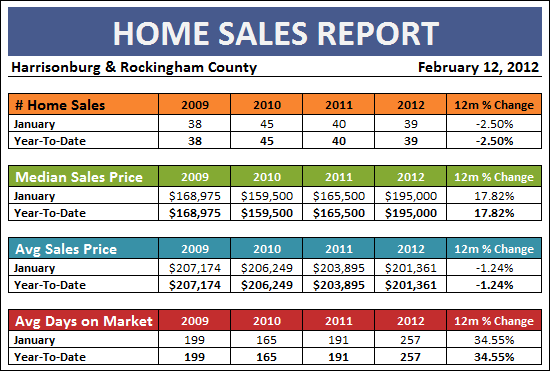 Important trends to note:
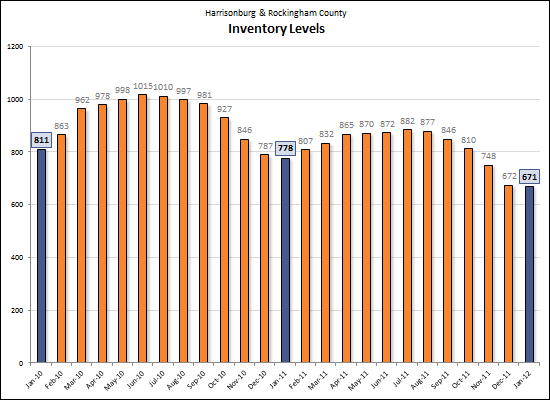
Inventory levels continue to decline (as shown above) with a 14% decline over the past year, and an overall 17% over the past two years.
Perhaps one month of data is too small of a data set to draw some conclusions --- otherwise we'd think our market has REALLY recovered, as the median sales price increased 11% when comparing 2011 to January 2012. For a more detailed look at the Harrisonburg and Rockingham County real estate market, download my full market report as a PDF. | |
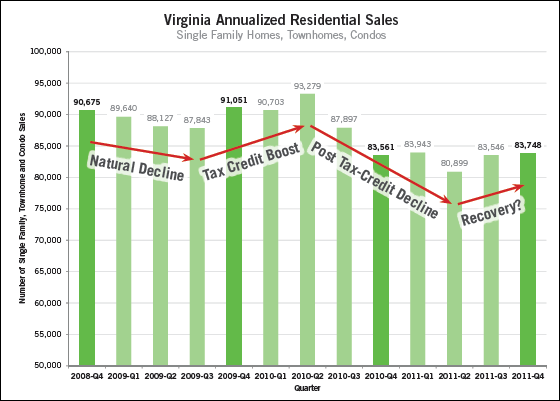
Virginia housing market shows signs of returning stability |
|
How much are buyers (and sellers) negotiating on price? |
|
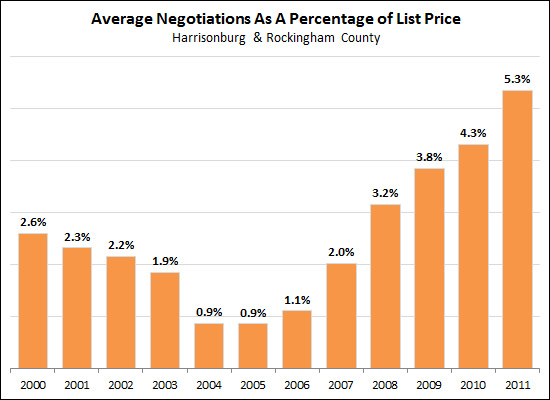 More than they ever have! Pre-boom, buyers (and thus sellers) were negotiating an average of 2.6% on price -- that is to say that homes were selling for 97.4% of the list price. That went as low as an average of only 0.9% of negotiating room in 2004-2005, before rising quickly to current market conditions where the average negotiations are 5.3% of the list price. 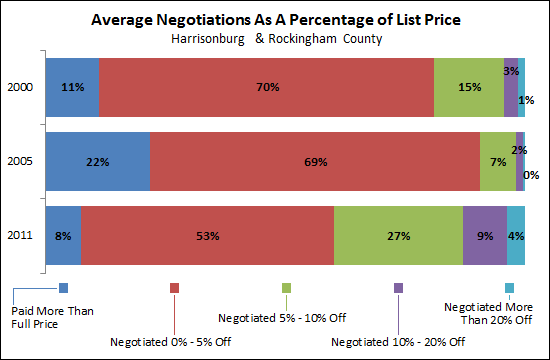 If we look closer at the data pre-boom (c2000), mid-boom (c2005) and post-boom (c2011) we find some interesting facts:
| |
Attached vs. detached homes over the past 11 years |
|
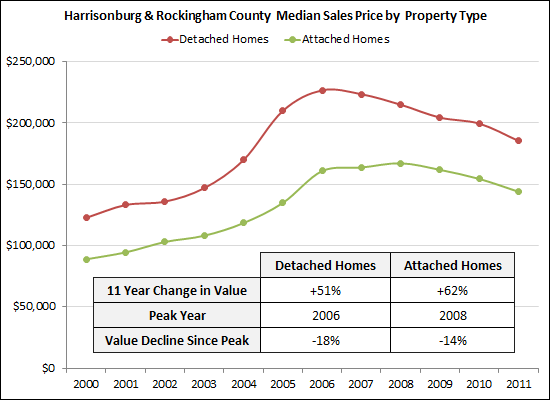 Detached home = single family home Attached home = duplex, townhouse, condominium So, which property type has shown a stronger performance over the past 11 years in Harrisonburg and Rockingham County?
But despite all of this, I believe the detached home market will be a stronger performer over the next five years, because:
| |
Was 2011 "the new normal" for the pace of home sales in Harrisonburg and Rockingham County? |
|
In 2000, there were 829 home sales. That zoomed up to 1,669 in 2005. This past year (2011) there were 791 home sales. Certainly, 1,669 home sales a year is not a normal pace of home sales, but is 791 home sales per year a reasonable assumption for the pace of our local housing market going forward? To explore this issue, I have created a model showing what home sales would have been if a constant percentage of our local population bought a home each year, and I have included population increases from the past decade. 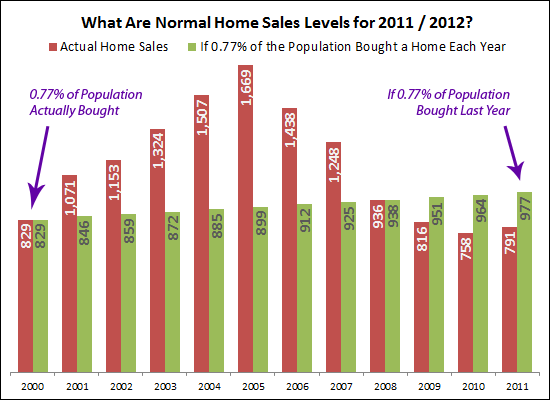 Above you'll note that in 2000, a total of 0.77% of the population purchased a home (829). Then, for each following year, I have shown how many people would have bought a home if it continued to be 0.77% of the total population. Per these calculations, home sales in 2011 (though improved over 2010) are still well below where they (theoretically) should be. If 0.77% of the population bought in 2011, home sales would have been 23% higher than they were last year. 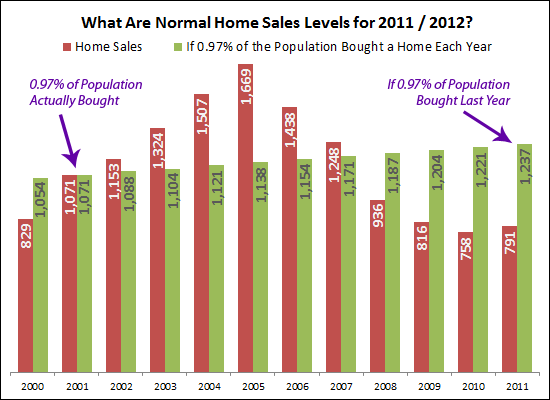 Above is a second illustration, assuming that 2011 was a normal year -- and that each year we should expect 0.97% of the population to buy a home. In this scenario, home sales should have been 56% higher last year to have 0.97% of the population buy a home. Regardless of the actual numbers, my conclusion based on the data above is that 791 home sales per year (as in 2011) is not the new normal for our market. I believe the market will improve further as to the annual pace of home sales -- at least to 1,000 sales per year. | |
The impact of distressed sales (bank owned, short sales) on the Harrisonburg, Rockingham County housing market |
|
Housing markets across the country have been affected by an increase in distressed sales over the past few years -- both bank owned homes (that were foreclosed on) and short sales (where the sales price didn't pay off the mortgage). So, what was the impact in our local area? 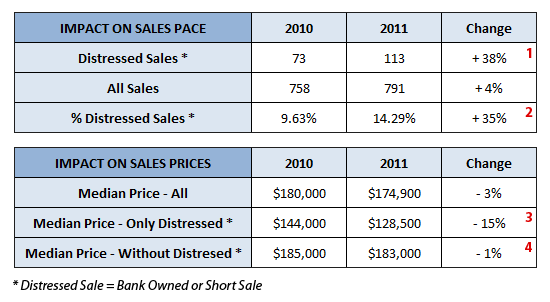 A few observations based on the data above....
Again, given the decline in foreclosures in 2011, I am hopeful that we'll see a smaller number of distressed sales in 2012, leading to greater stability in our local housing market. | |
Sellers, sellers, where have you gone? |
|
As I commented in my monthly market report earlier this week, inventory has declined significantly (15%) over the past year! 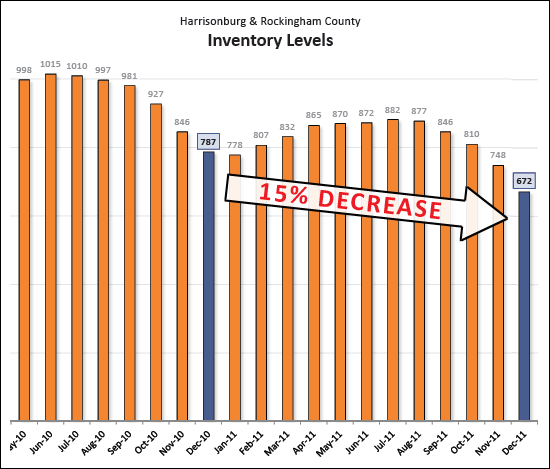 Why is inventory dropping so much??? I have a theory.... First and foremost, I believe there are quite a few homeowners who are deciding to lease their properties instead of selling them, after having had little success in the sales arena. I have seen this quite frequently over the past 6 months, and it makes sense --- leasing the property can provide a stream of income with which to pay the mortgage payment. Leasing a property also gets the homeowner down the road a bit (perhaps a year or two) after which they can try to sell again in a market this has hopefully improved. Second, I believe some sellers are either pulling their property off the market, or never putting them on the market, because they don't believe they can sell their home right now for a price that would either: a) make them happy, b) payoff their mortgage, or c) allow them to move into their next home. Finally, after six years of steady increases in foreclosures in our local market, that trend finally reversed itself in 2011. There were 17% fewer foreclosures in 2011 as compared to 2010 -- which means there are fewer bank owned homes coming on the market. We'll have to wait a few months to see, but I think it's quite possible we'll continue to see much lower inventory levels than we saw last year. | |
Land sales increase, in pace AND price! |
|
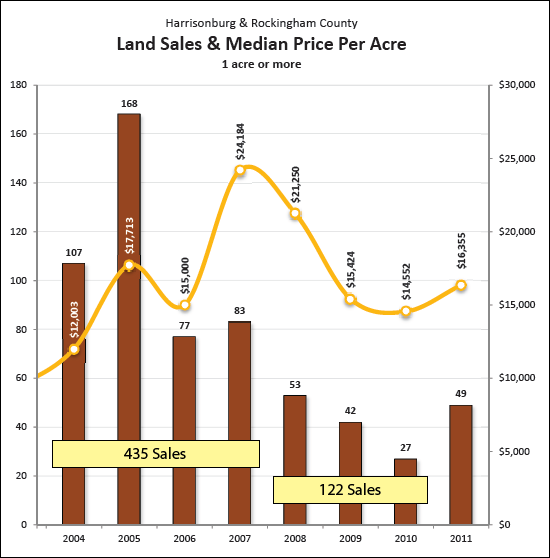 The housing market as a whole in Harrisonburg and Rockingham County seems to be stabilizing. As per my market report earlier this week, sales increased by 4% in 2011, even though prices declined by 3%. Land sales, however, are looking even better! There is quite a bit of information packed into the graph above, but here are the main things I think are important to note:
| |
2011 Summary: Stability is returning to the Harrisonburg, Rockingham County housing market |
|
Friends and Colleagues --- Our local housing market has finally done it -- after a five year slide (and a 55% drop) in the pace of home sales, the tide has finally turned in 2011. Our local real estate market showed a 4% improvement in the pace of home sales last year, even though the median sales price declined another 3%. Jump to the PDF of my monthly market report, or keep reading for an overview. Speeding through the finish line.... 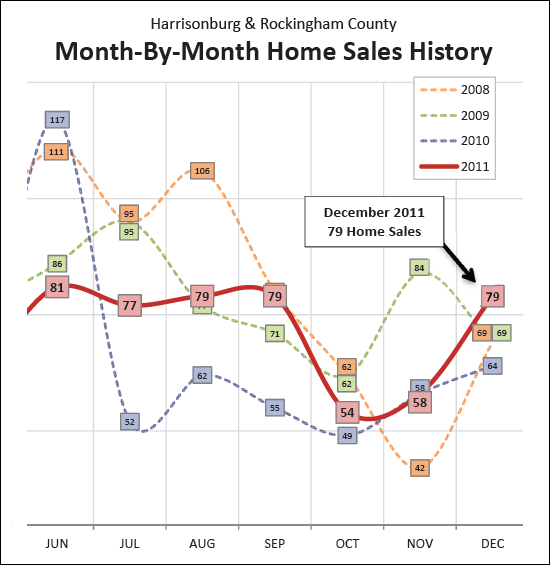 The local housing market didn't slow down for the close of 2011 -- it poured on the gas to accelerate through the finish line with a strong month of 79 home sales in December. This was the strongest December in at least four years. October and November could have had us worried, with sales in the 50's, but apparently the market was holding back to create an exciting photo finish in December. The Great Reversal.... 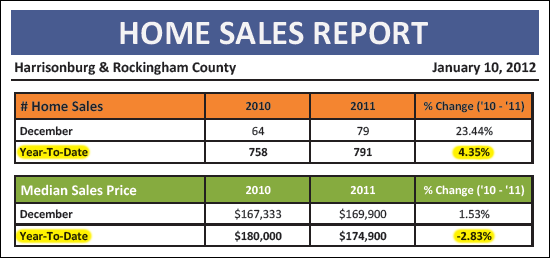 After five years of seeing fewer and fewer home sales in our local area (from 1669 in 2005 down to 758 in 2010) we finally experienced an increase in buyer activity during 2011 -- with 791 home sales. This marks a 4% improvement in the pace of home sales. The not-quite-as-exciting news, of course, is that the median sales price declined another 2.83% over the past year. But certainly, we needed to see this stability (and now growth) in sales pace before we could reasonably expect to see stability in sales prices. Hello Buyers, Good Bye Sellers....  For the past few years, there have been too many sellers in the market, and too few buyers. 2011, however, has told a different story -- one of returning stability. Not only did home sales increase 4% in 2011, but inventory levels declined 15%. While we still have a ways to go, both of these trends are headed in the direction of increased stability in our local real estate market. We Won't Miss You Mr. Foreclosure.... 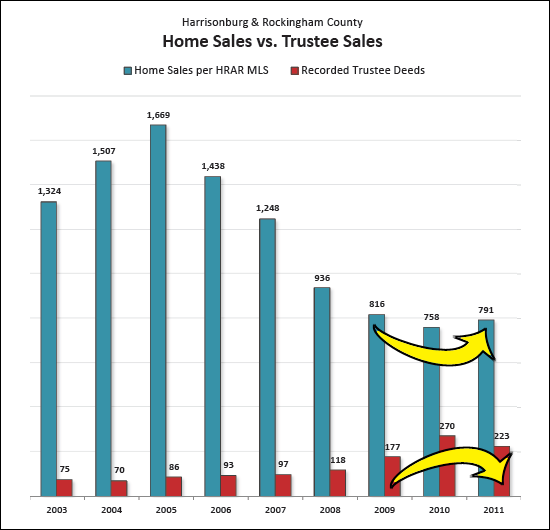 Foreclosures (and then bank owned homes) have dragged housing markets down across the country. Thankfully, not only did home sales increase this year in our local market (blue bars above), but foreclosures also declined (red bars above). This 17% decline in foreclosures during 2011 shows promise for fewer bank owned homes, and greater market stability in 2012. What else would help? Lower interest rates? Lower unemployment rates? 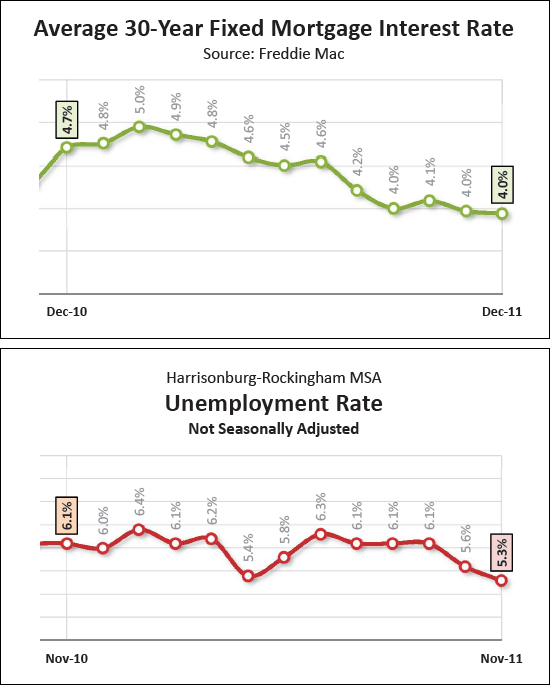 The stage is set for further stability in our local housing market during 2012 -- mortgage interest rates are at historic lows (below 4%) and our local unemployment rate is at its lowest level in over two years. Looking Forward After a 2005 peak, and a 2010 valley, 2011 brought a long awaited step towards stability in our local housing market as sales began to increase again. The pace of home sales is likely to increase even further in 2012, and we just might start to see some stability in median prices --- if not in 2012, then I would imagine we would certainly see that in 2013. For a more detailed look at the Harrisonburg and Rockingham County real estate market, download my full market report as a PDF. And -- if you have questions about the local housing market, or if I can be of assistance to you with real estate that you own, or that you'd like to own, please be in touch. You can reach me most easily at 540-578-0102 or scott@HarrisonburgHousingToday.com. | |
Predictions for 2012 in the Harrisonburg and Rockingham County Real Estate Market |
|
One of the best indicators in our local housing market is the pace of single family home sales. Townhouses and duplexes are sometimes bought by investors, and thus if we include those sales, we aren't getting the best picture of the pace at which homeowners are purchasing homes. Given that single family (detached) homes are a good indicator for the market, I made a prediction in January 2011 as to what would happen in our local real estate market this past year. Let's revisit those predictions for 2011.... 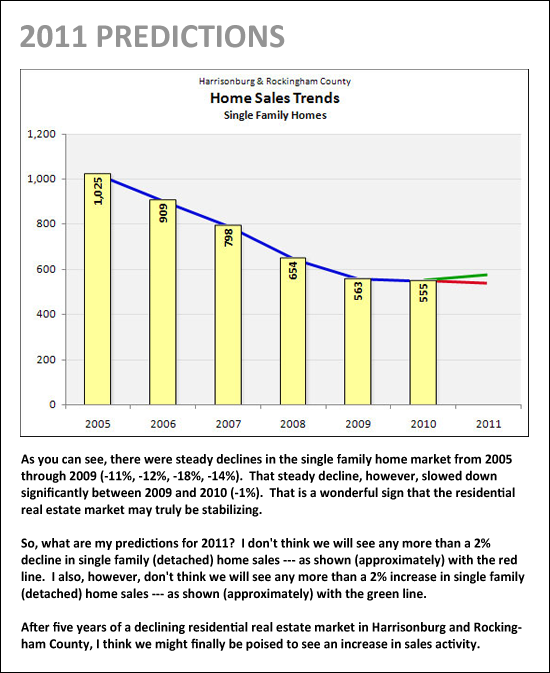 So, how did I do? I estimated that the sales pace of single family homes would stay within 2% of the 2010 pace of home sales. Either a 2% increase in sales, a 2% decrease in sales, or somewhere in between. Drum roll, please.....After 555 single family home sales in 2010, there were......618 single family home sales in 2011 -- an 11% increase!!!! Wow, was I wrong! 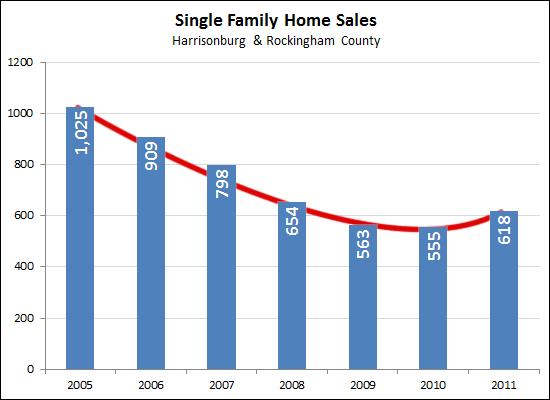 Please note that the 618 sales in 2011 might actually increase a bit further -- I'll publish my full market report in another week which will include final stats. So, now for predictions for 2012. It's actually a bit more difficult this year. After an 11% increase in single family home sales during 2011 --- it's hard to be conservative in my estimates. Before seeing these figures, I would have estimated we'd see a 2% to 5% increase in single family home sales in 2012. But given that 2011 showed a whopping 11% increase in sales pace, I think I'll have to predict that we'll see a 5% to 10% increase in 2012. That would put us somewhere between 649 and 680 sales in 2012 -- which is on pace with 2008. As always, let me know if you agree or disagree. I value your input as well. | |
Why am I cautiously optimistic about the future of our local housing market? |
|
You don't need to tell me --- I know --- home prices are still on the decline. But here is the basis for my cautious optimism about our local housing market.... 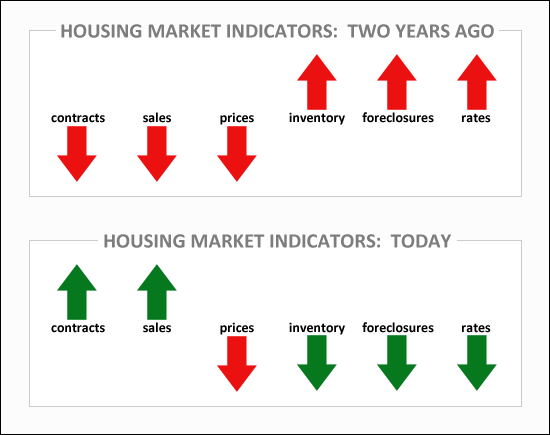 This illustrates the trends in general housing market indicators two years ago, as compared to the trends in general housing market indicators today. What do you think? Do I have some basis in reality for my cautious optimism? | |
Online shopping increases 15%, but wait --- contracts on homes in our local area increase 100%! |
|
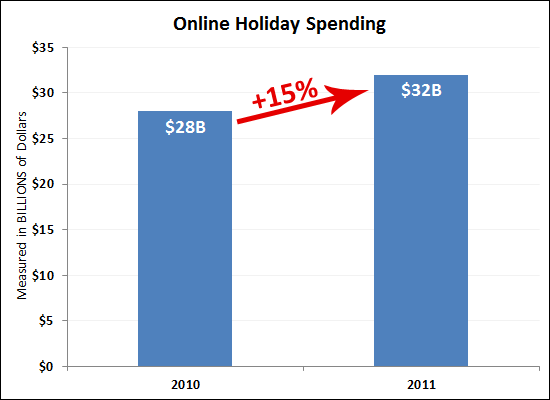 The significant increase in online holiday shopping is certainly an indicator that are economy may be finally starting to return to some form of normalcy. 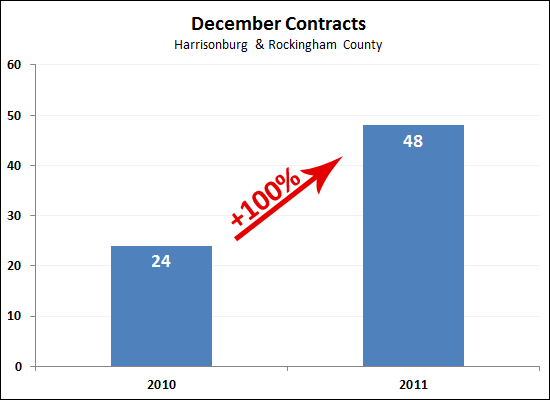 But did you see what happened in our local housing market? There was a 100% increase in December contracts (Dec 1 - 25) in the Harrisonburg and Rockingham County housing market! This continues the trend of increased activity in our local real estate market. 2011 looks like it will finish out to be a strong year -- or even if a weak year, a stronger weak year than last year! | |
Nation's housing market was much worse than suspected over the past four years |
|
As Business Insider puts it, the National Association of Realtors just made the mother of all data corrections. Basically, the National Association of Realtors (NAR) retroactively adjusted its accounting of the number of home sales that took place in 2007 (down 11%), 2008 (down 16%), 2009 (down 15%) and 2010 (down 15%). Put simply, NAR had thought and had broadcasted quite widely that home sales were much stronger over the past four years than they really were -- and bear in mind, even the inaccurate, inflated numbers were quite depressing! Why did it happen?
It sort of matters retroactively -- everybody needs to go back and think that the housing market was worse than they thought before, and make their past decisions differently. Oh wait, that's somewhat difficult to do -- so the national impact is simply that we need to readjust our historical understanding of the pace of home sales from 2007-2010 and be a bit less dependent on NAR home sales estimates, as they are ultimately, just estimates. Does it matter locally? Since the national housing market (if one could be said to exist) doesn't impact us too much at all, these adjustments to national housing sales figures don't impact us that much either. Of much more importance is the pace of sales (and median price of those sales) on a local level. Could it happen locally? NAR and yours truly make different attempts as far as reporting home sales. NAR attempts to report on total home sales (MLS, by owner, by builder, etc) -- and thus there can be inaccuracies in their data. My home sales reporting is based solely on data reported through the HRAR MLS. Thus, I'm not making any guesses -- I'm just performing analysis and providing commentary on home sales reported through our local MLS. NAR's adjustments are rather significant, so let me know if you any questions or concerns beyond those addressed above. | |
Do home values go up and down with the temperature? |
|
Are houses worth more in the summer and less in the winter? I have always mostly ignored that question because median home values bounce all over the place front month to month in Harrisonburg and Rockingham County. 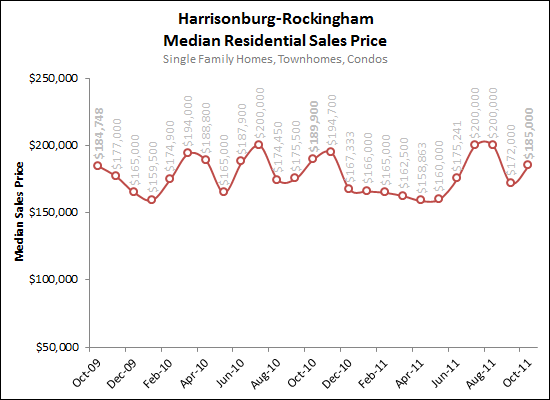 It's certainly hard to draw any conclusions about seasonal (summer vs. winter) changes in home values based on the data above. The related question here is whether home values really jump around as much as shown above -- no, they don't -- with only 50-100 home sales per month the sample size of the data set is small enough to allow for the variation shown above. Basically, the median home value might end up adjusting quite a bit in one direction or the other in any given month because of the composition of how many smaller homes versus larger homes sold in any given month. But then when I examine the entire state of Virginia, values do seem to adjust seasonally.... 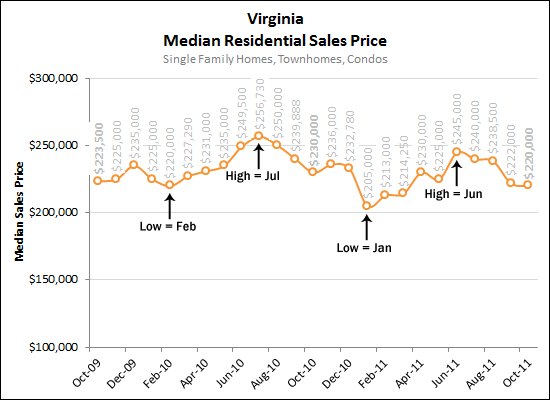 So -- does anyone have any theories here? Why do Virginia home values seem to adjust so seasonally (as per median prices) but Harrisonburg and Rockingham County do not? | |
Local housing market shows continued signs of gradual recovery |
|
 Click here to download my full market report (27 pages, 7 MB, PDF) or read on for highlights.... 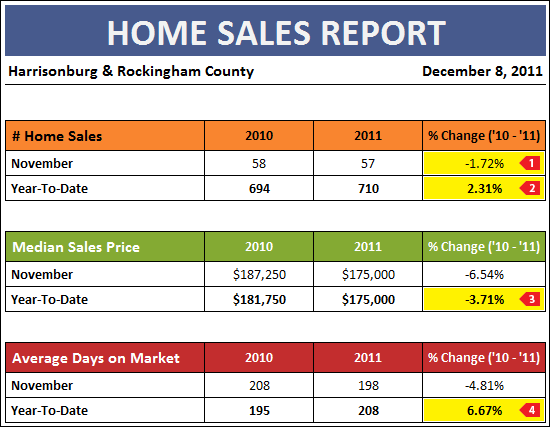 November was a relatively positive month for the local housing market:
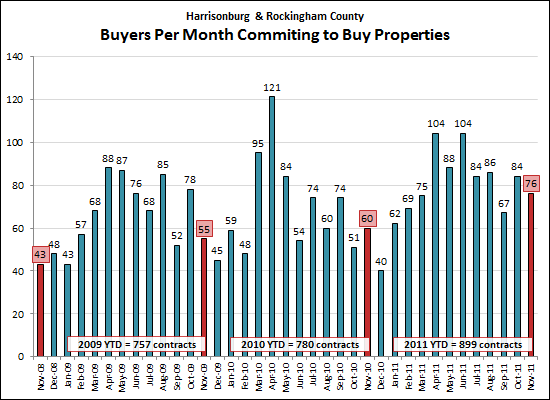 A strong surge of buyers in 2011 is leading the charge towards more stability in the local housing market. As shown above, November 2011 was yet another strong month of contracts (76) showing a 27% increase over last November and a startling 77% increase over three Novembers ago. 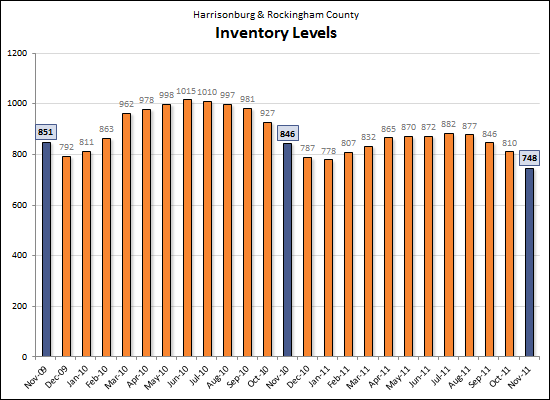 Inventory levels continue to significantly decline, down 12% from a year ago. Lower inventory levels (fewer sellers) combined with an increase in contracts (more buyers) will eventually lead to greater balance in the local housing market. 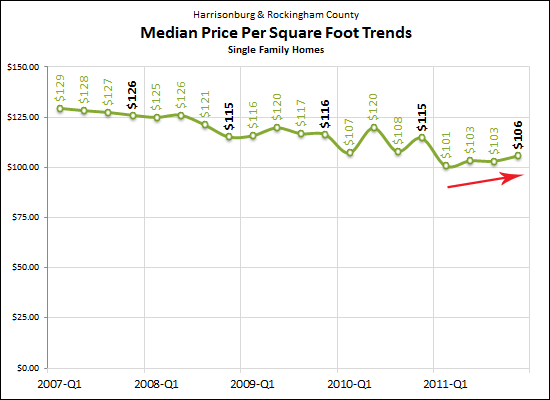 Despite the fact that our local housing market's median price has not yet stabilized, it is interesting to note that we have seen a steady improvement in median price per square foot for single family homes over the past year. This is in sharp contrast to the steady decline seen in the four prior years. 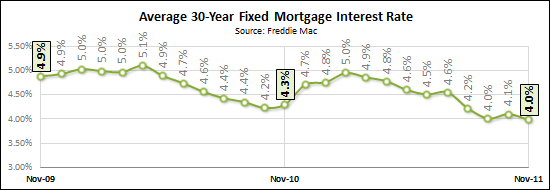 The icing on the cake is that mortgage interest rates remain at historically low levels creating amazing opportunities for buyers. At the end of November, the average 30-Year fixed mortgage interest rate was 3.98%.  For an even more in-depth look at the Harrisonburg and Rockingham County real estate market, click the image above to download my full market report (27 pages, 7MB, PDF). If you have questions about the report, or if I can be of assistance to you with real estate that you own, or that you'd like to own, please be in touch. You can reach me most easily at 540-578-0102 or scott@HarrisonburgHousingToday.com. | |
Inventory levels drop to 45 month low (at least) |
|
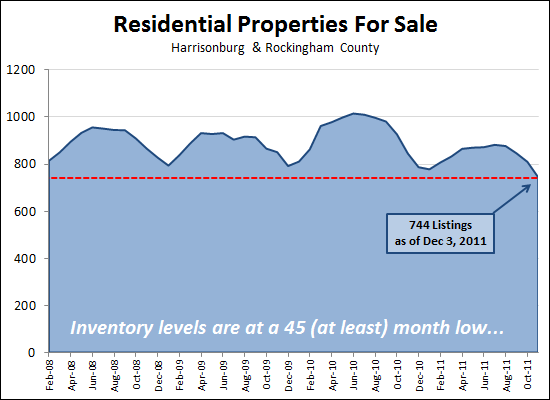 Each month inventory levels drop at the beginning of the month -- as quite a few listings expired on the last day of the prior month. So it's possible that today's incredibly low inventory levels (744 properties) will climb back up by a bit over the next few days. However, as things stand now, these are the lowest inventory levels we've seen in almost four years. It's actually probably quite a few more months than that, but I have only been tracking inventory levels for the past 45 months. What does this mean? Hope for further balance in the local housing market -- as the number of hopeful seller decreases, and the number of actual buyers increases, we'll return to a more balance market. | |
Budget 34% less for your housing costs at Taylor Spring |
|
 Yesterday I pointed out that monthly housing costs have declined 28% since 2007 because of modest declines in median sales prices and significant declines in average mortgage interest rates. But let's make it a bit more specific.... The first townhouse pictured above was sold in 2007 for just $100 more than the median sales price at the time, and your monthly housing cost would have been $1,096 if you financed 80% of the purchase price at the average interest rate of 6.21%. The second townhouse pictured above is for sale now for only $159,200, and would require a monthly housing cost of only $719 -- again, assuming you financed 80% of the purchase price at today's average interest rate of 3.99%. This is quite a dramatic difference (-34%) in housings costs, and hopefully helps to illustrate the wonderful opportunities for buyers in today's market! | |
Monthly housing costs down 28% from 2007 peak |
|
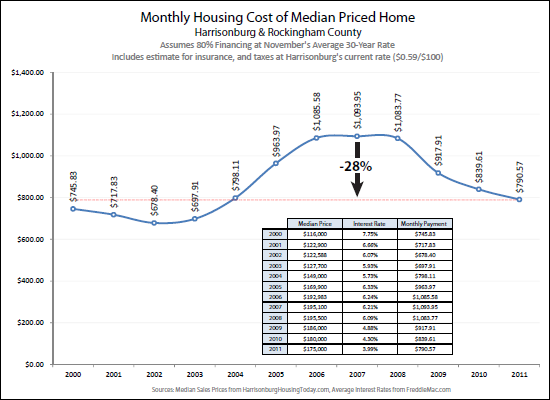 How much does it cost on a monthly basis to buy the median price home in our area, assuming 80% financing? Today, that adds up to a $791 monthly payment. That marks a dramatic 28% decline since 2007 when the monthly payment would have been $1,094. The decline in median sales prices over the last few years (from $195K to $175K) combined with the decline in interest rates (from 6.2% to 3.9%) has brought average monthly housing payments down to very affordable levels. Again, the graph above (click here for a more legible PDF) shows the mortgage payment including principal, interest, taxes and insurance (PITI) assuming 80% financing at November's average 30-year interest rate, and assuming Harrisonburg's real estate tax rate ($0.59 per $100). | |
Virginia's median sales prices relatively stable |
|
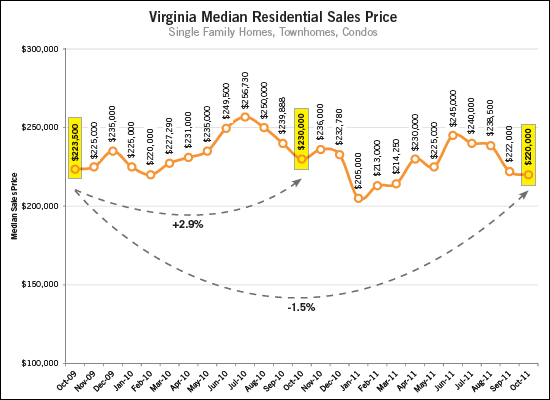 Certainly, all real estate is local, but it is often insightful to see what is happening on the state level as well. As you'll note above, there hasn't been much of a shift in Virginia's median sales price, aside from seasonal changes. It's interesting to note that we don't see those same seasonal swings in our median sales price. Download the full October 2011 Virginia Home Sales Report (click here) which highlights:
| |
Blog Reader in Sept 2009: Housing Prices Will Fall 30% From Current Levels |
|
I always encourage (and enjoy) healthy skepticism about anything related to the state of the local housing market. If you think I'm off base with my analysis or predictions, let me know! Revisiting some old exchanges with a reader of my blog, I find the excerpt below, from September 2009 (just over two years ago). This is just an excerpt of a longer exchange, but provides some interesting historical context.... On the other hand, Rockingham County real estate, while not "bubbling" quite like South Florida, California, and Arizona, is still outrageously overpriced. And, unfortunately, the area has yet to start correcting in any meaningful way. As my analyses have shown, the media house price to median family income ratio is still around 4 for this area (190k median house to ~50k median household income) – and the historic norm is closer to 2.5. This ratio will come back in line, which means a 30% + decrease in housing prices from current levels. Supporting this argument is the glut of houses on the market: there's over a 13 month supply of homes (and over 24 months supply in certain sectors). That's way too high. The law of supply and demand has to kick in sometime doesn't it? So, were these predictions true? Did prices fall 30% from the levels seen in September 2009?
So despite only a very small change in the oversupply of housing, we still have not seen very much of an adjustment in sales prices. Furthermore, if you believe my current predictions, we might finally be seeing a turning of the real estate market, as evidenced by:
OK -- now I'm ready for it. Tell me your predictions for the next few years in our local housing market. Feel free to comment below, or just shoot me an e-mail (scott@HarrisonburgHousingToday.com). Perhaps I'll hold onto your comments and reflect back on them two years from now! | |
| Newer Posts | Older Posts |
Scott Rogers
Funkhouser Real
Estate Group
540-578-0102
scott@funkhousergroup.com
Licensed in the
Commonwealth of Virginia
Home Search
Housing Market Report
Harrisonburg Townhouses
Walk Through This Home
Investment Properties
Harrisonburg Foreclosures
Property Transfers
New Listings

