| Newer Posts | Older Posts |
If you bought during X your house is likely worth Y today |
|
 The chart above is calculated based on comparing this year's median sales price to the median sales price in each of the prior eleven years. Several key points to take away from this chart....
| |
Was the federal home buyer tax credit worthwhile? |
|
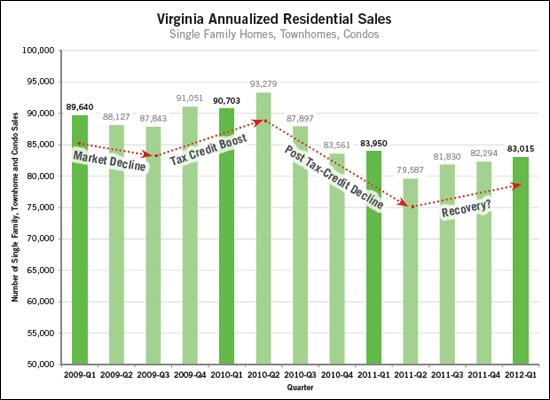 I suppose it was helpful from a very short-term perspective --- it gave the market a boost between 2009-Q3 and 2010-Q2. But those artificially elevated sales levels didn't last -- sales declined to even lower levels after the tax credit than where they had been before it. Thankfully, the last year has shown steady growth in the number of home sales in Virginia, without the assistance of the tax credit. | |
National Association of Home Builders Remains Optimistic About Housing Recovery |
|
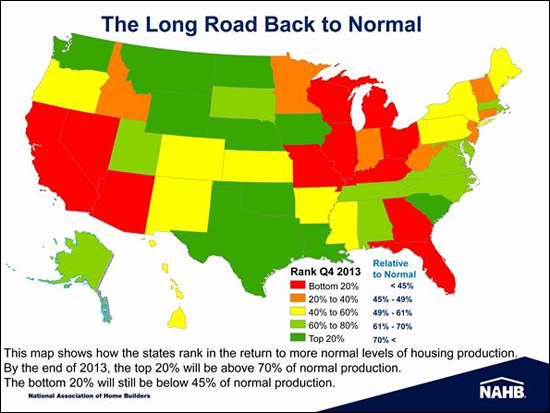 "In its latest construction forecast, the NAHB on Wednesday stuck to its guns that "underlying fundamentals" such as low mortgage rates, decent economic growth, and pent-up demand for housing will drive double-digit percentage increases in home starts this year and next, and reverse catastrophic declines in new and existing home sales." Read the entire story at Builder Online. | |
Housing markets are improving all across Virginia! |
|
From the Virginia Association of Realtors, Pace and price of home sales increase in Virginia during Q1 2012. Read on.... The First Quarter 2012 Virginia Home Sales Report has been released and brings good news for the Commonwealth! Several long-term trends indicate that Virginia's housing market is continuing to stabilize. 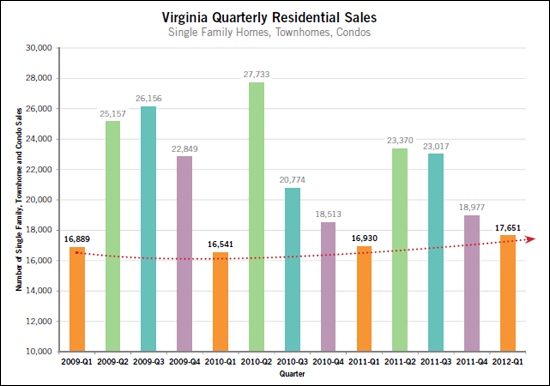 As shown above, the pace of home sales in the first quarter of 2012 marked an improvement over both the first quarter of 2011 and 2010. 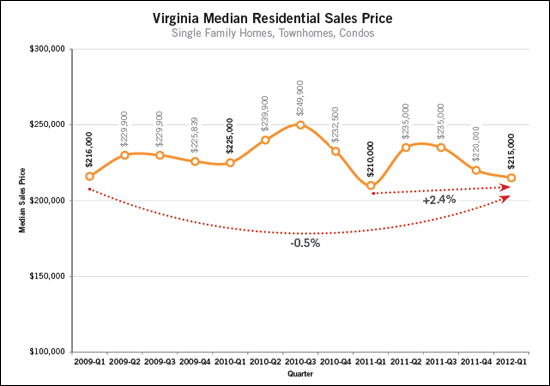 The median residential sales price has increased 2.4% in Virginia over the past year despite a slight (-0.5%) decline over a three-year time period. Download the full First Quarter 2012 Virginia Home Sales Report to find out more about how different regions in Virginia fared in the first quarter of 2012. | |
Fooled by a narrow scope? |
|
Thanks a lot Dustin, now things are even more confusing. 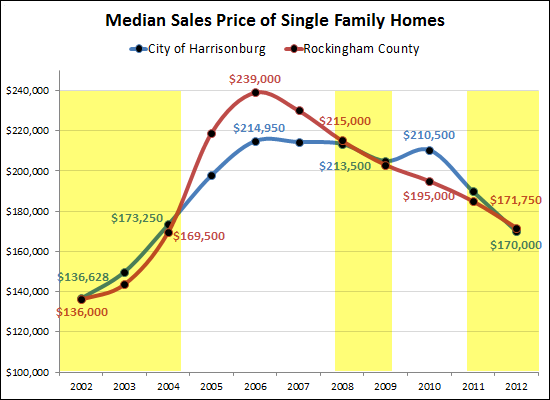 So, Dustin suggested that I examine data prior to 2008 to see if we could learn more about why single family home values surged in the City of Harrisonburg in 2010. Well, as you can see above, we may have been fooled by looking just at 2008-2012 data. I have highlighted (in yellow) the time frames when the City and County median prices were relatively similar. Now you'll note that there were two surges in values --- City values surged ahead in 2010 (and then stepped back into line) --- but before that, County values surged head in 2005-2007 before stepping back into line. What explains it? Gas prices? Home buyer tax credits? | |
Caffeine-inspired readers solve mystery of Harrisonburg's temporary surge in single family homes values |
|
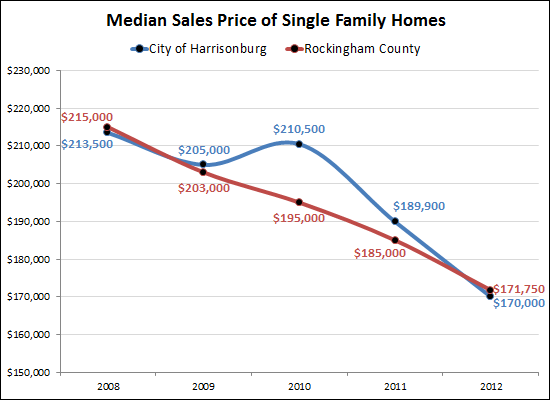 Wow, there were a lot of great proposed explanations for why Harrisonburg single family homes saw an increase in value (median sales price) between 2009 and 2012. Thanks to all for your comments and perspectives, most of which surfaced via Facebook. Here is a re-cap of your perspectives:
Thank you all for your perspectives, and for engaging in some thoughtful debate as to why single family homes performed better in Harrisonburg than in Rockingham County between 2009 and 2012. As to the Starbucks reward for fantastic insights, I'm calling it a tie between Brett and Karl. I'll be in touch to get each of you a Starbucks gift card. Stay tuned for the next time I get stuck figuring out the WHY of some of our local housing market data. | |
Explain this to win a $10 Starbucks gift card: Why did single family home values diverge in Harrisonburg, Rockingham County between 2009 and 2012? |
|
I'll give a $10 Starbucks gift card to the person who can provide the correct explanation of the graph below. OK, I'll be fair, I don't know what the correct answer is. :) So, I'll give the gift card to the most believable answer. Leave your answer as a comment below, or e-mail me (scott@HarrisonburgHousingToday.com).  | |
Real Estate Tax Analysis in Harrisonburg and Rockingham County |
|
The City of Harrisonburg is considering increasing the real estate tax rate from $0.59 per $100 of assessed value to $0.63 per $100 of assessed value. Rockingham County is also considering a $0.04 increase, from its current tax rate of $0.60 per $100 of assessed value to $0.64 per $100 of assessed value. To understand the potential rationale behind such an increase, let's examine funding levels given a few assumptions to make the math a bit easier. First, we will assume that all tax assessments are at exactly 100% of the market value of properties. Second, we will assume that both Harrisonburg and Rockingham County are comprised of 1,000 privately owned homes. Third, we will assume that all homes have market values (and assessed values) of the median sales price.  As shown in the table above, the median sales price in the City of Harrisonburg declined 20% between 2008 and 2012 from $213,500 to $170,000. If the City of Harrisonburg were comprised of 1,000 median-priced homes, the tax base and thus the tax revenue would also decline by 20% from $1.26M to $1M. Even with the proposed $0.04 proposed increase in the tax rate (from $0.59 to $0.63) the tax revenue would still decline by 15% from $1.26M to $1.07M. In fact, the tax rate would need to increase to $0.74 (a 25% increase) in order to maintain the same tax revenue as in 2008 --- assuming that assessed values have tracked precisely with median sales prices.  As shown in the table above, the median sales price in Rockingham County declined 20% between 2008 and 2012 from $215,000 to $171,750. If Rockingham County were comprised of 1,000 median-priced homes, the tax base and thus the tax revenue would also decline by 20% from $1.29M to $1.03M. Even with the proposed $0.04 proposed increase in the tax rate (from $0.60 to $0.64) the tax revenue would still decline by 15% from $1.29M to $1.1M. In fact, the tax rate would need to increase to $0.75 (a 25% increase) in order to maintain the same tax revenue as in 2008 --- assuming that assessed values have tracked precisely with median sales prices. | |
Home Values compared to Tax Assessments in Rockingham County |
|
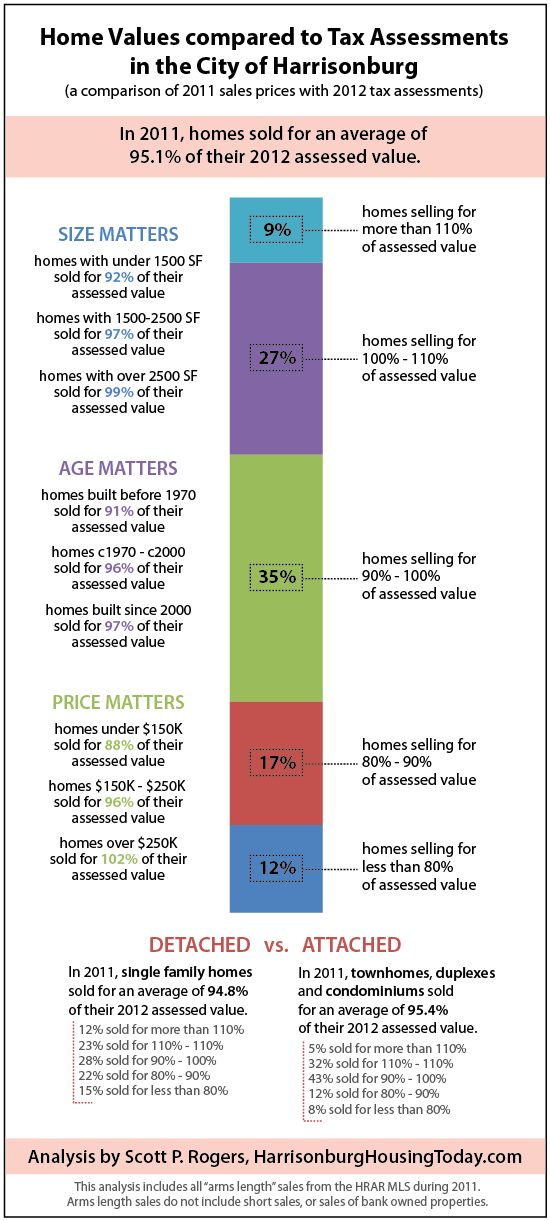
I'm asked quite frequently about the relationship between home values and tax assessments. After a lengthy analysis of the 528 home sales in Rockingham County during 2011, as recorded in the HRAR MLS, here is what I'm finding.... (click here for the same information for the City of Harrisonburg) 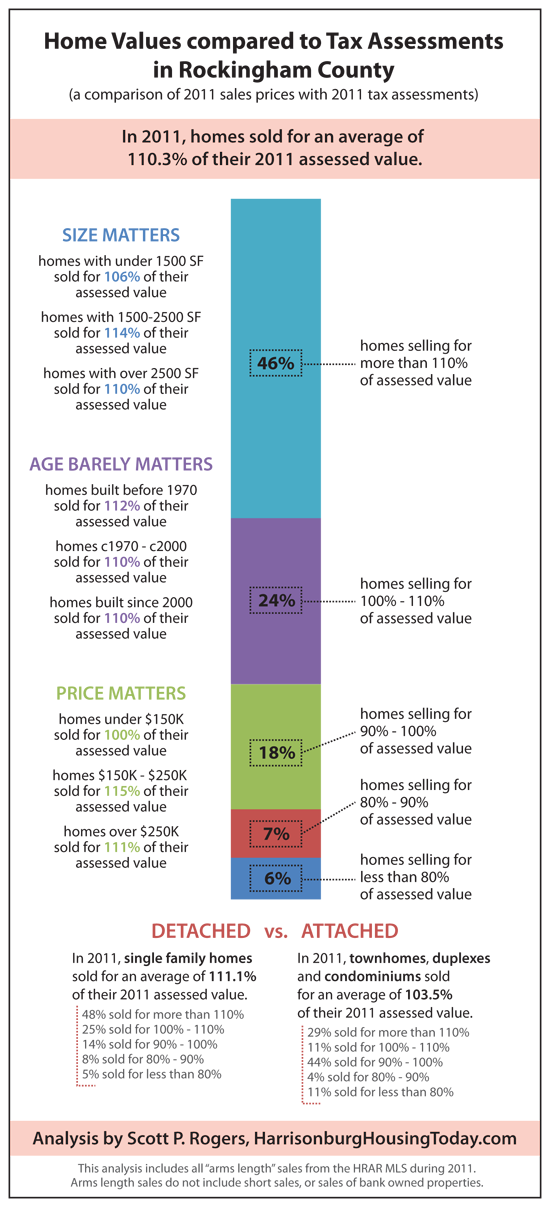 click the infographic above for a printable PDF version. The bottom line here is that County properties seem to be under-assessed by an average of 10%. Most buyers pay more than assessed value for the properties they purchase. | |
Home Values compared to Tax Assessments in the City of Harrisonburg |
|
Positive trends in the first quarter of 2012 |
|
Sales are up.... 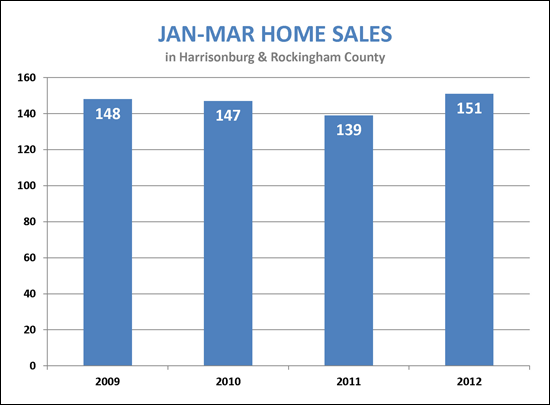 Prices are starting to stabilize.... 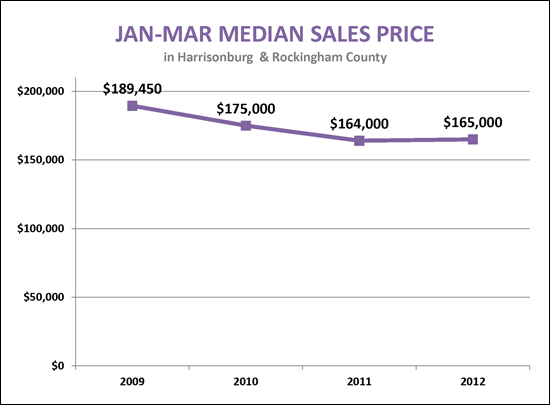 Inventory is down.... 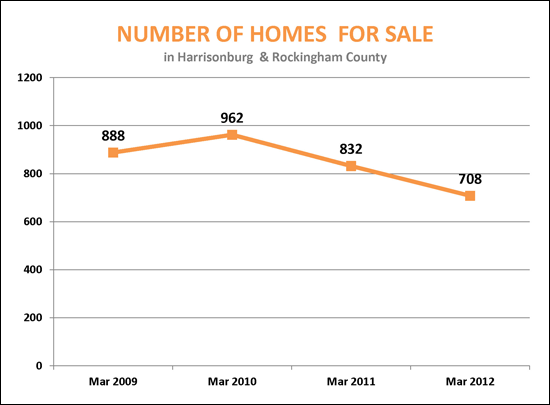 | |
March 2012 shows a SURGE of buyers in the market! |
|
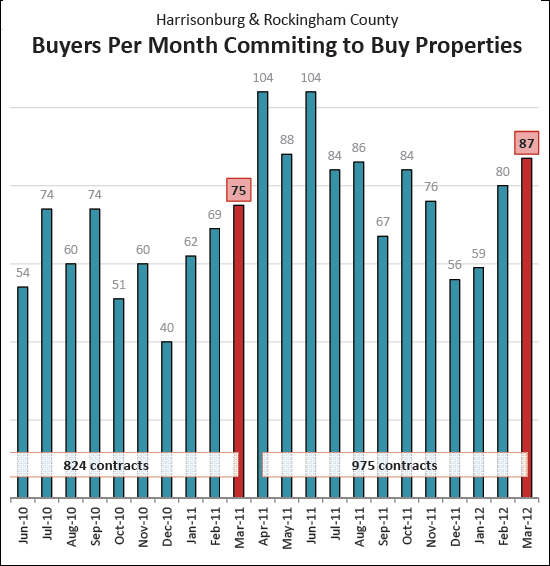 One factor that is helping our housing market to show continued signs of improvements (in the pace of sales) is that we continue to see strong levels of buyer activity in the form of contracts. Now, bear in mind, not all contracts result in closings -- but without a contract, closings rarely occur. ;) See above -- last month (March 2012) there were 87 contracts --- that is more than some of the summer months last year. We are likely due for a strong remainder of our spring housing market as well as a strong summer market based on the amount of buyers in the market these days. Of note -- even with Spring Break, and Easter, there have already been 28 contracts in the first 9 days of April. | |
Harrisonburg housing market shows continued signs of improvement in March 2012 |
|
Harrisonburg and Rockingham County home sales were at a four year high during March 2012, and for the entire first quarter of 2012. Click here to jump to the PDF of the full market report, or keep reading. 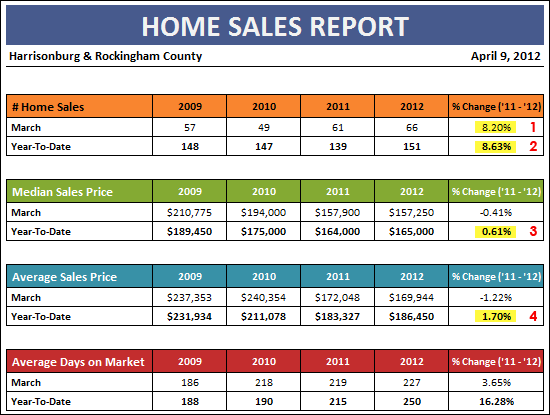 March continued the trend of positive indicators in our local housing market:
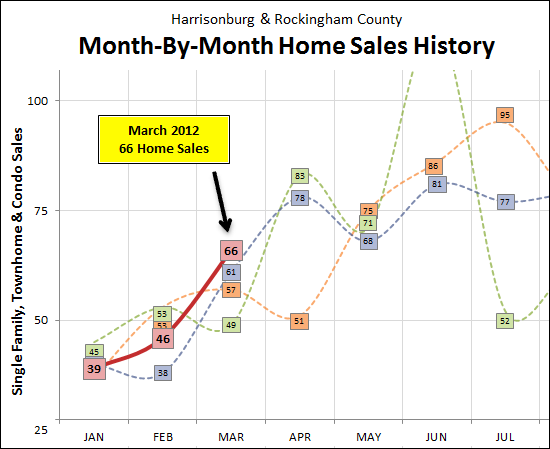 March 2012 was a fantastic month for home sales in Harrisonburg and Rockingham County, with 66 home sales closing -- the highest we have seen in the past four years. This sets the year up with a strong base as we move into the remainder of the spring and then summer market. 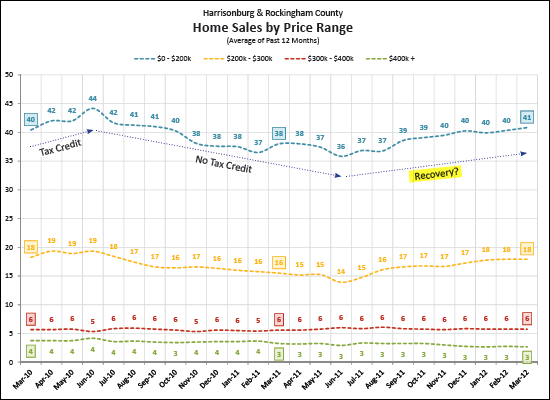 The pace of home sales certainly varies based on price range. The graph above shows the average number of home sales per month (given a 12-month average) as we have passed through the past two years. You'll note that the sale of homes for less than $200,000 increased through June 2010 and then declined for the next 12 months. This phenomenon is almost positively a result of the federal home buyer tax credit that encouraged these sales during 2009 and 2010. Of note, however, this segment of the market (under $200,000) has shown steady increases since June 2011, as has the $200,000 to $300,000 market. 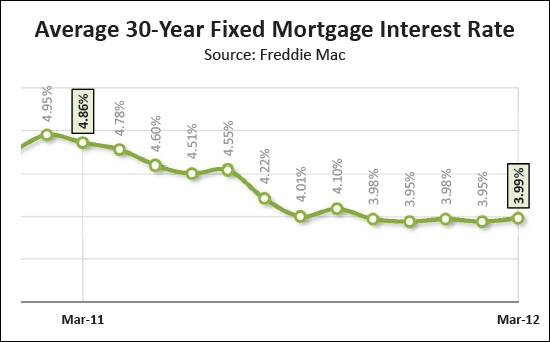 Home buyers continue to find amazingly low interest rates on 30-year fixed rate mortgages, with the current average rate of 3.99% continuing the five-month streak of staying below 4.0%. 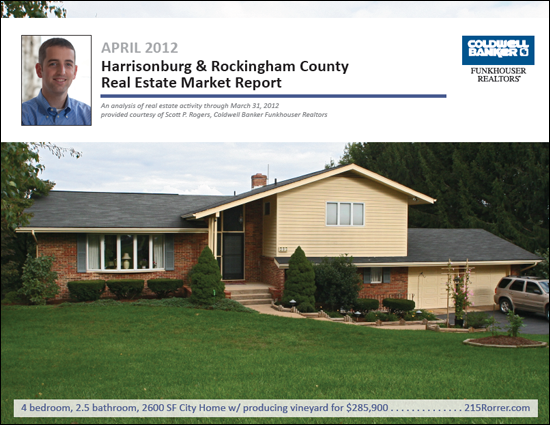 There is plenty more to read, analyze and understand. Click here (or on the market report cover above) to download my full monthly market report. And -- if you have questions about the local housing market, or if I can be of assistance to you with real estate that you own, or that you'd like to own, please be in touch. You can reach me most easily at 540-578-0102 or scott@HarrisonburgHousingToday.com. | |
Virginia home sales surge ahead (+9%) in February 2012 |
|
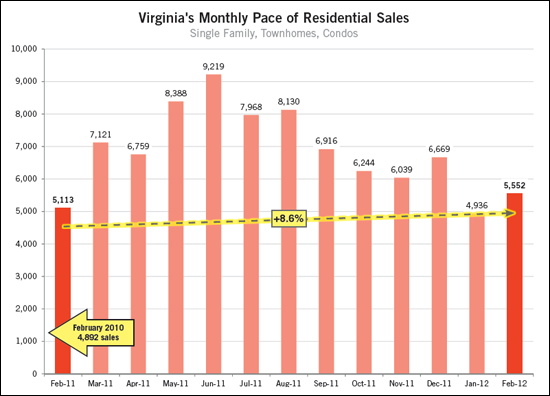
In another sign of potential stabilization of the housing market in Virginia, home sales rose 8.6% in February 2012 as compared to one year prior. This strong increase is after a 2.7% year-over-year increase in January 2012. Virginia's unemployment rate of 5.8% in January is the lowest level seen since December 2008 and provides a strong climate for growth in the housing market. Download the full February 2012 Virginia Home Sales Report below which also highlights:
| |
Is an improving housing market good news for everyone? |
|
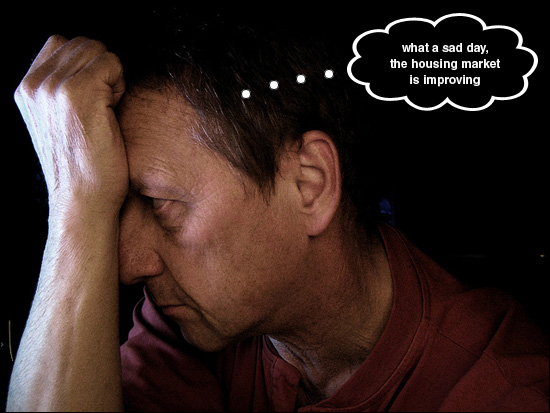 photo source: erix The local housing market is improving (sales up, prices up) but as someone pointed out to me earlier this week, that's not necessarily good news for everyone. But I do think it's good news for just about everyone. Certainly, it's good news for sellers -- they're now more likely to be able to sell, and don't have to worry (as much) about their home losing even more value before they sell. Certainly, it's good news for homeowners -- the value of their home now seems to be stabilizing. It's mixed news for near-term buyers -- it might mean that there are fewer deals to be had in the coming months, but since they're buying soon they can console themselves with the realization that their newly purchased property is not likely to continue to decline in value after their purchase. It is bad news for far-future buyers -- if you're not buying for a few years, it is understandable (sort of) that you'd like the market to get worse, so that you would have better buying opportunities. So, what about you? Are you glad the housing market is improving? | |
Home sales and median prices on the rise in Harrisonburg, Rockingham County |
|
Good news! With two months of 2012 under our belts, our local housing market is showing signs of continued stability and growth. Click here to jump to the PDF of the full market report, or keep reading. 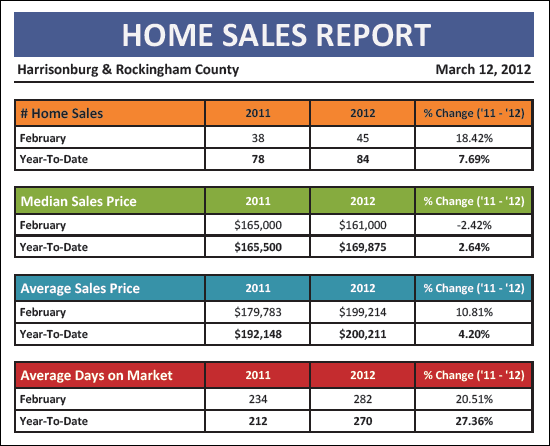 As shown above, the pace of YTD home sales has increased 8% from 78 home sales (Jan-Feb 2011) to 84 home sales (Jan-Feb 2012). Furthermore, the YTD median sales price has increased 3%, and the average sales price has increased by 4%. After quite a few years of seeing declines in median and average sales prices, this is a welcome change!. The time it takes to sell a home, however, is still on the rise --- showing a 27% YTD increase. 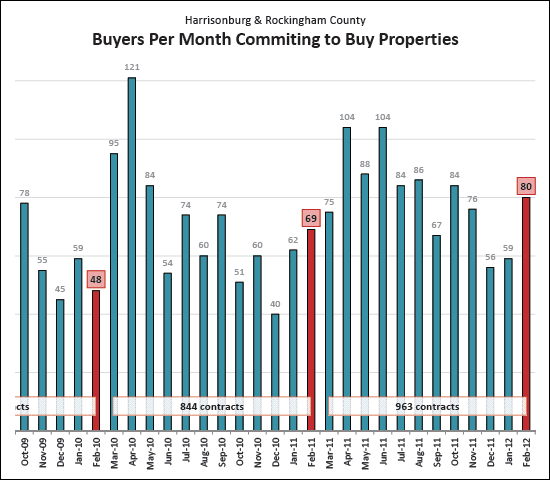 February 2012 was another strong month of buyer activity, with 80 buyers signing contracts to buy homes. This marks a significant 16% increase over last February -- and even comes close to the summer months of 2011. 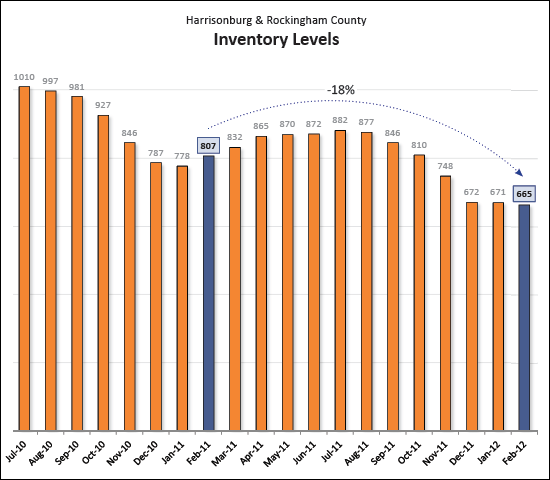 Remarkably, even now through the beginning of March, there are fewer and fewer homes for buyers to select from in our local market. Inventory levels have dropped 18% over the past year --- from 807 homes down to 665 homes. Typically we start to see an increase at this time of year, but I welcome these lower inventory levels, as it can help our market to continue to stabilize. 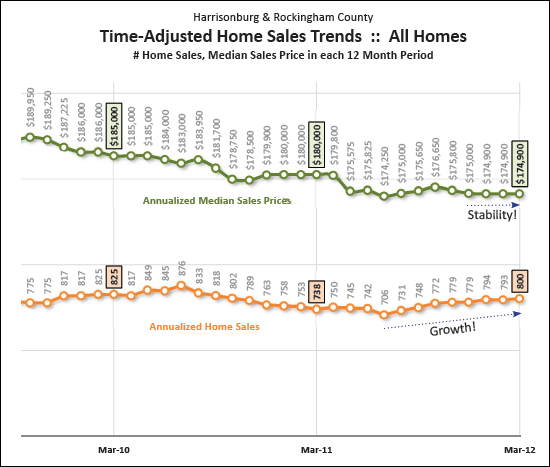 After many years of a declining pace of home sales, we have now seen a reversal in this trend over the past eight months as the annualized pace of sales has increased from 706 sales/year to 800 sales/year. This is welcome news, and likely contributes to the relative stability in annualized median sales prices that we have seen over the past four months.  There is plenty more to read, analyze and understand. Click here (or on the market report cover above) to download my full monthly market report. And -- if you have questions about the local housing market, or if I can be of assistance to you with real estate that you own, or that you'd like to own, please be in touch. You can reach me most easily at 540-578-0102 or scott@HarrisonburgHousingToday.com. | |
Punxsutawney Phil must have meant winter-like levels of housing inventory, not winter-like weather |
|
It sure doesn't seem that we're having six more weeks of winter weather. But we certainly ARE having (at least) six more weeks of winter-like levels of housing inventory. In fact, current inventory levels (664 homes) are lower than anytime in at least the past four years. Even in the coldest of months over the past four years, we have not seen inventory levels so low. Here's some perspective.... March 2008 = 814 homes for sale March 2009 = 838 homes for sale March 2010 = 863 homes for sale March 2011 = 807 homes for sale TODAY = 664 homes for sale OK, seriously, why the winter-like levels of housing inventory? Inventory levels fell below 700 for the first time in a long while back in December, and they are not yet showing any signs of recovering. | |
The past five years of foreclosures |
|
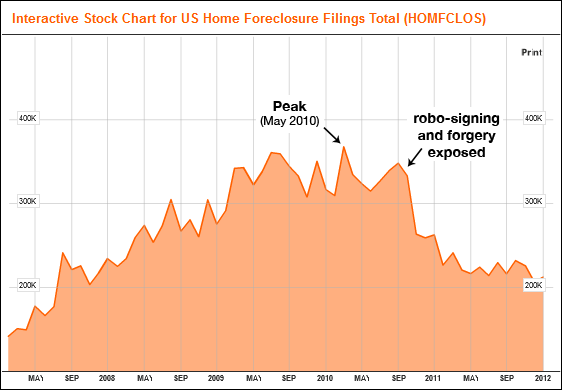 Bloomberg has an interactive tool that explores the number of foreclosure filings in the United States over the past five years. | |
2011 Virginia Housing Report |
|
 Last week, the Virginia Association of Realtors® released its 2011 Pieces of Home Housing Report including housing market data, trends, and comparisons. BIG PICTURE: Virginia homes sales in 2011 exceeded home sales levels in 2010 despite the lack of a stimulus. HOORAY FOR OUR LOCAL AREA: The Central Valley regions experienced the greatest increase in sales and the Northern Virginia region experienced the only decline. View the whole report by clicking here. | |
Contracts do not always result in closings |
|
 During 2010, buyers wrote 820 contracts --- and during the same year, only 758 closings took place. Why the difference? Technically, some of the 2010 closings are based on 2009 contracts....and some of the 2010 contracts will be 2011 closings. I don't suspect, however, that this timing issue significantly effected the relationship between the number of contracts and closings during 2010. Looking back, there were 47 closings during 2010 that were under contract at least twice. That closes the gap most of the way: 758 closings + 47 contracts that fell through (but then were contracted on again) = 805 closings. That leaves just 15 properties (with this rough math) that were under contract but never sold. Interestingly, 2011 was even more disproportionate....
Again, let's pretend ignore the overlap between years -- yes, I know that late 2011 contracts will close in 2012, but in theory almost all of those will be offset by late 2010 contracts that closed in 2011. So, the math gets interesting here..... There were 64 closings during 2011 that were under contract at least twice. 791 closings + 64 contracts that fell through (but then were contracted on again) = 855 closings. That leaves 100 properties (as compared to 15 in 2010) that were under contract but never sold. Again, it's rough math, here is the probability that a contract on your house would result in a closing during the past two years:
Don't get me wrong --- I like contracts, and houses going under contract -- however.....
| |
| Newer Posts | Older Posts |
Scott Rogers
Funkhouser Real
Estate Group
540-578-0102
scott@funkhousergroup.com
Licensed in the
Commonwealth of Virginia
Home Search
Housing Market Report
Harrisonburg Townhouses
Walk Through This Home
Investment Properties
Harrisonburg Foreclosures
Property Transfers
New Listings

