Analysis
| Newer Posts | Older Posts |
Contract Activity Slowing A Bit In July 2022? |
|
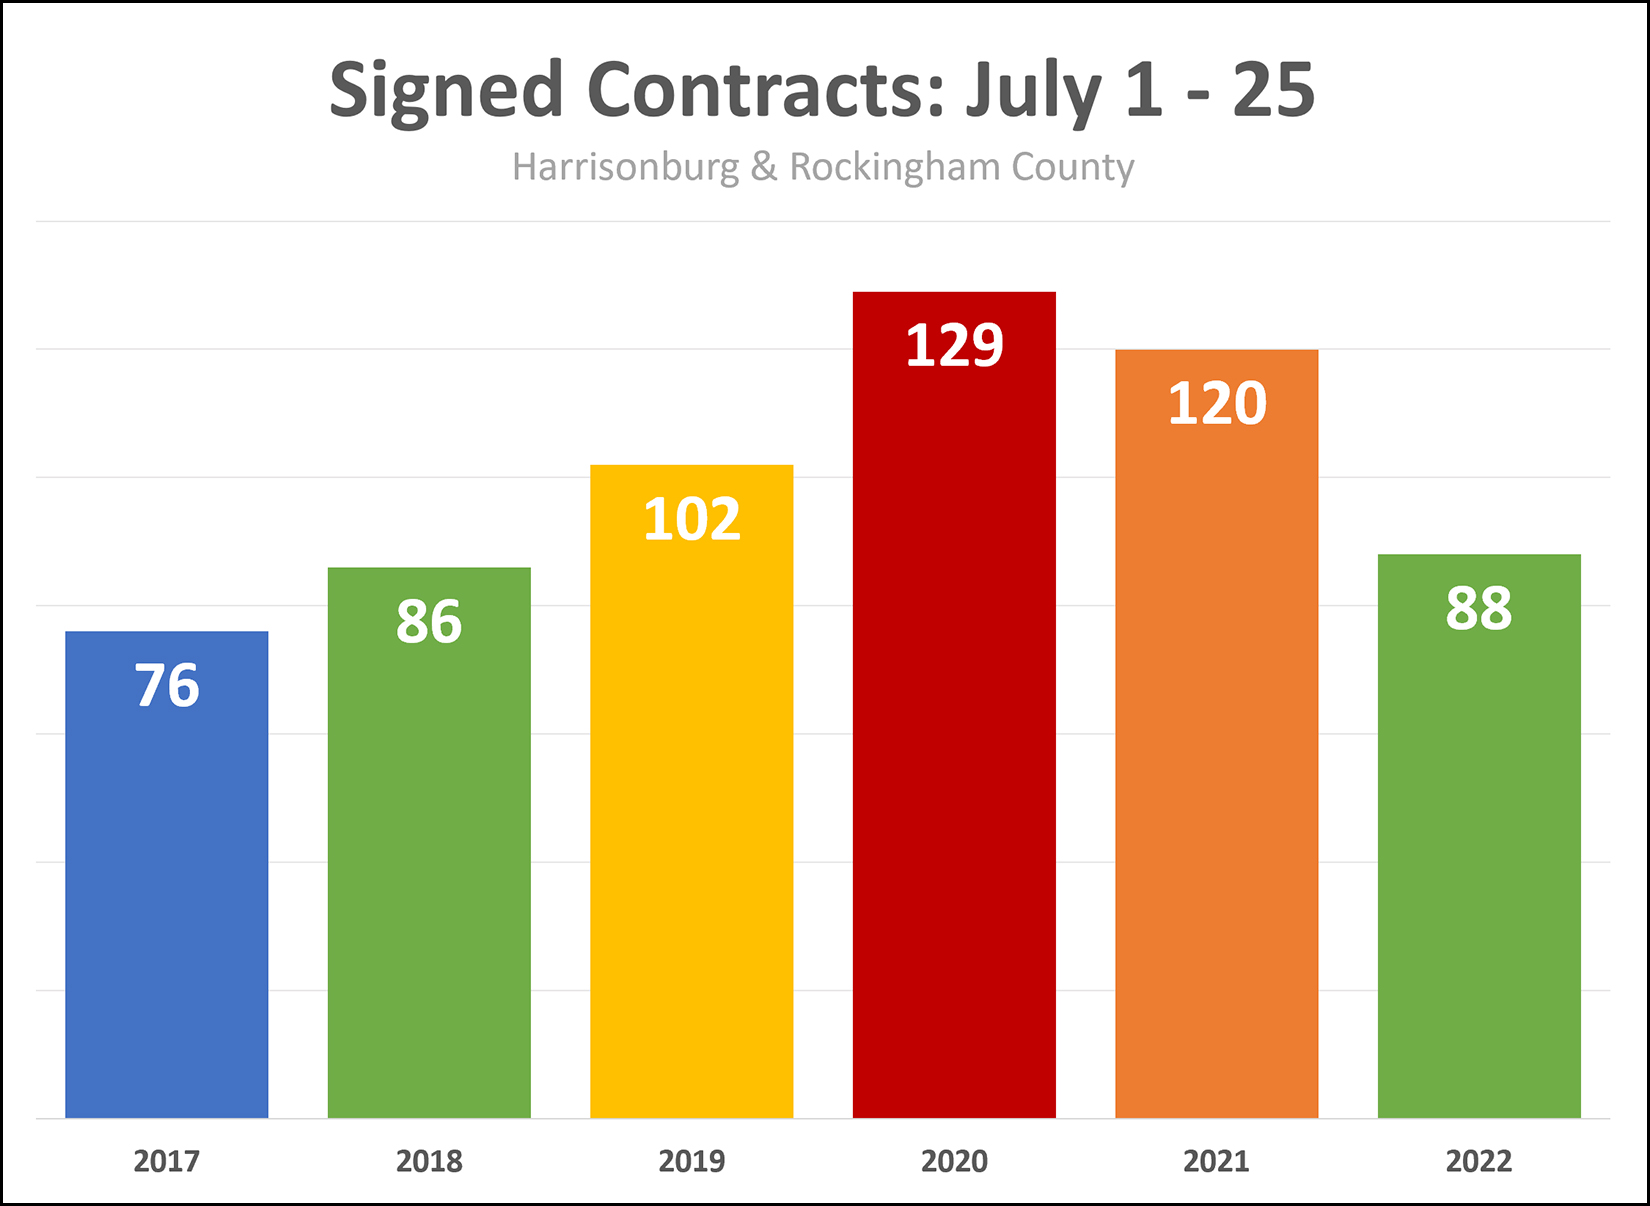 In the first 25 days of July 2022, we have seen 88 signed contracts. Some context and notes...
Is this a massive slow down or a one month anomaly? Only time will tell, but thus far, contract activity in July is certainly seeming slower that I would have expected. | |
Inventory Levels Creeping Slowly Upward, To Higher Low Levels |
|
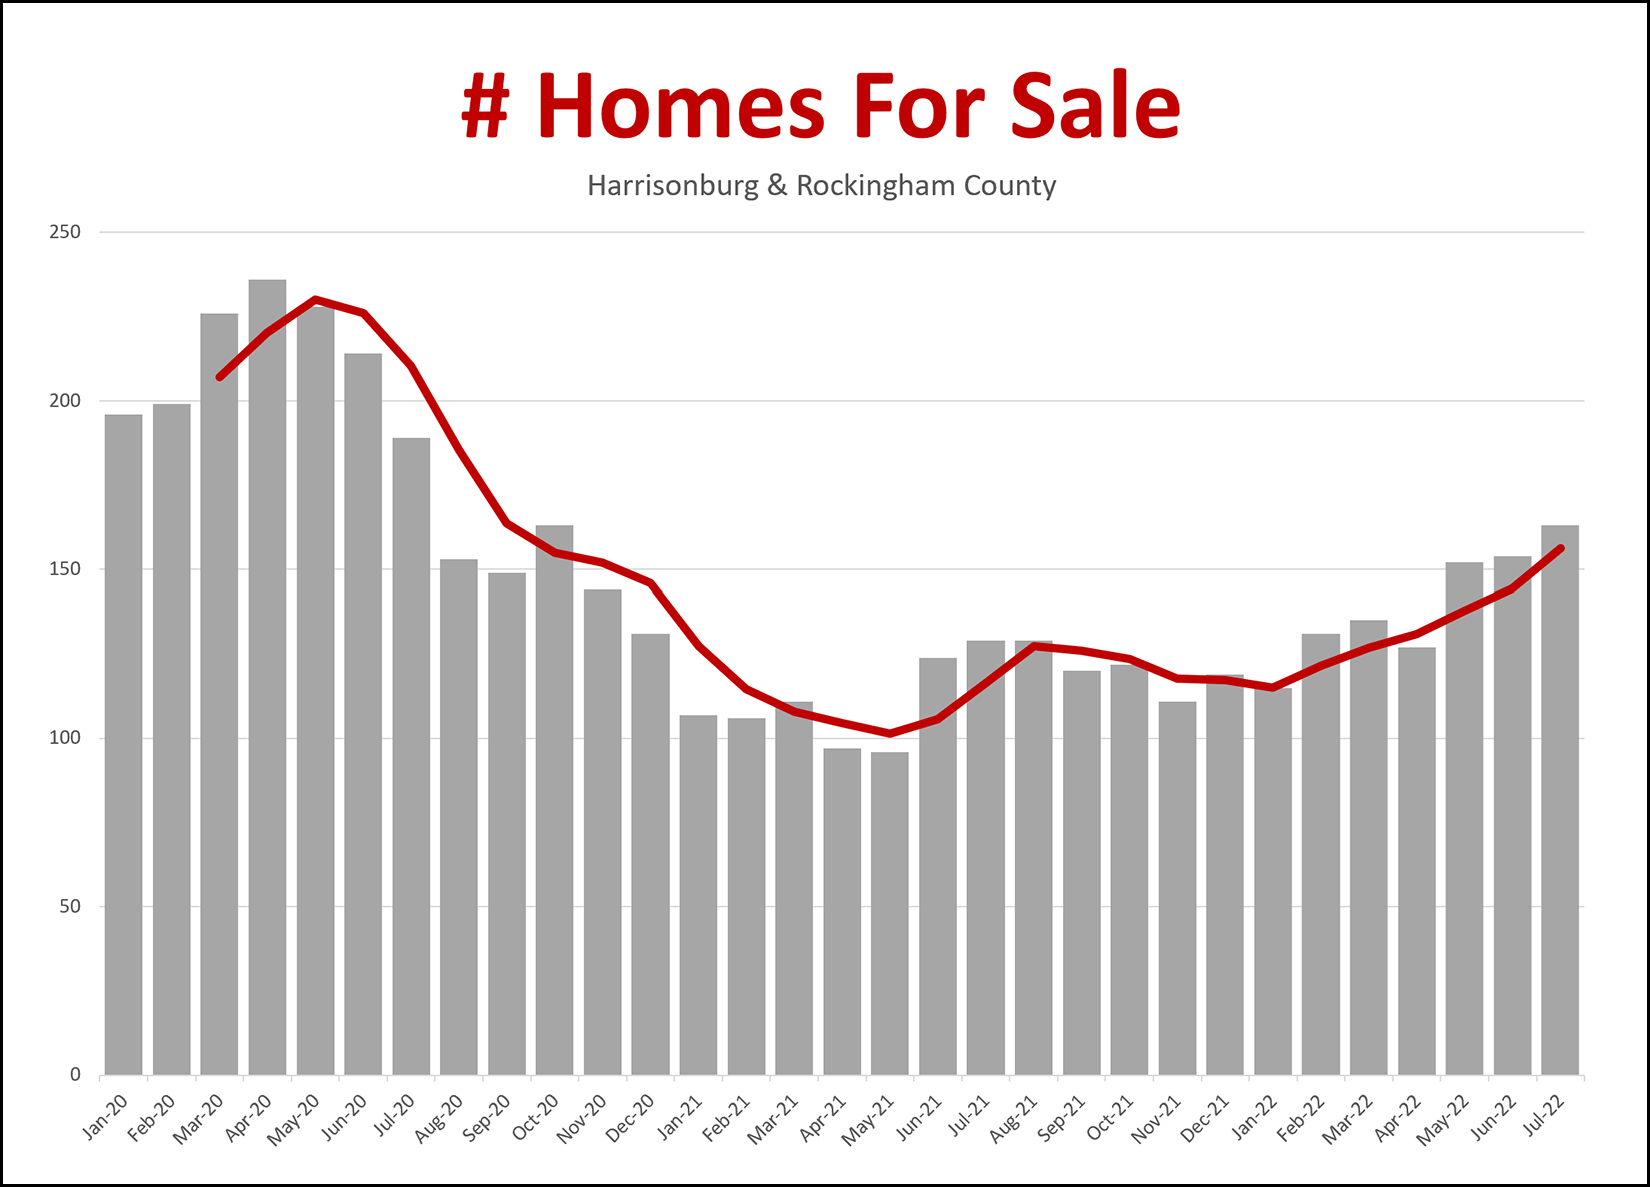 Inventory levels - the number of homes for sale at any given time - have been creeping upward for the past 6+ months. With 163 homes for sale, we are now seeing more homes for sale than we have seen at any time since late 2020. The gray bars above show the number of homes on the market at the end of each month. The red line above shows a moving three month average to show the overall trend more clearly. To put this in a bit of context though, these new highs are actually still pretty low... Homes for Sale In...
So, yes, July 2022 inventory levels are higher than a year ago... but are also much lower than any other recent July... | |
Harrisonburg Housing Market Still Speeding Right Along |
|
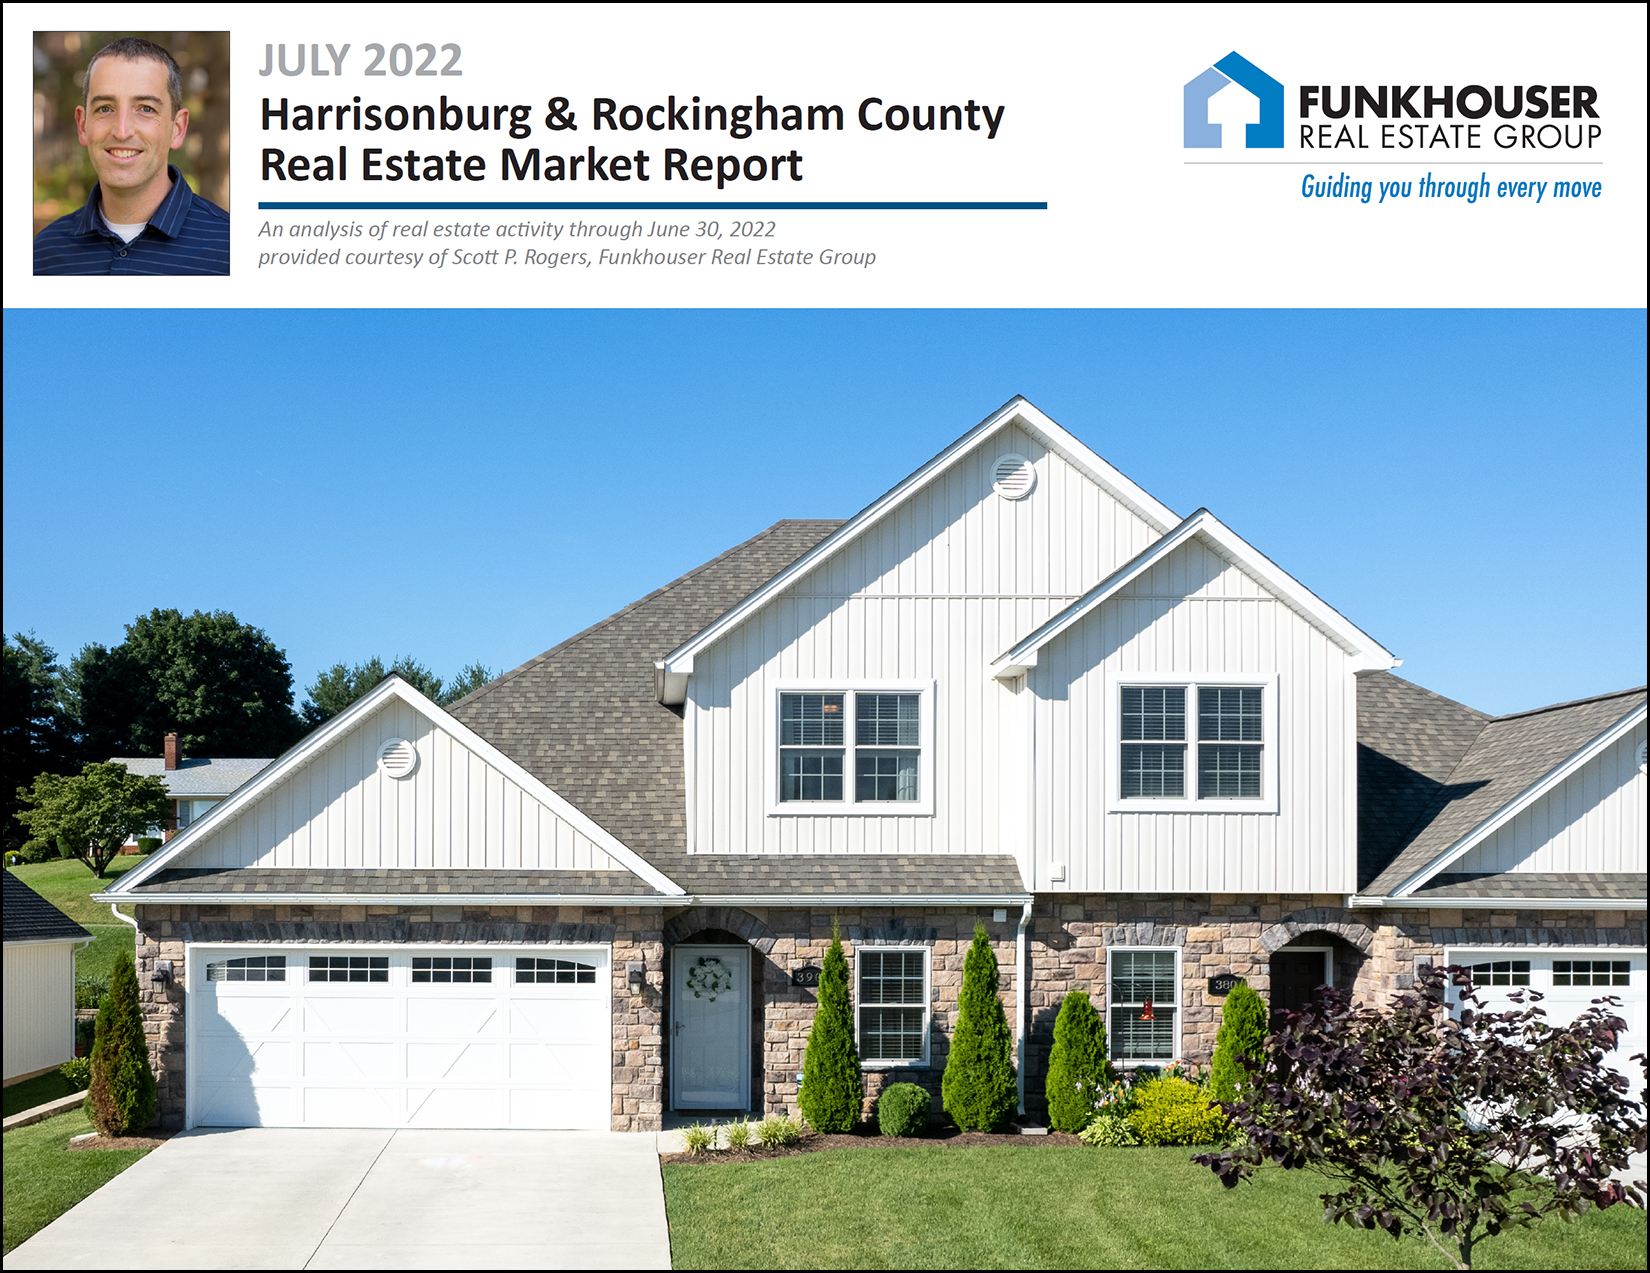 Happy Tuesday morning, friends! The starting and ending point of summer likely varies for many of us, but it seems like we're somewhere around the middle of summer. Gasp! As such, I hope the first half (or so) of the summer has treated you well, and that you still have some fun, adventures and relaxation in the works for the second half of summer. Before we get to the real estate news of the day, I'll mention that Red Wing was *fantastic* this year... 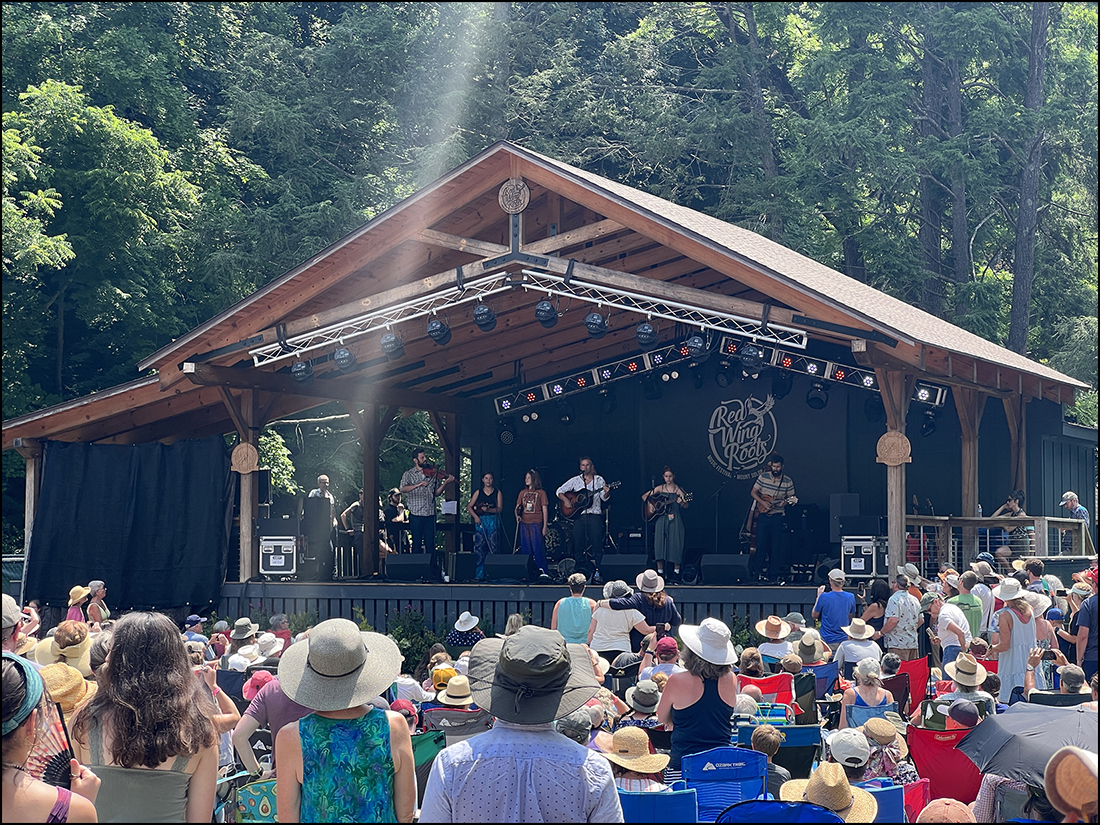 I enjoyed seeing many of you out at Natural Chimneys over that long (but not quite long enough) weekend and I hope the rest of you will consider checking it out next year! Sign up for Red Wing Updates here. Next, I should mention that the beautiful home on the cover of my market report is on the market, for sale, as of this morning! Find out more about 390 Callaway Circle here. Finally, if you're looking for a good cup of coffee (or a caramel latte) one of my favorite coffee spots in the 'burg is Black Sheep Coffee, tucked away over on West Bruce Street. Interested in checking out Black Sheep Coffee? I'm giving away a $50 gift certificate, which you can enter to win here! And now, let's spend a few minutes together exploring the latest news and happenings in our local housing market... 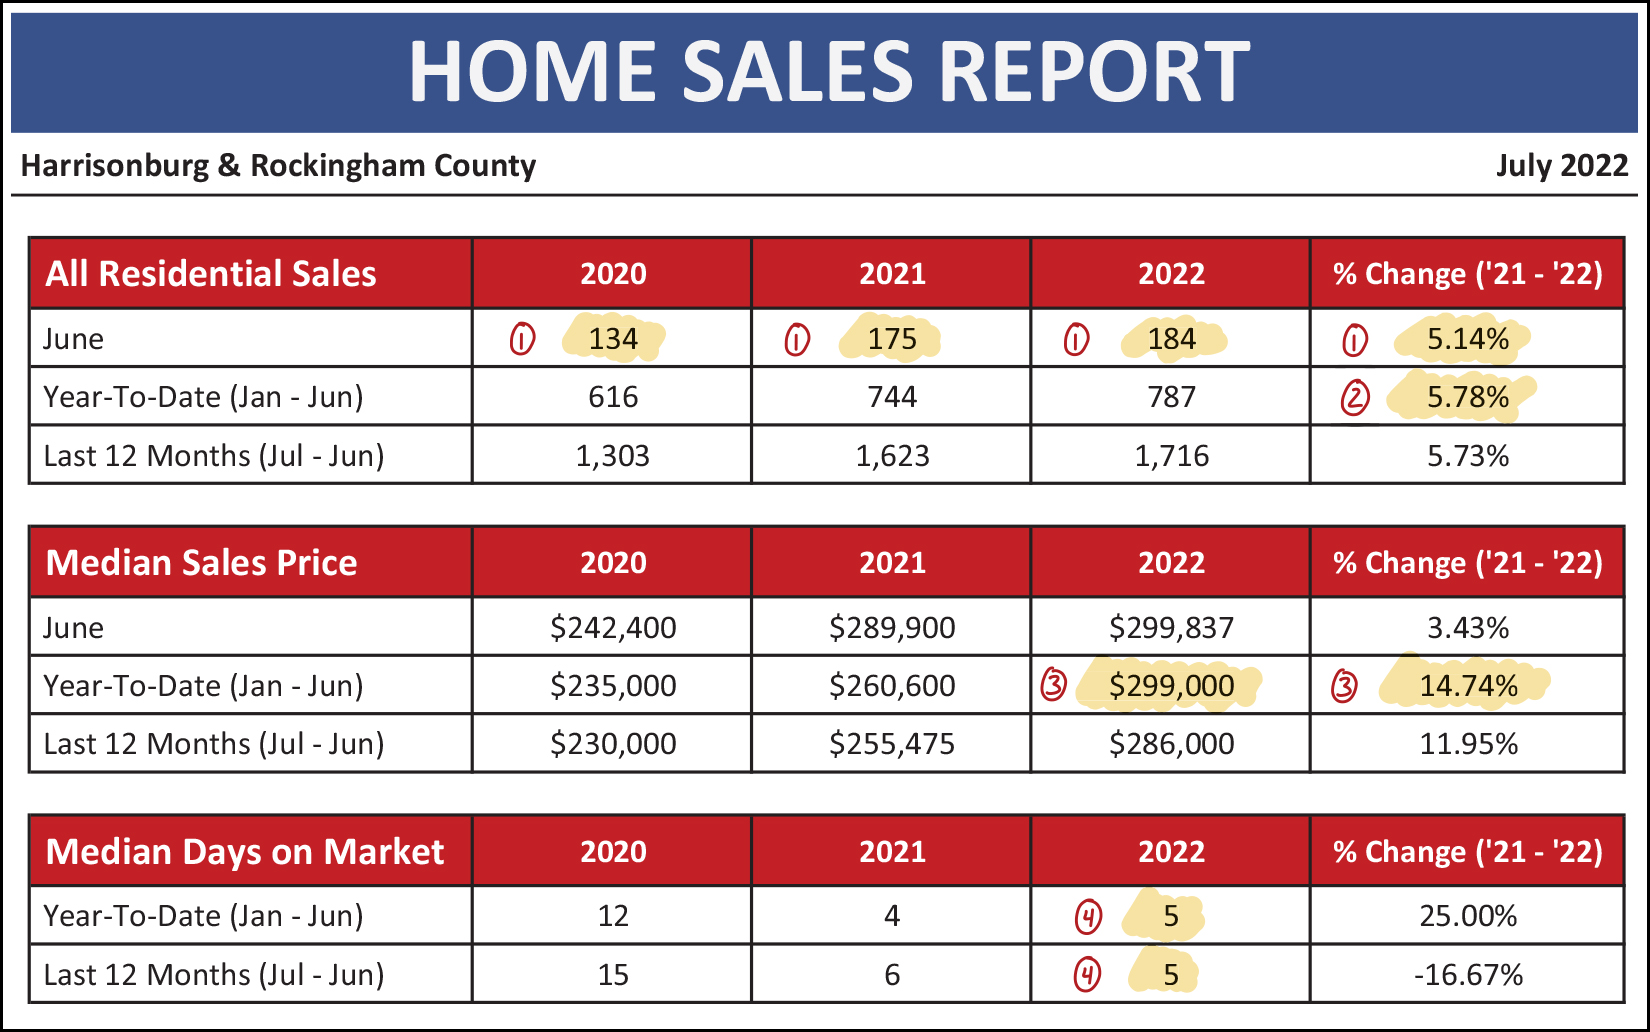 Right off the bat, we get to some rather fascinating updates just checking out the very basic metrics of our local market. As referenced in the tiny red numbers above... [1] A normal June might have around 135 or 145 home sales. Last June (2021) we saw an impressive 175 home sales. I did not think we would clear that high bar this June. But... we did. There were an astonishing 184 home sales in June 2022! [2] The median sales price in the first half of this year was $299,000! That is almost 15% higher than it was in the first half of last year, when it was $260,600. Even with *much* higher mortgage interest rates, homes keep selling at higher and higher prices! [3] Homes are still selling fassssssssst! The median days on the market in Harrisonburg and Rockingham County during the first six months of 2022 was... only five days, just as fast as when we look at the entire past 12 months of data. So... lots of sales, prices that are higher than ever, and homes are going under contract faster than ever. Hmmmm... things don't seem to really be slowing down thus far in 2022!? This fast moving market has been one contributor to the steady increases in home prices seen over the past two years. Take a look at these increases... 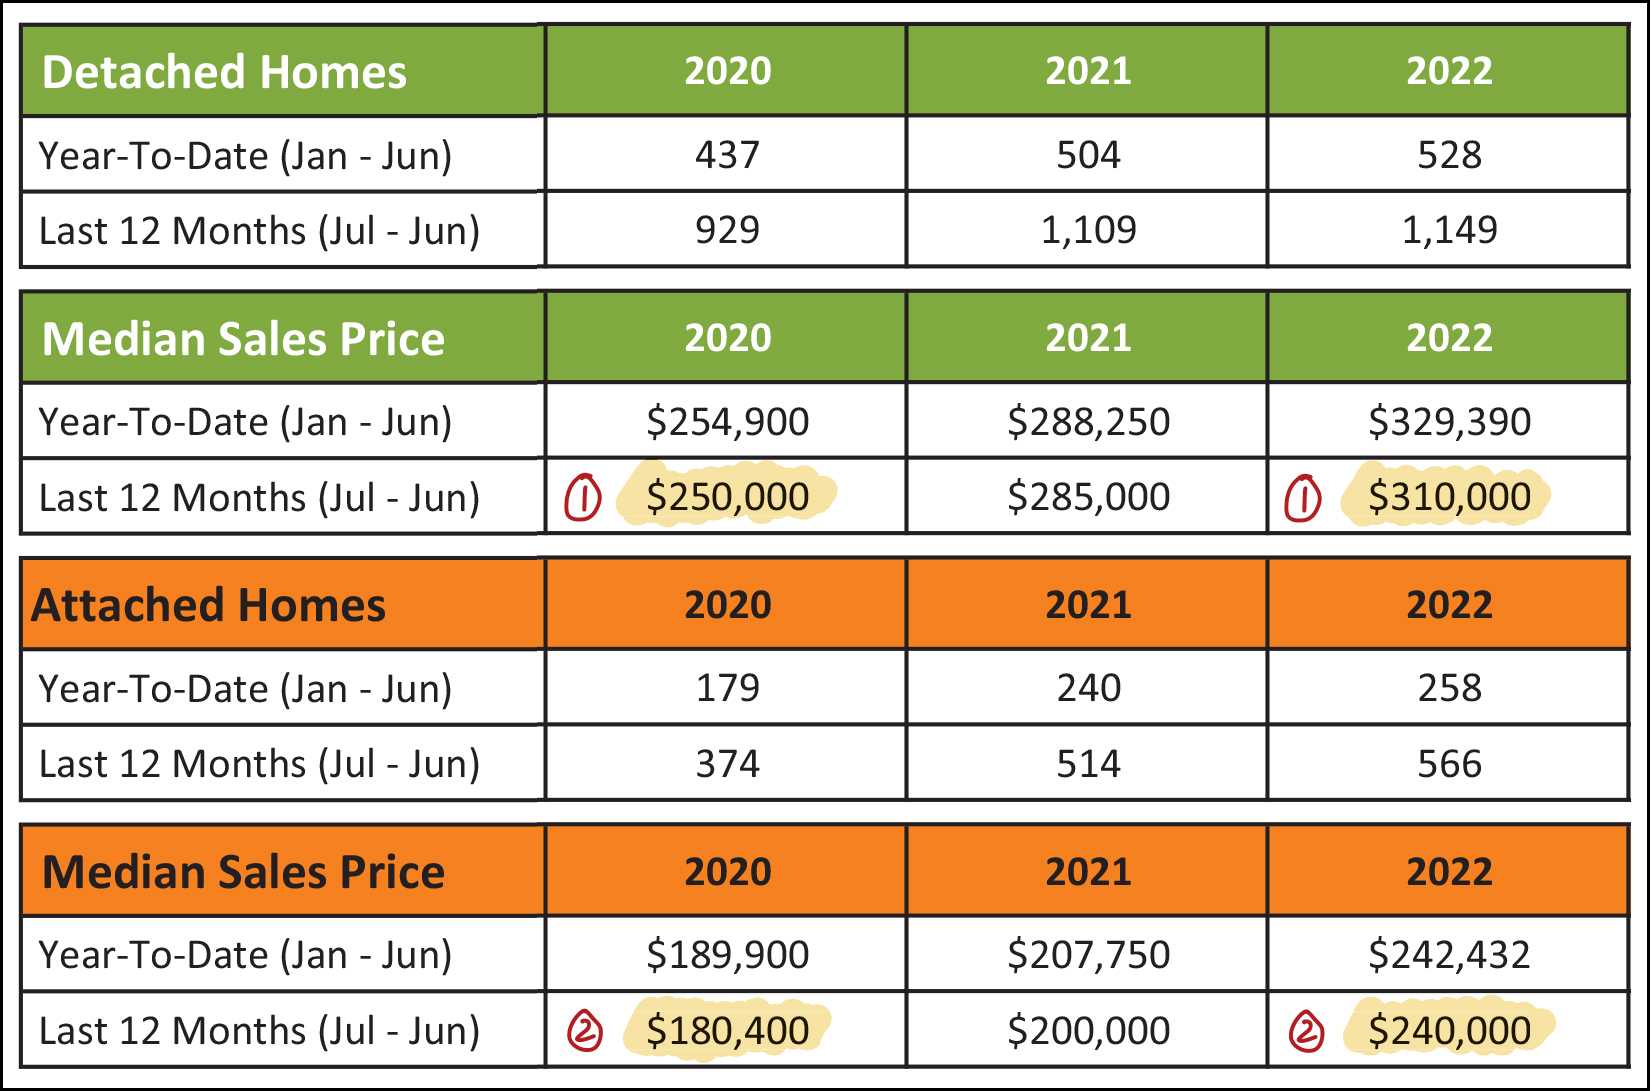 [1] The median sales price of detached homes was only $250,000 just two years ago... but over the past two years that median sales price has risen to $310,000! [2] The median sales price of attached homes (townhomes, duplexes, condos) was only $180,400 just two years ago... but over the past two years that median sales prices has risen to $240,000! Homeowners have been delighted with these increases. Sellers have also been big fans. Buyers... not so much. It can be tough for buyers to get excited about paying a *much* higher price alongside their *much* higher mortgage interest rate... but buyers still seem to be moving forward full steam with their home purchases thus far in 2022. Those home buyers are moving along so steadily that we're breaking (tying) some records... 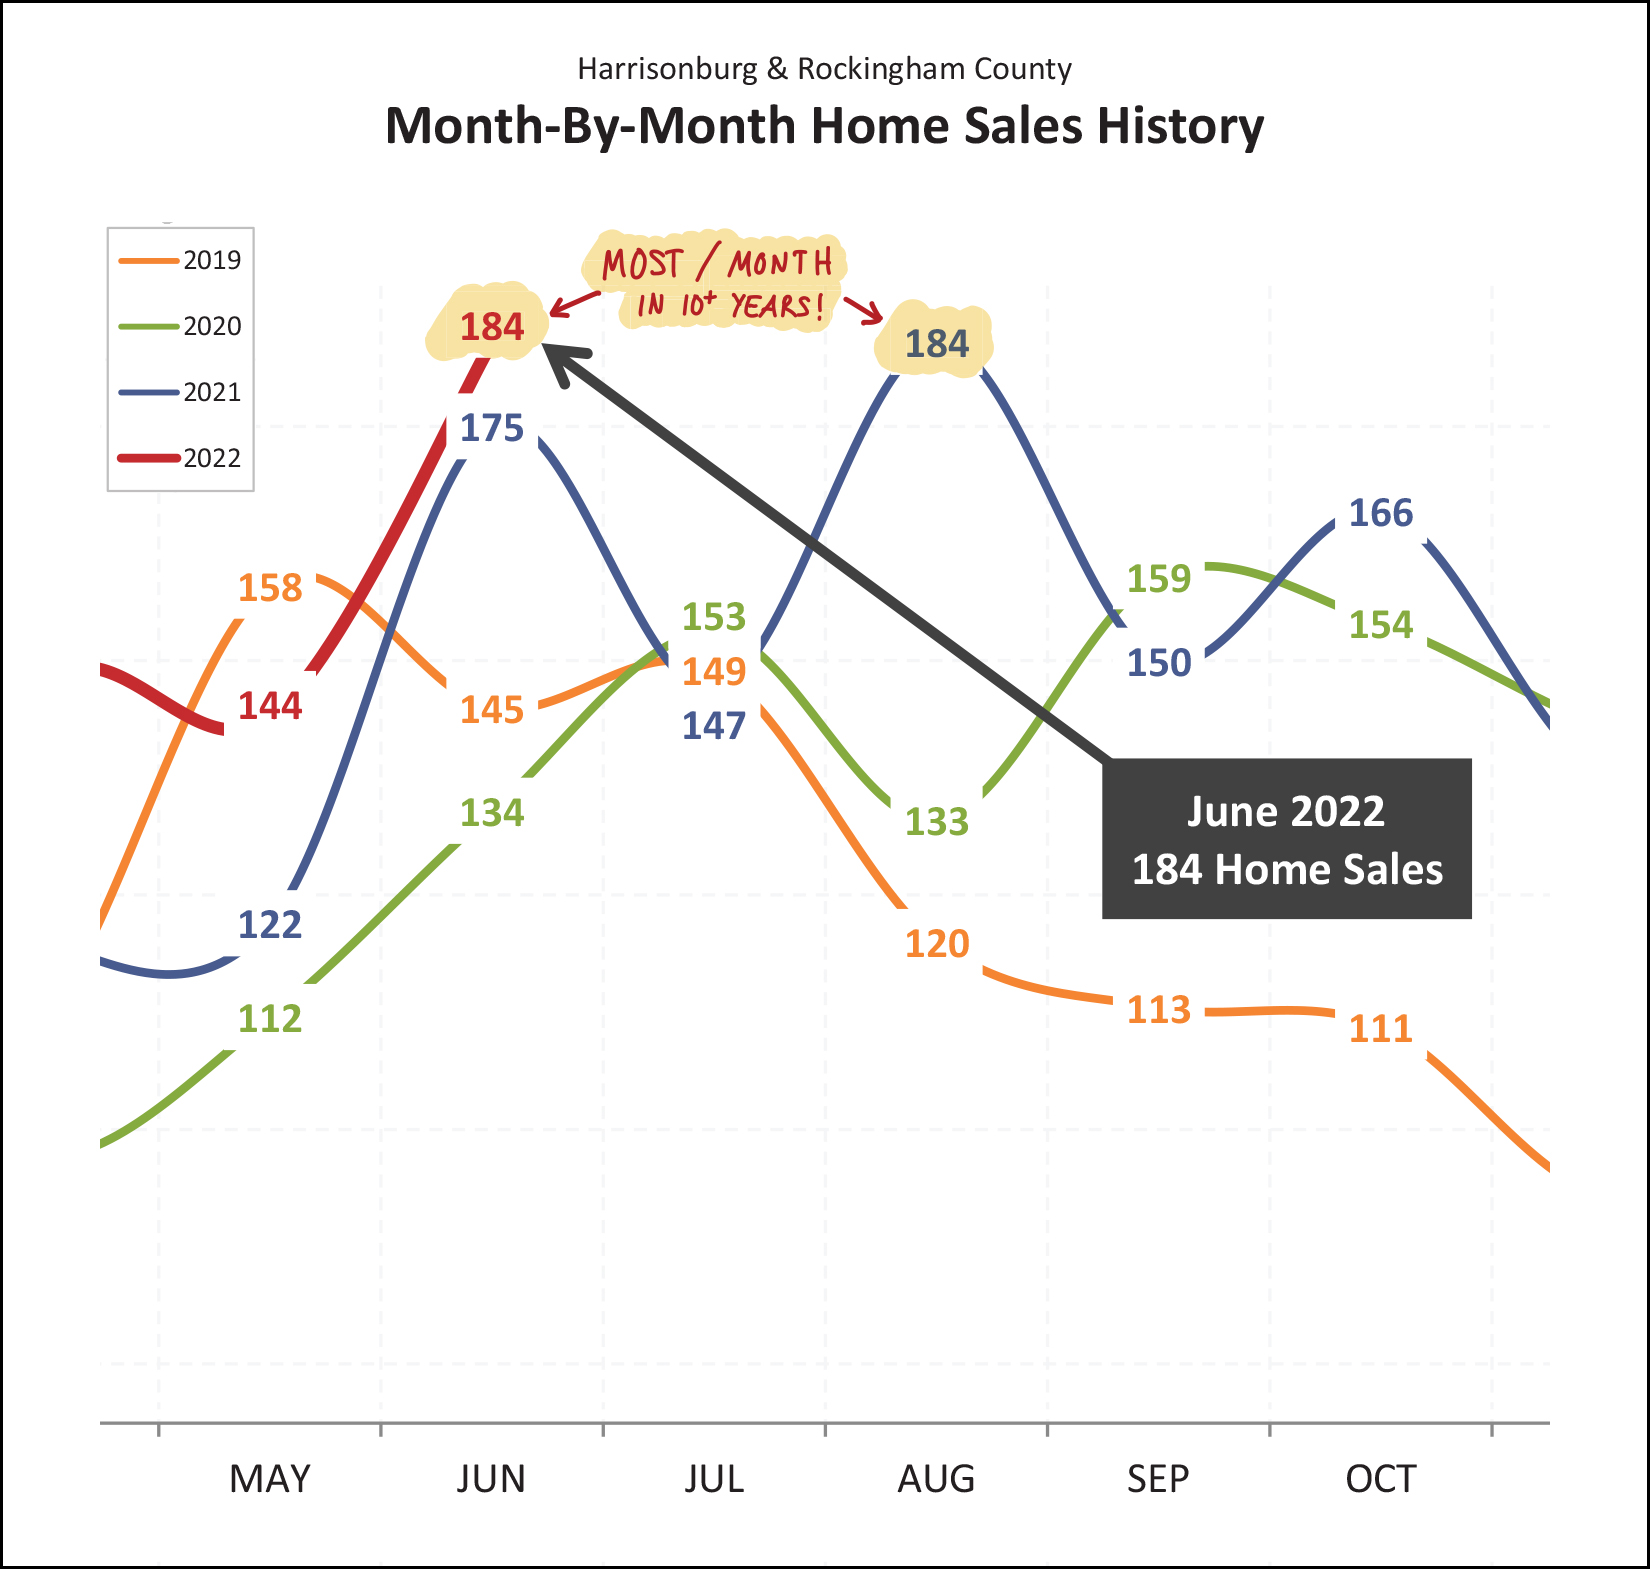 Over the past ten years, the most home sales we have seen in a month has been 184 home sales... which took place last year, in August. Well, what do you know!? This June (last month) we saw... 184 home sales! Looking ahead, what should we expect for July? The past three months of July have been tightly clustered around that 145 - 155 range, so I'm going to play it safe and guess we'll see right around that many home sales in July 2022. Perhaps 150 on the nose!? As I have mentioned to many of you, I fully expected (and still expect) that we'll see a bit of a slow down in home sales activity in 2022 due to higher mortgage interest rates... but... the data just isn't agreeing with me thus far... 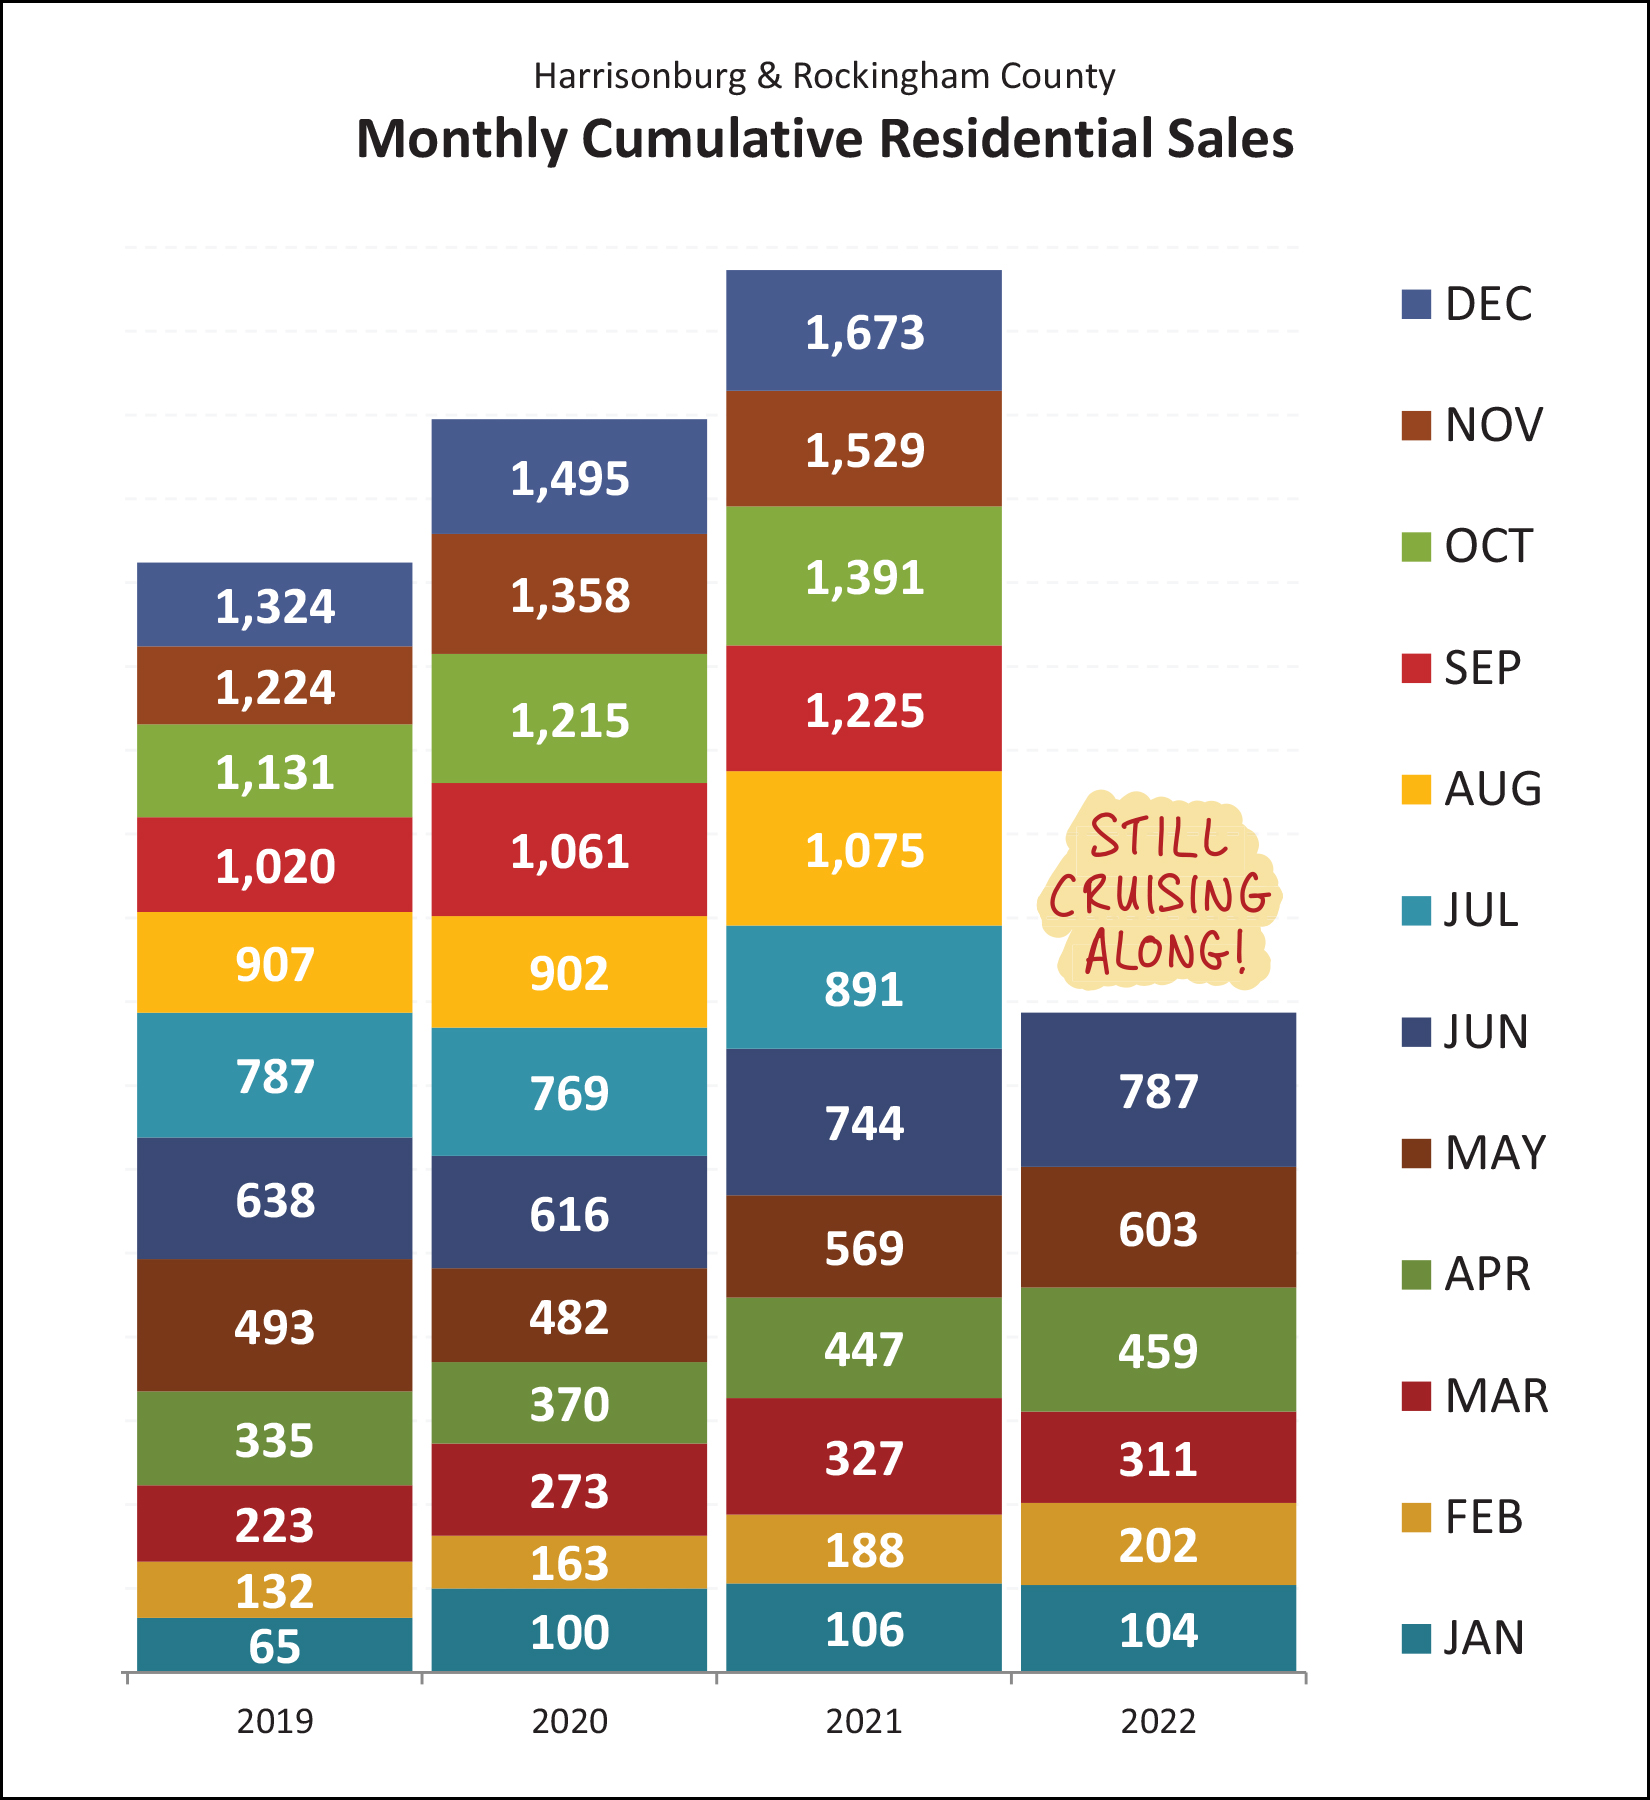 As shown above, the 787 home sales we've seen in the first half of 2022 exceed the number of home sales in the first half of each of the past three years! If I didn't know better, I'd think mortgage interest rates must be *lower* than ever in 2022 to spur on so much buyer activity!? But, no, not so much. More on that later. Looking at these big picture trends in a slightly different way, it's astonishing to see three years in a row of double digit growth in the median sales price in our market... 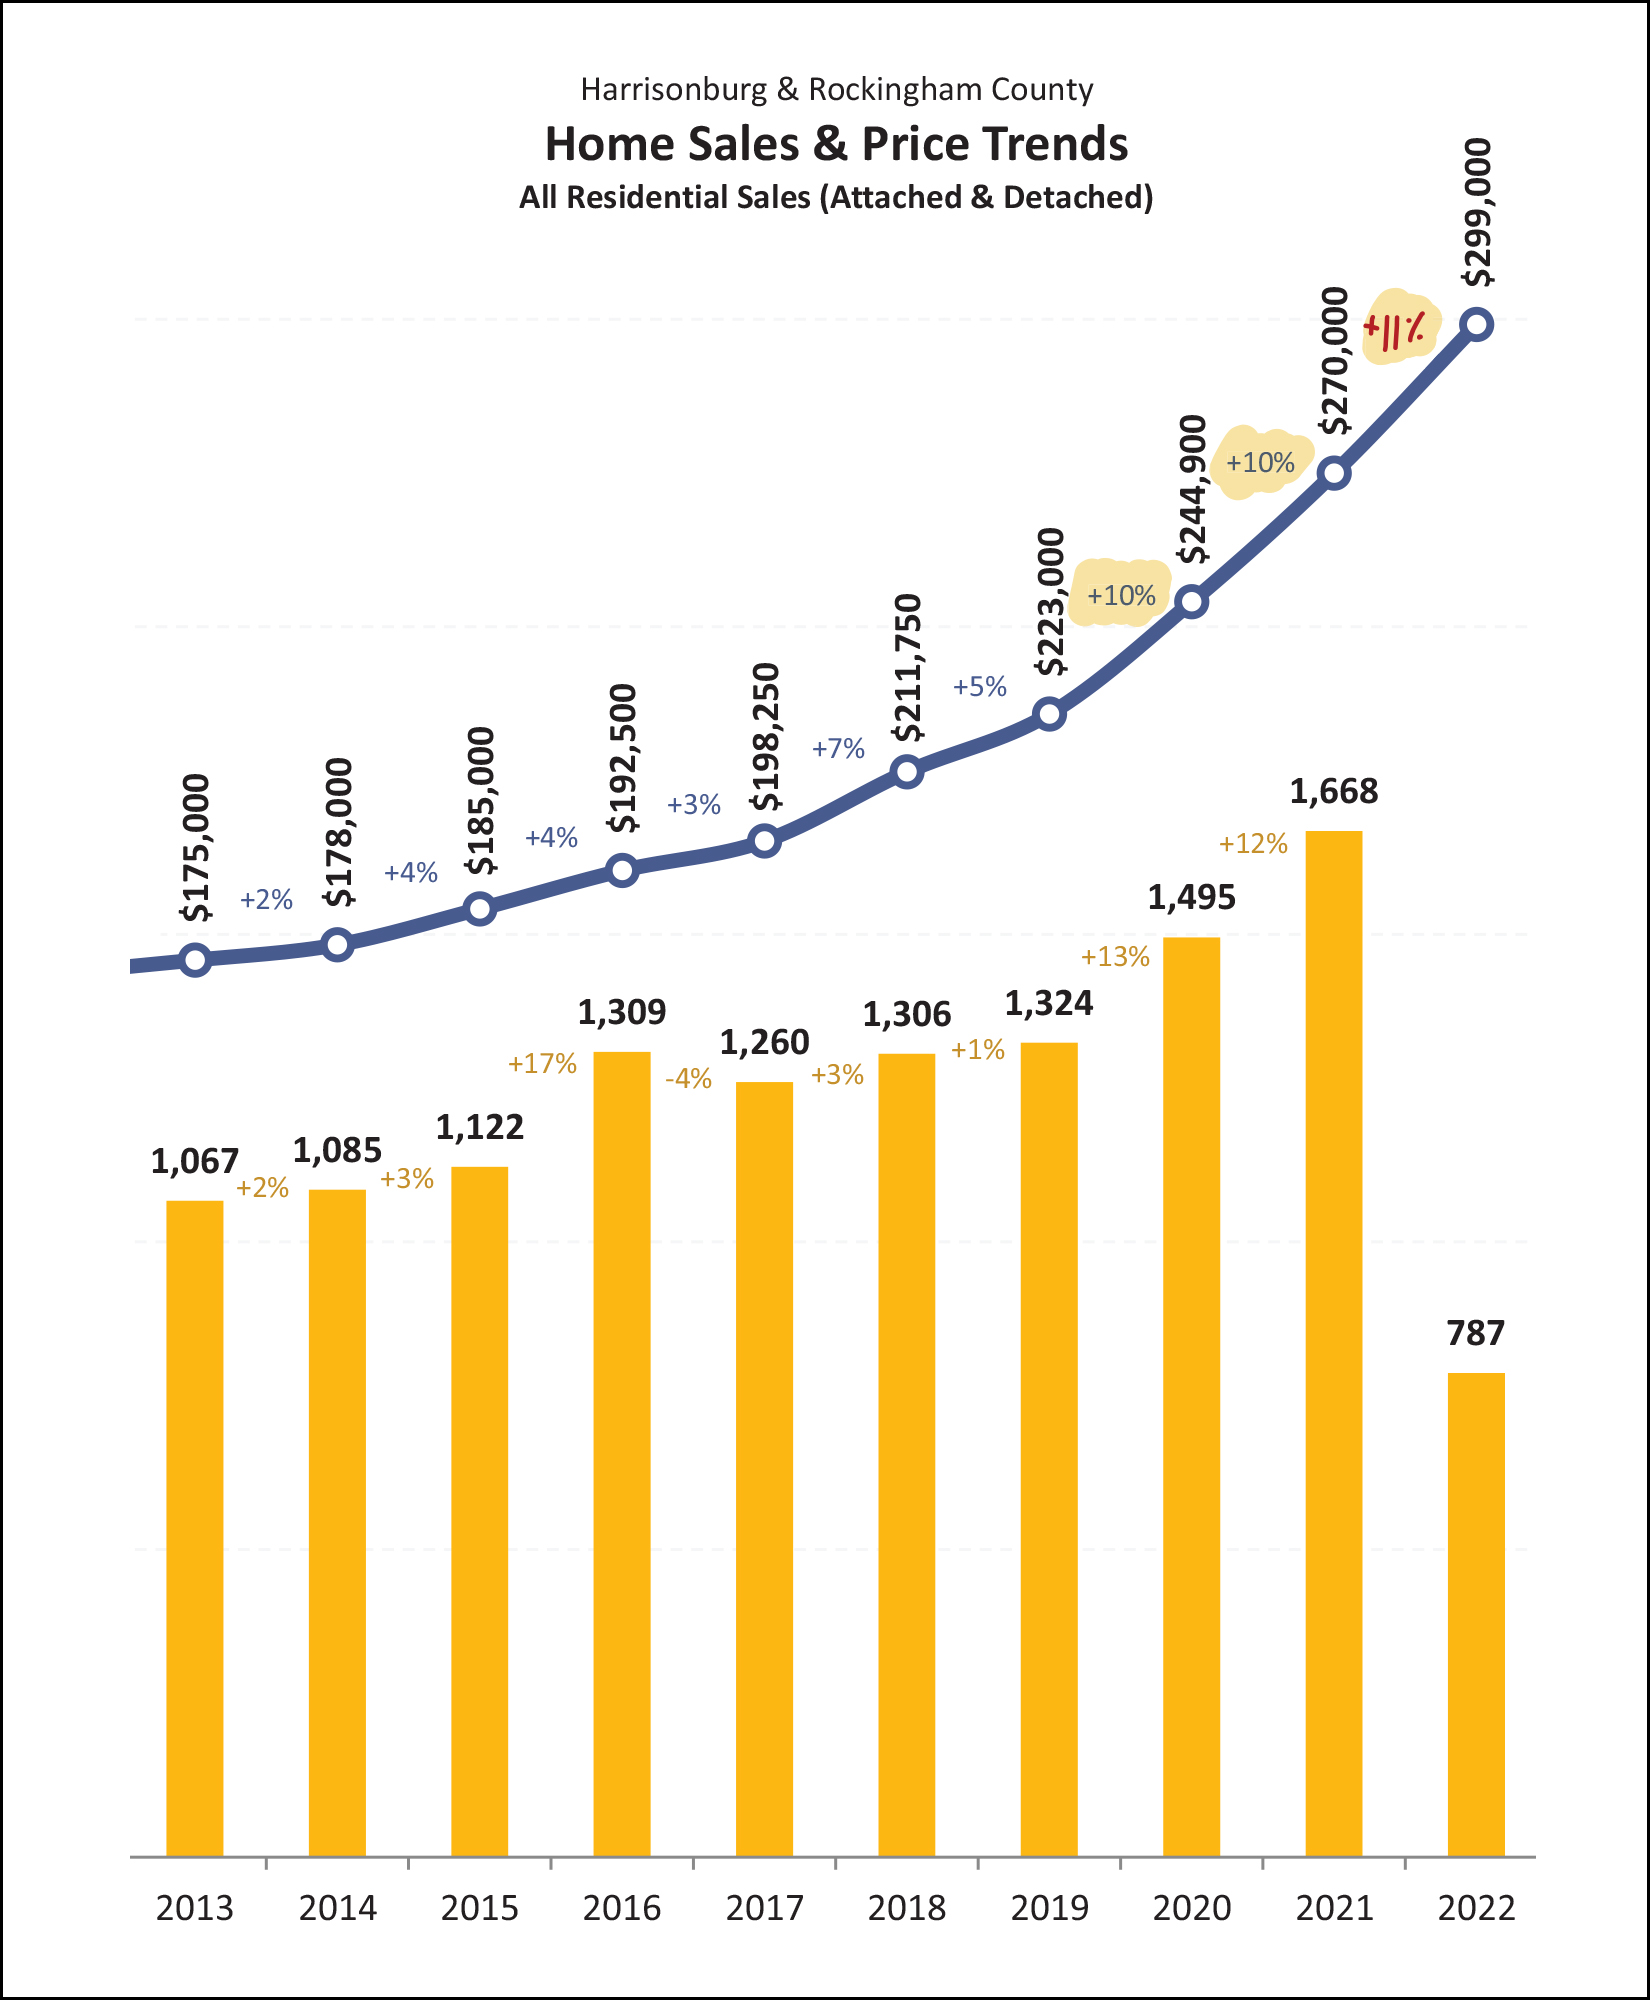 How much did our area's median sales price increase in 2020? 10% How much did our area's median sales price increase in 2021? 10% How much has our area's median sales price increased thus far in 2022? 11% It's been an astonishing few years in our local market to see home values escalating so quickly... without any signs of slowing down. But... to try to reel us back in a bit from cloud nine... 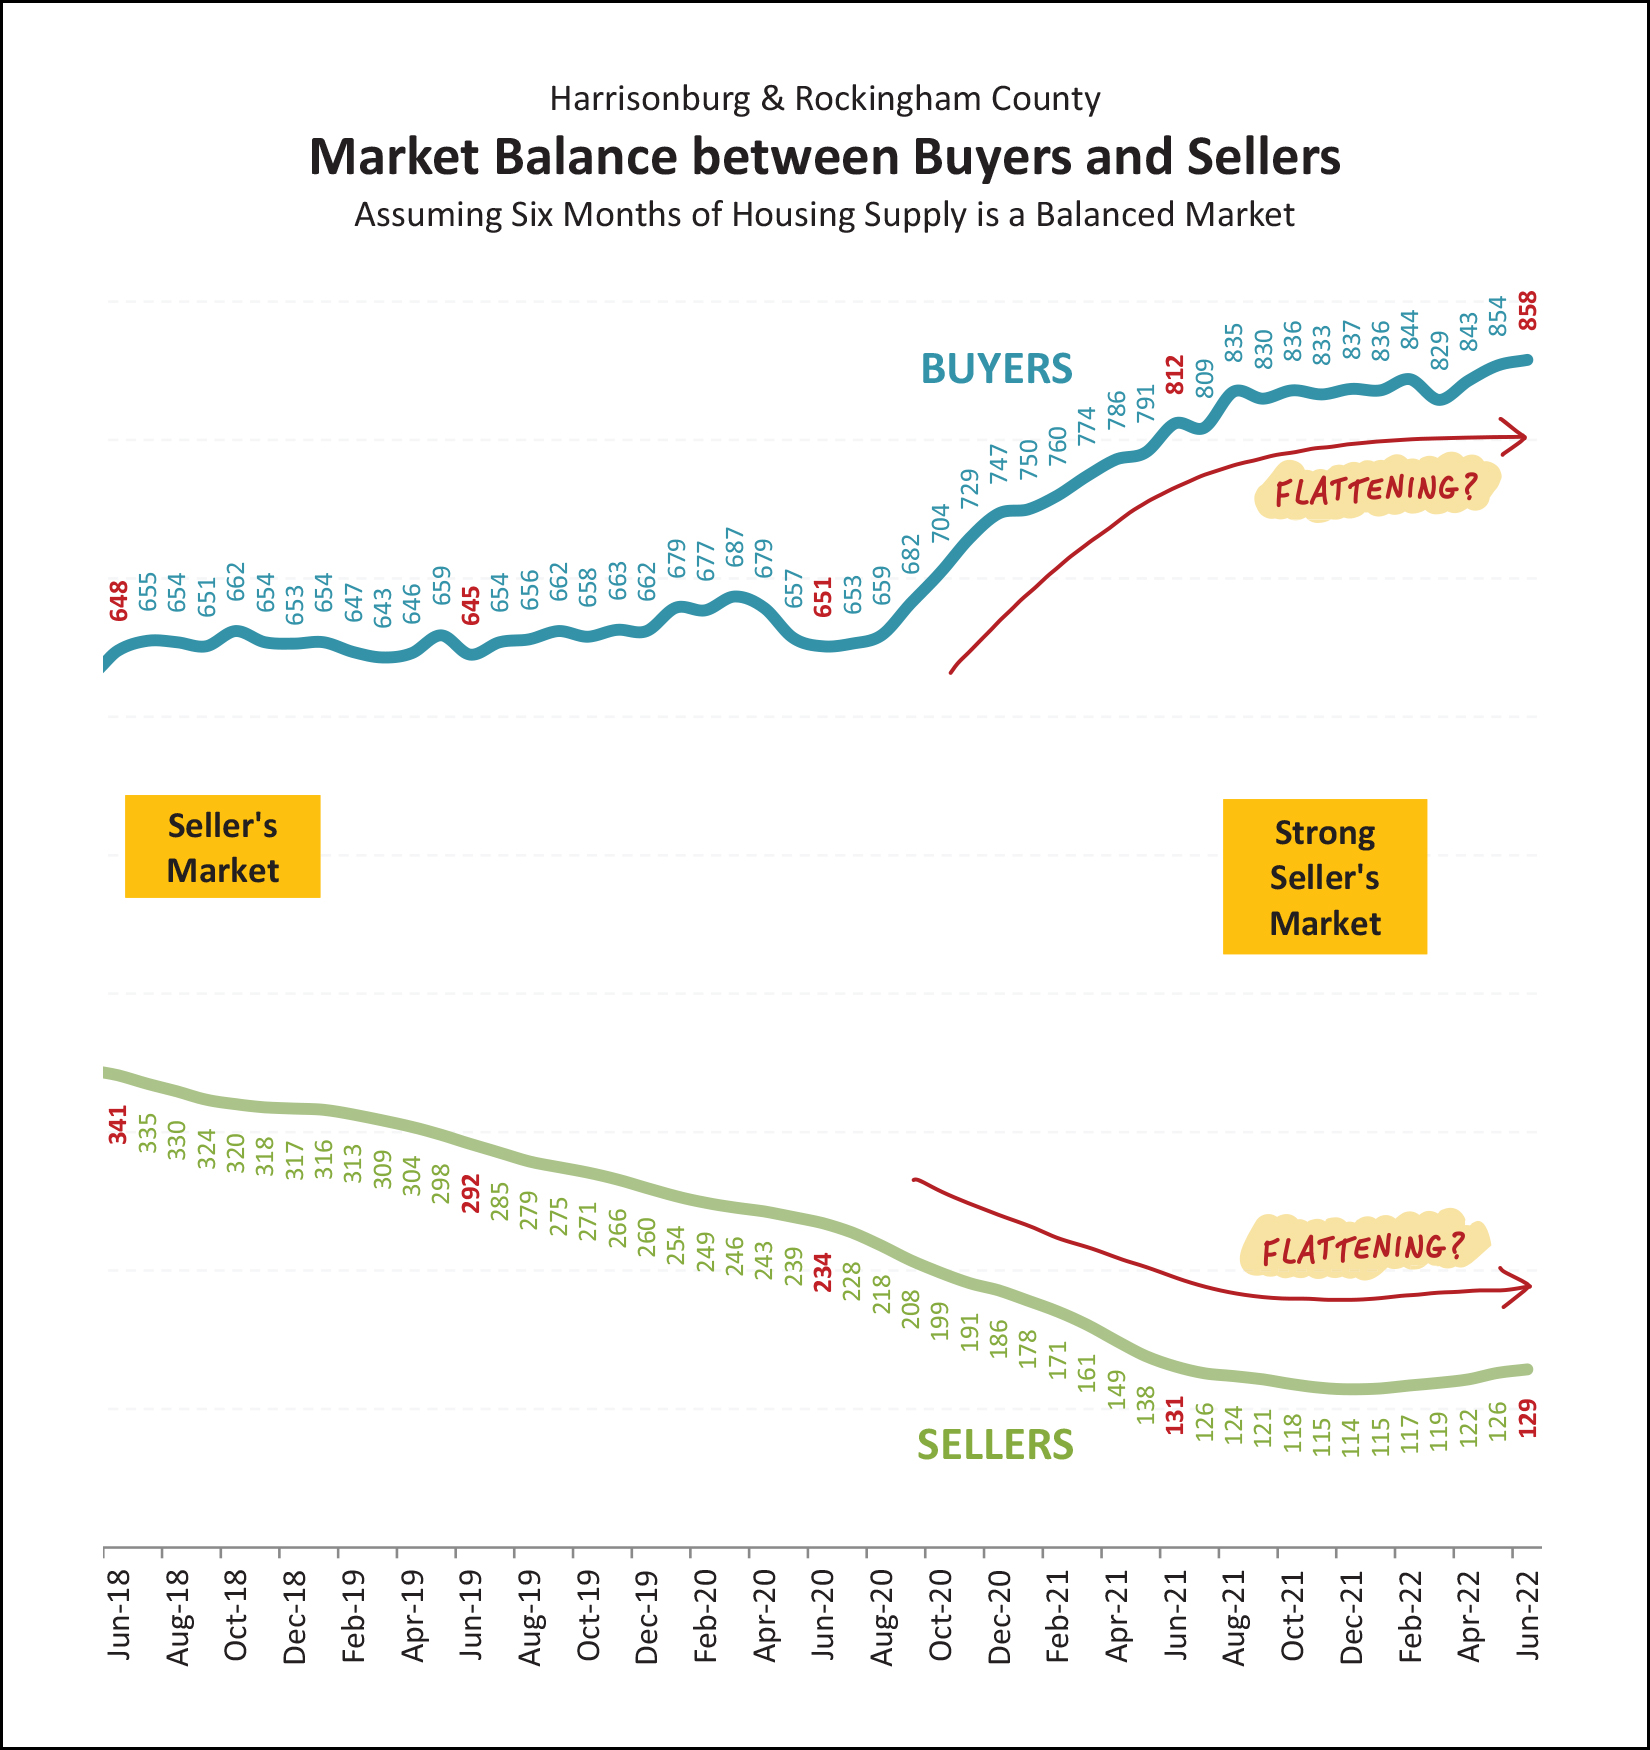 It's hard not to look at the graph above and think that things could be, might be, possibly be changing... [BLUE] The top, blue, line shows the number of buyers buying in a six month period as evaluated over the past four years. This metric has been steadily marching upward over the past two years... but... it seems that the number of buyers buying might be flattening out a bit. Again, not that the amount of buyers buying is decreasing, but buyer activity might not be continuing to increase as quickly as it has for most of the past two years. [GREEN] The bottom, green, line shows the numbers of sellers selling at any given time... the inventory levels at the end(ish) of each month. For most of the past four (plus) years we have seen fewer and fewer (and fewer and fewer) homes on the market, due largely to excessive amounts of buyer demand. But... over the past six months... we're starting to see some modest flattening out of inventory levels in our local area. Inventory levels seem to be steadying themselves. Bear in mind that it is still definitely a strong (strong!) seller's market, but we might be starting to see some early signs that the market might be slowing down a touch... perhaps cooling off from a strong-strong-strong seller's market to a strong-strong seller's market!? Changing gears, slightly, here's an interesting trend to make sure that we recognize... 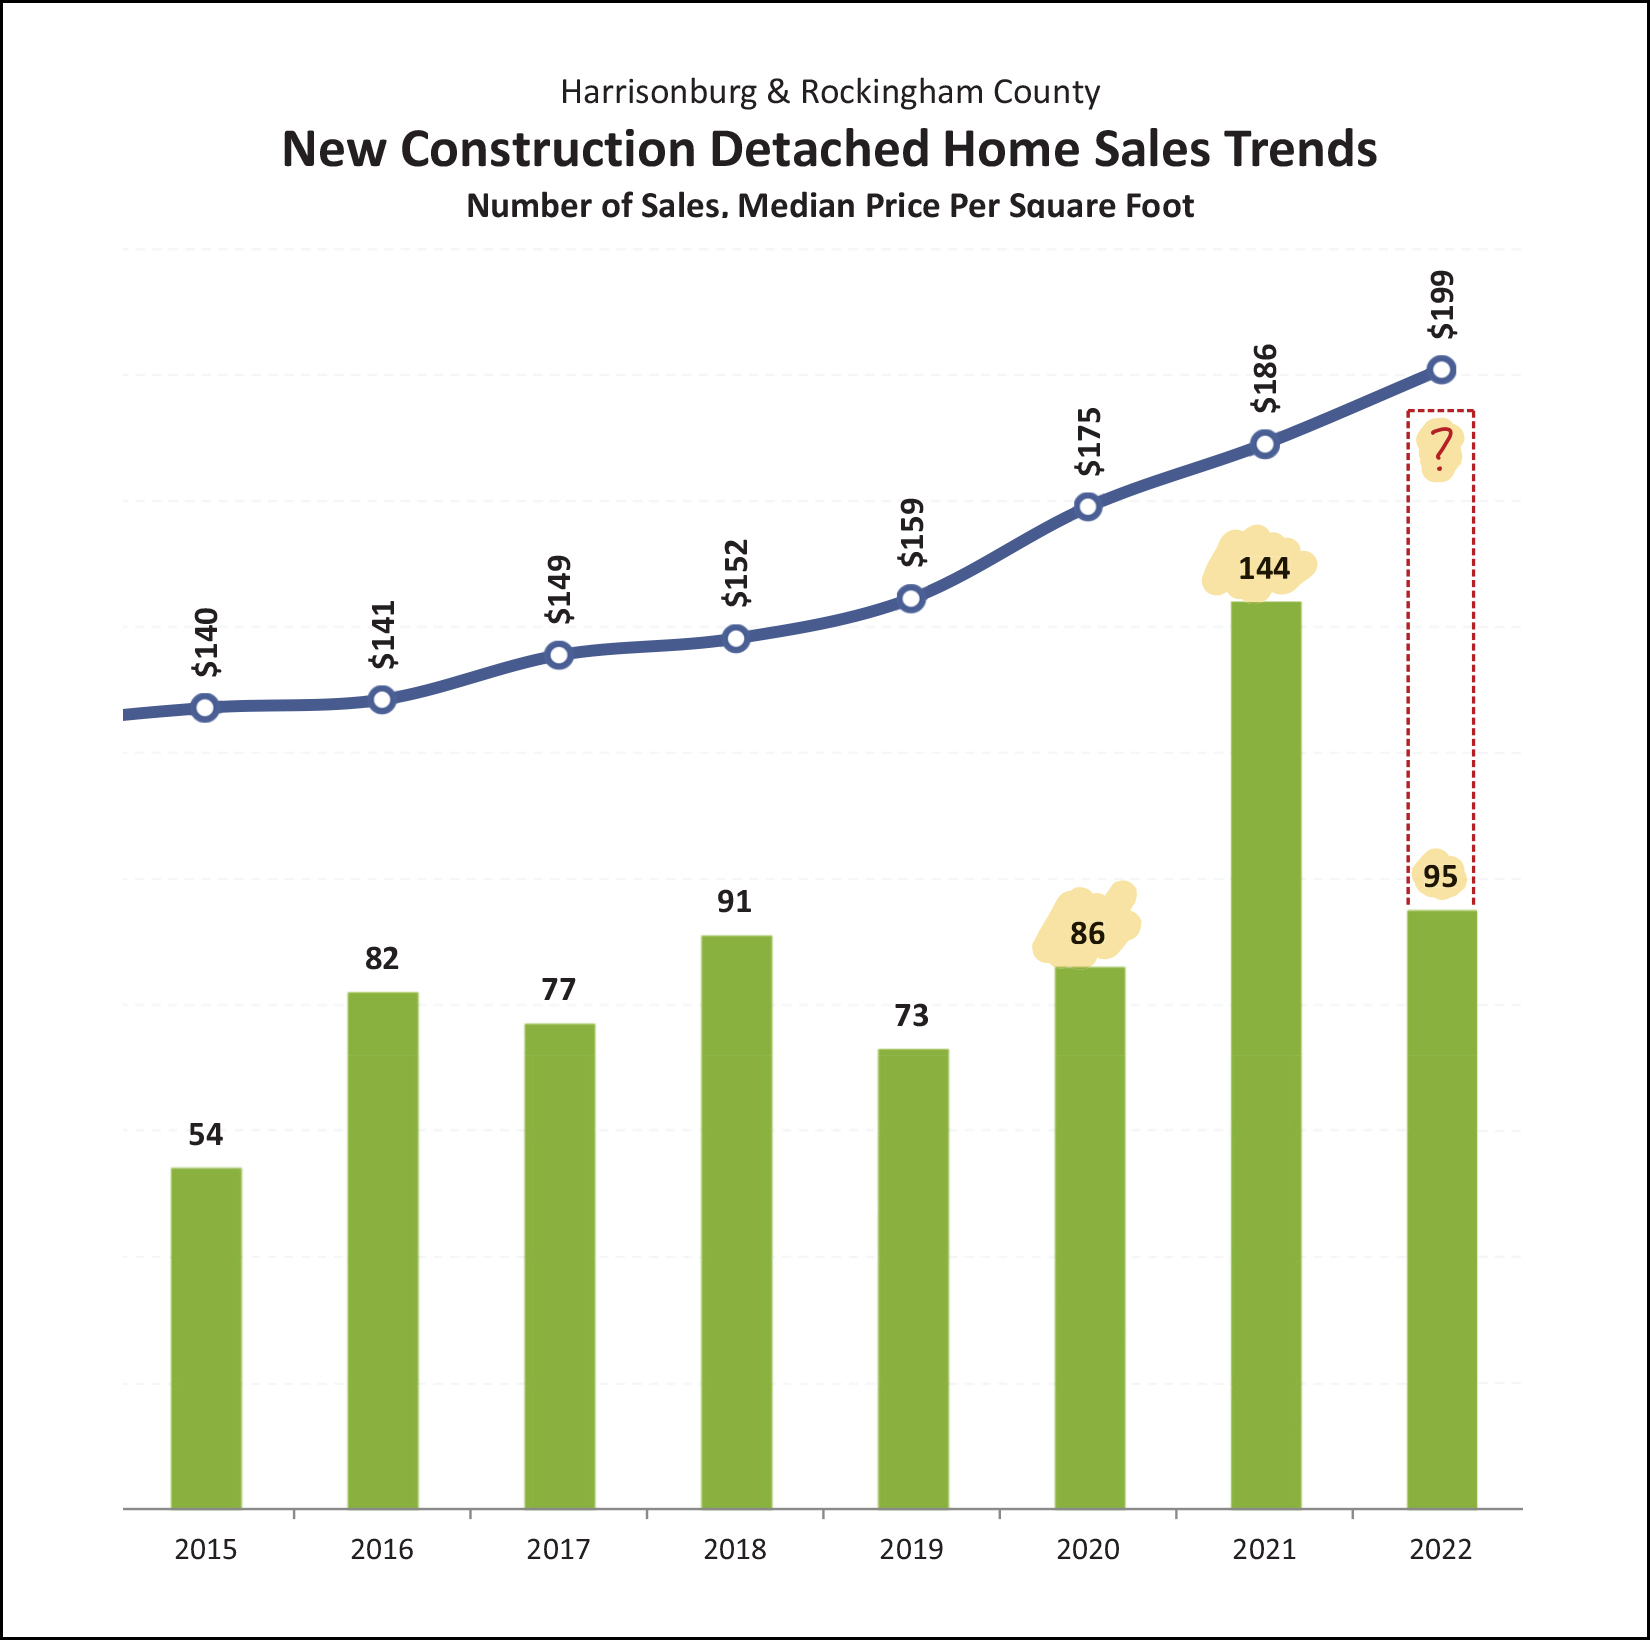 After typically only seeing around 70 - 90 new (detached) home sales per year, we saw a remarkably high 144 such sales last year... and this year we seem to be on track to see around 180 new detached home sales in Harrisonburg and Rockingham County. These recent, steady increases in the number of new homes selling in our market is doing two things... one, allowing the overall number of home sales to increase without relying just on resale homes as inventory... and allowing the median sales price in our market to keep climbing, given that new homes are typically more expensive than resale homes. OK, shifting back to the overall sales market, here's a look at recent months of contract activity... measured by when contracts are signed... 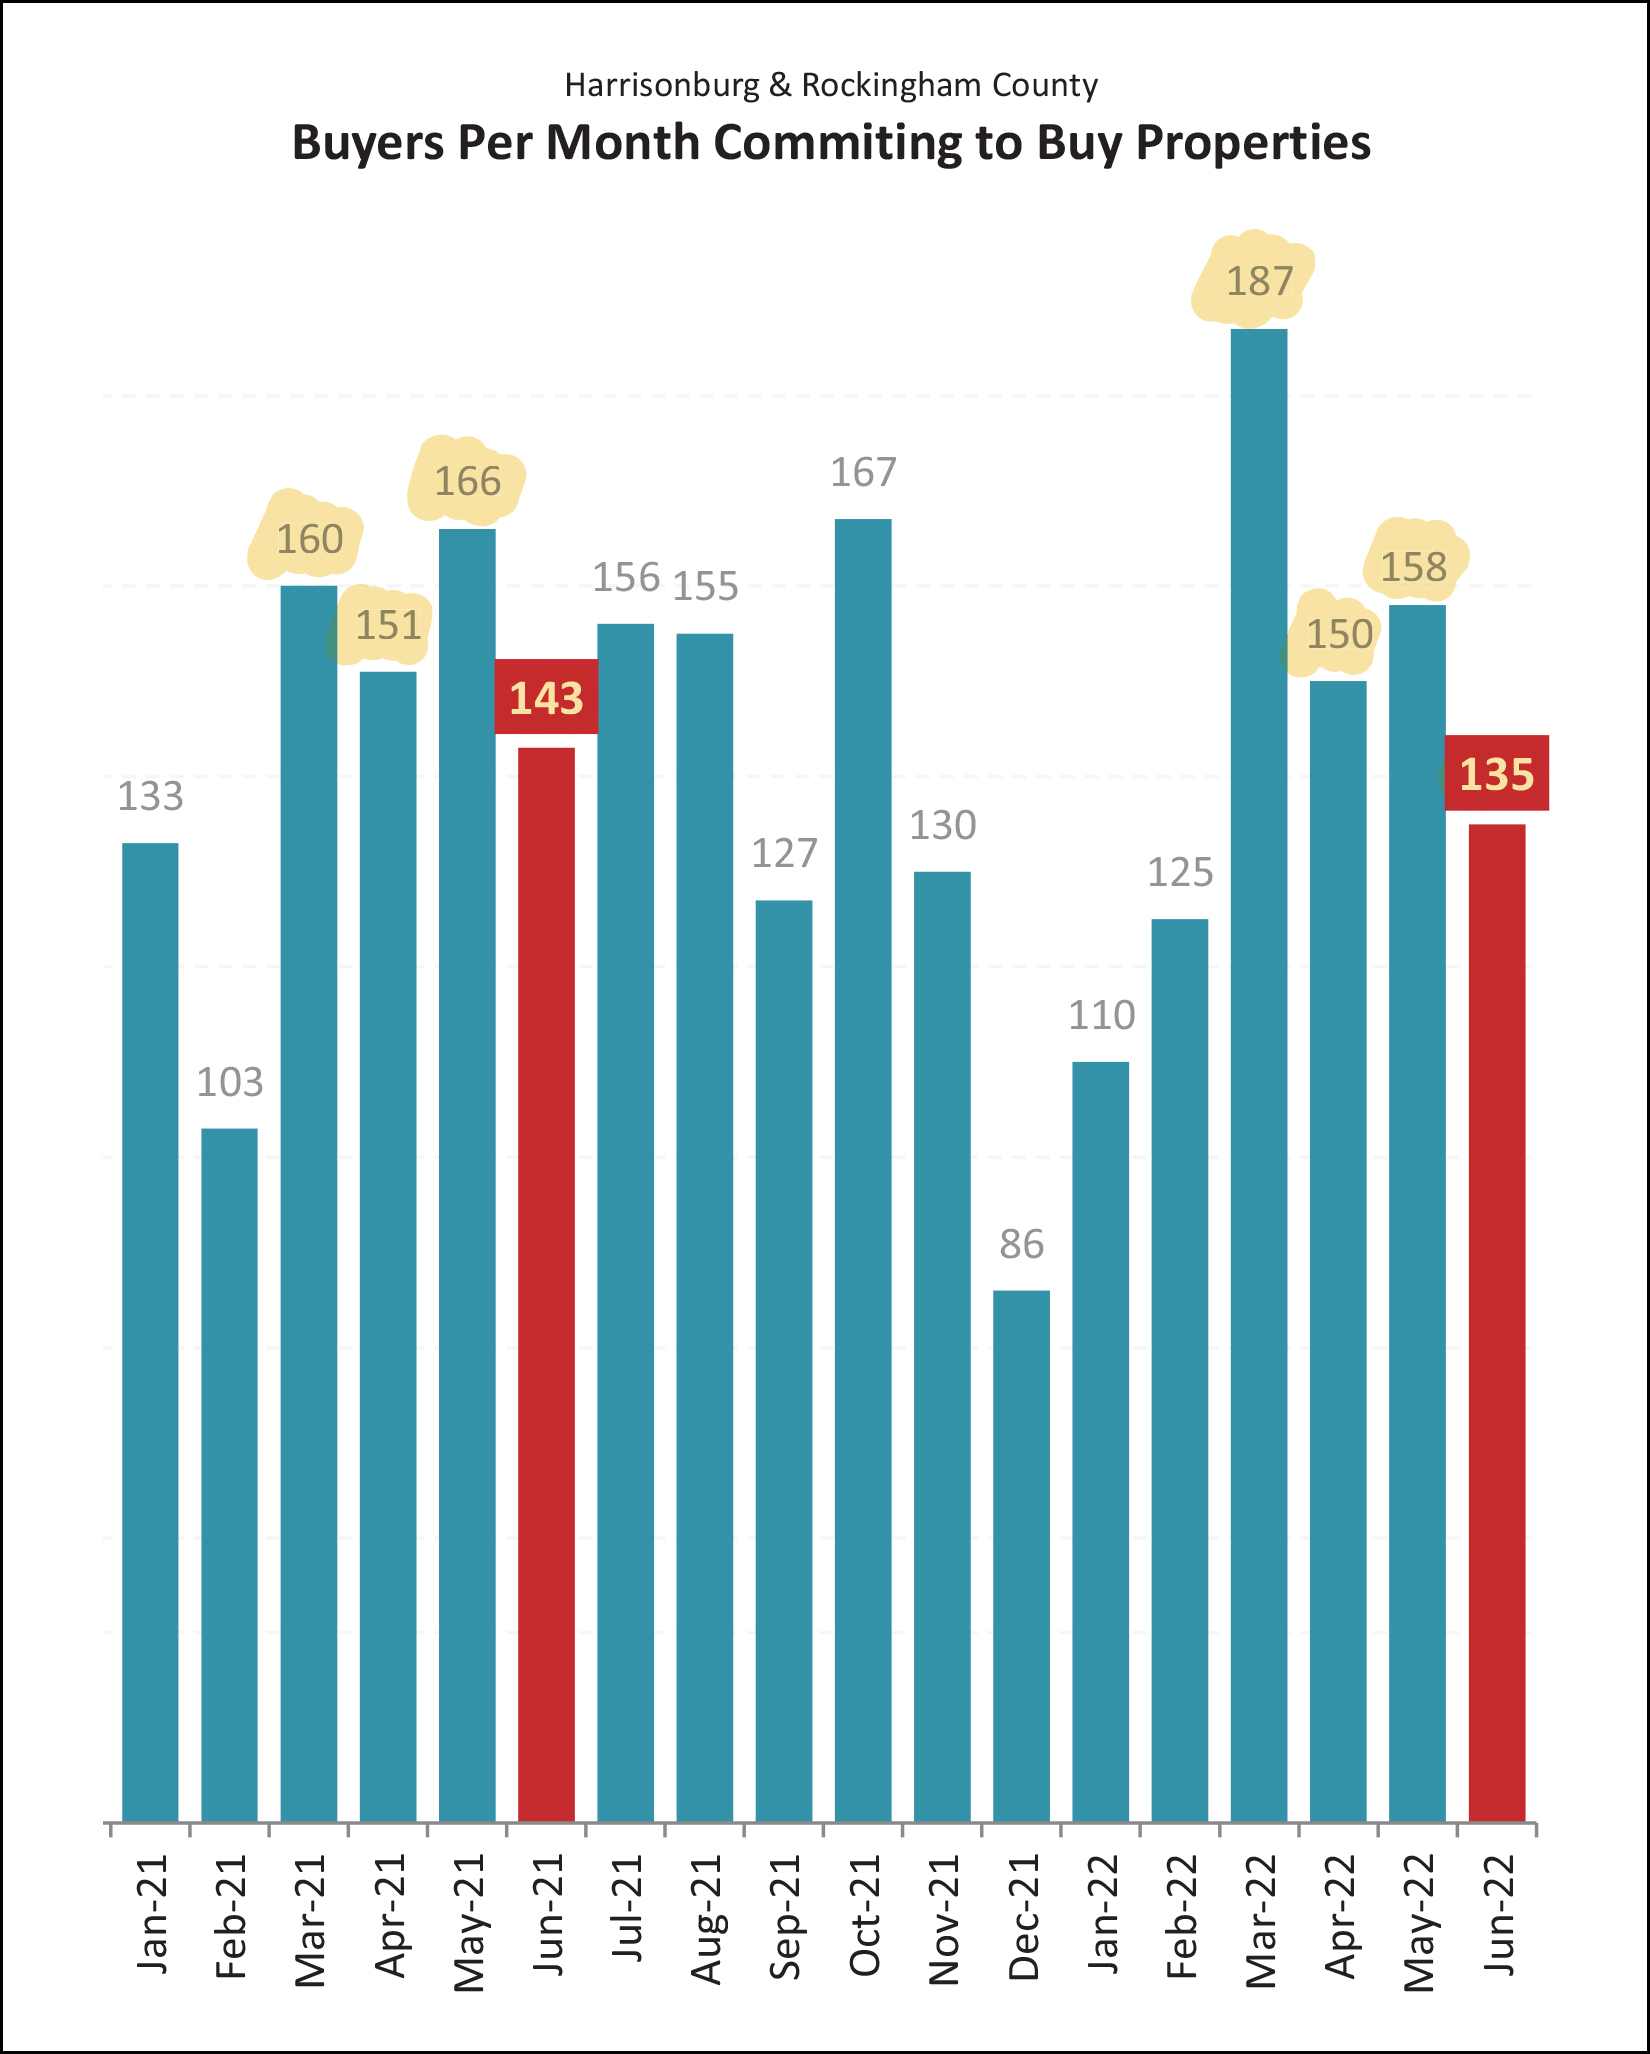 Looking at the highlighted months... [2022] We have seen 630 signed contracts in the past four months. [2021] In the same months last year, we saw 620 signed contracts. So, yes, even with *much* higher mortgage interest rates, we are seeing more buyers sign contracts to buy homes now as compared to a year ago. Is this surprising? Yes, relative to interest rates. No, relative to what seems to be a significant number of buyers who wanted to buy homes in this area in the past two years who have not yet been able to do so. In other words, demand exceeds supply. There are still lots of buyers who want to buy... even if the interest rates are higher than they were previously and higher than they would prefer. So, demand is high. How about supply? Well... 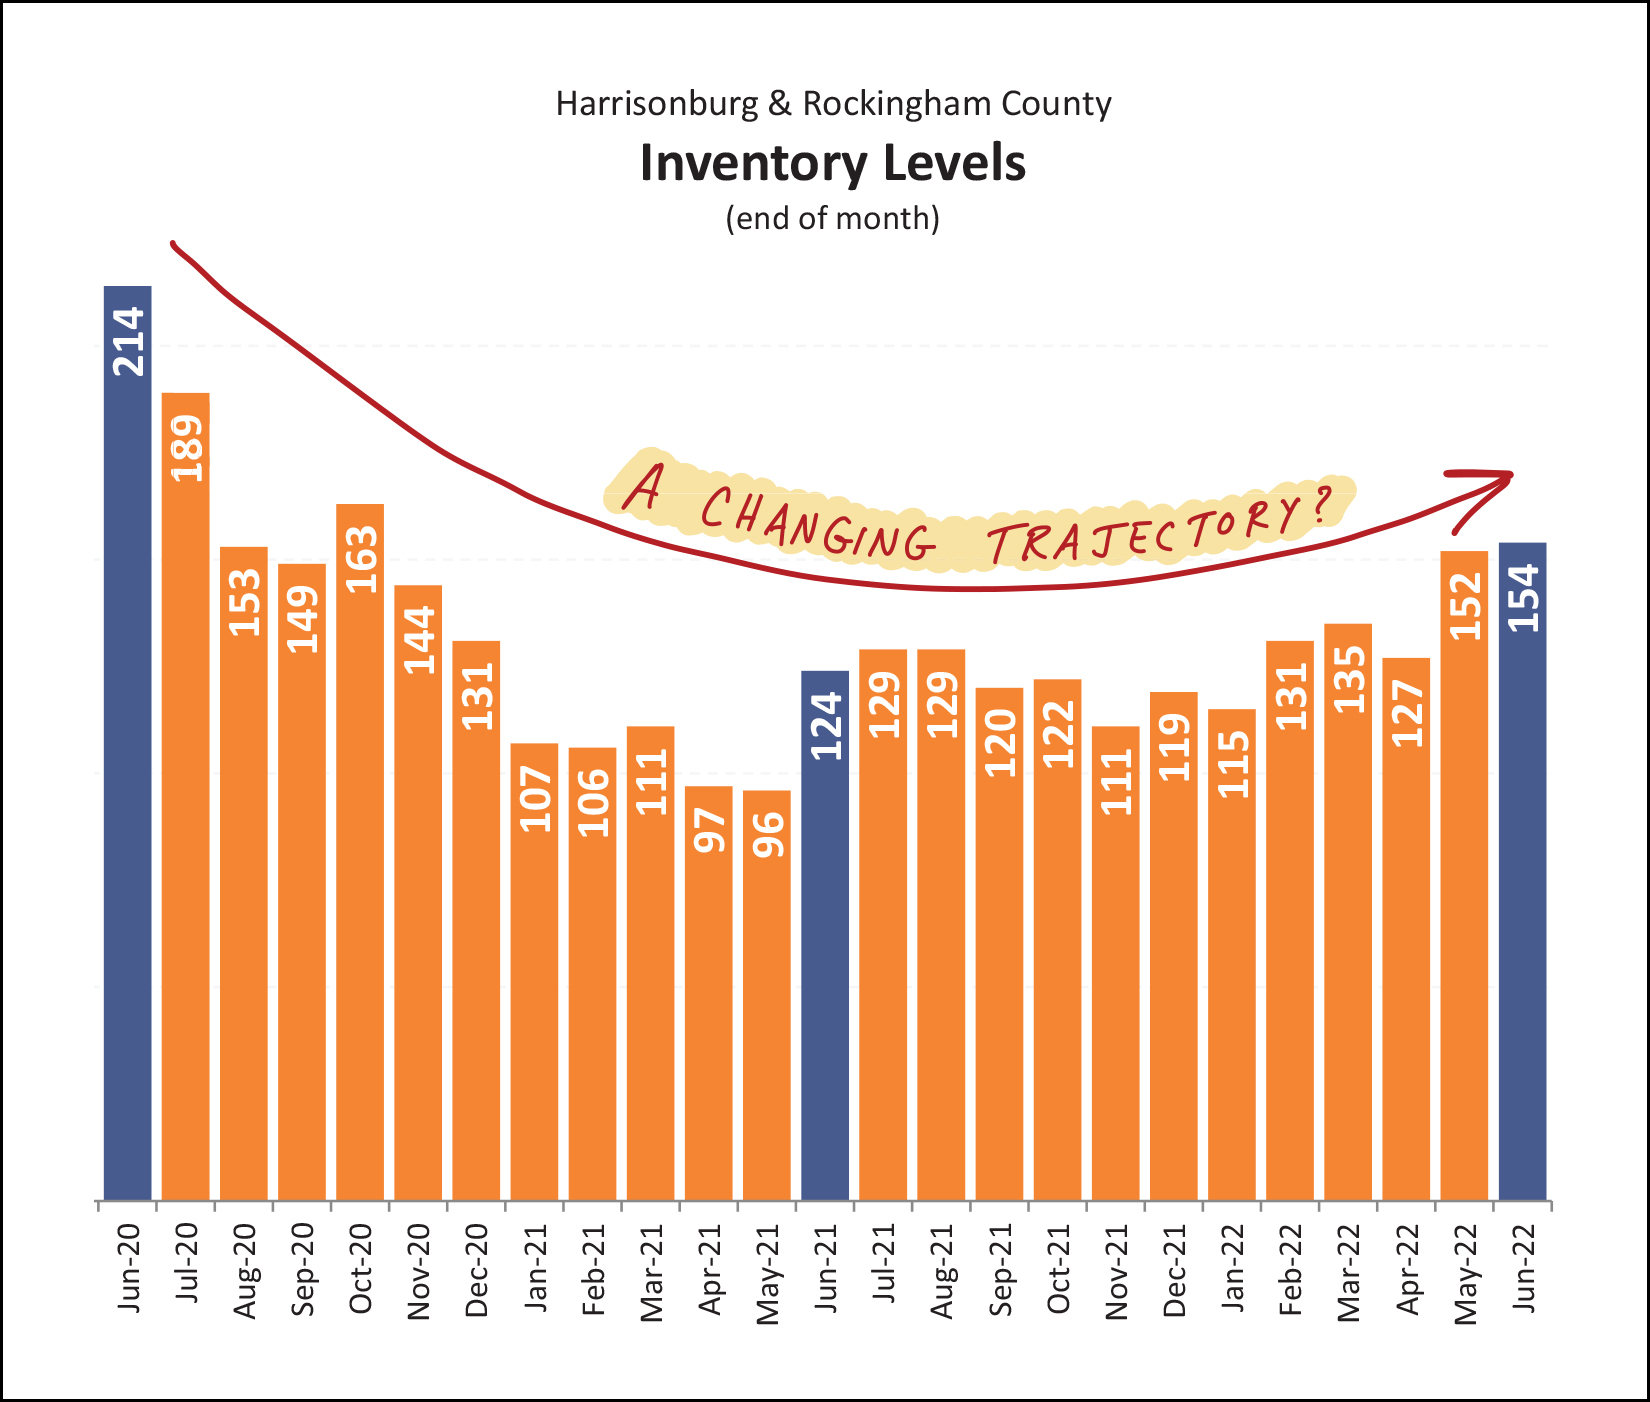 It is possible that our local housing supply is increasing, slightly. After multiple years of constantly declining inventory levels, we now seem to be seeing inventory levels increasing a bit. Sadly, these *slightly* higher inventory levels aren't evenly spread across all property types, locations and prices... so many buyers will still find inventory levels to be *quite* low in their segment of our local market. Because inventory levels are still so low in most segments of the market, we are still seeing homes selling just as quickly has they have for the past year... 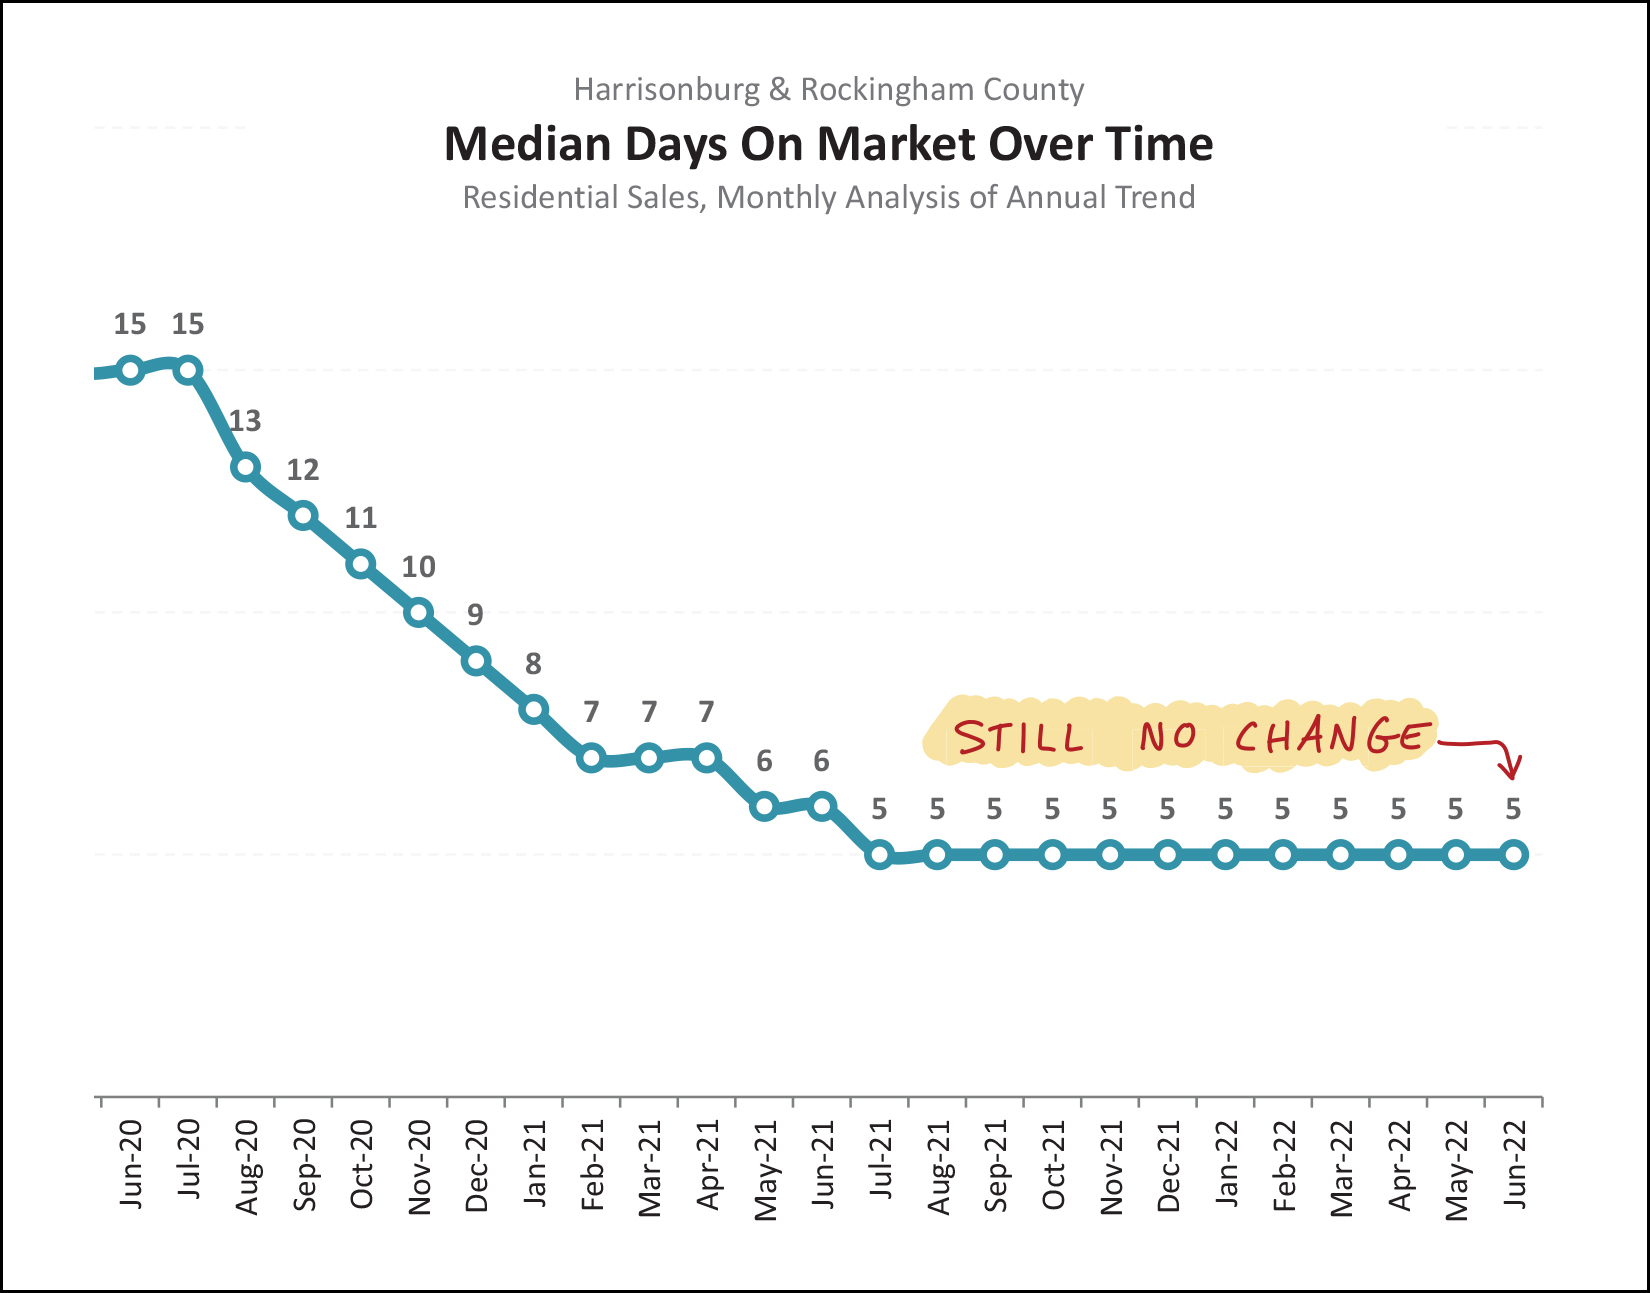 As shown above, the pace at which homes go under contract once listed (days on market) declined steadily through 2020 and 2021 until it seemed to bottom out at a median of five days on the market. That is to say that half of homes go under contract in five or fewer days... and half go under contract in five or more days. This metric hit a median of five days on the market back in July 2021 and has stayed there ever since. If or when the market starts to slow, soften or cool, we'll start to see this metric drift upward again. Finally, that one topic that isn't quite as exciting to talk about... mortgage interest rates... 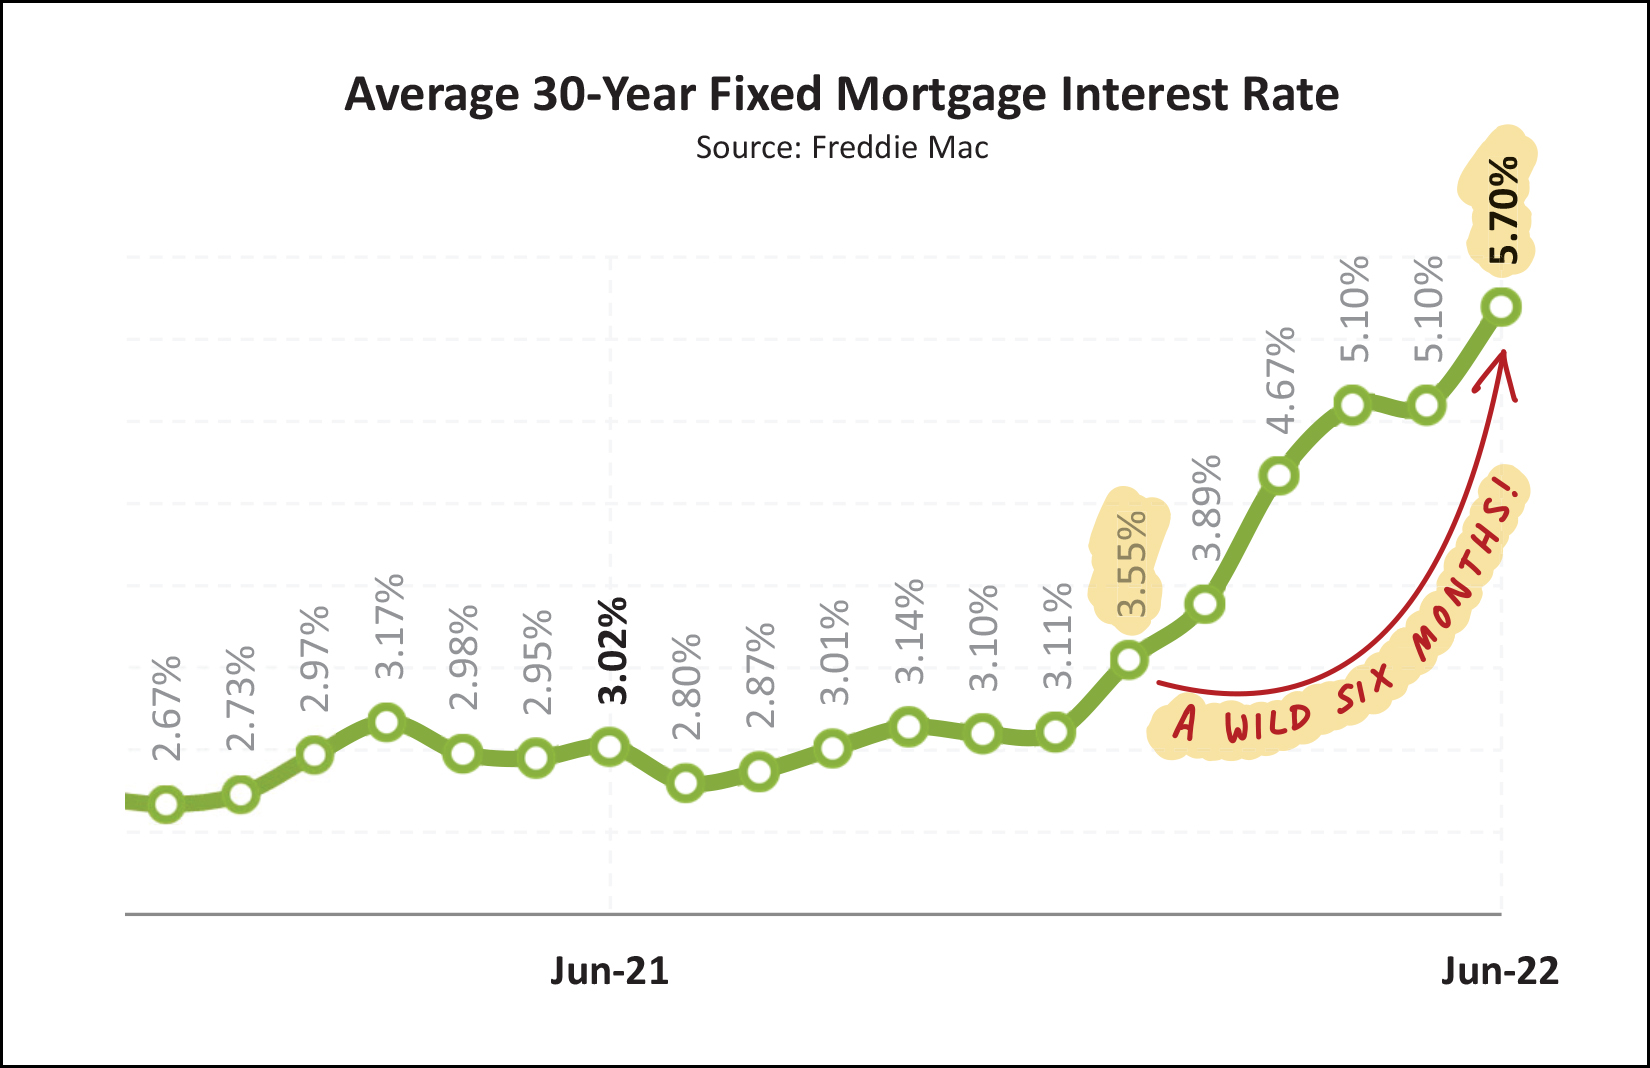 Just six months ago... the average mortgage interest rate for a 30 year fixed rate mortgage was... 3.55%. Now, it has risen all the way up to 5.7% as of the end of June. This drastically affects the monthly payment for buyers in today's market as compared to just six (or twelve, etc.) months ago. I don't think we'll see interest rates rise above 6% but it is definitely possible. If there is one thing that could cool off our local housing market, it's this "cost of money" in the form of the mortgage interest rates. But, again, it hasn't happened yet despite drastic changes in interest rates. And here we find ourselves again, at the close of what seems to be another red hot month of real estate activity in Harrisonburg and Rockingham County. By the headlines... [1] More and more home sales are selling! [2] Homes are selling at higher and higher prices! [3] Homes are selling as fast as ever! [4] Inventory levels are increasing, slightly, in some pockets of the market. [5] Mortgage interest rates are higher than they have been in years! What will we see over the next few months in our local real estate market? Most likely, more of the same... but we won't know for sure until those next few months pass... and I'll pause each month to check the numbers and share some thoughts with you so that we can all have a good sense of where we have been, where we are and where we might be going next. Speaking of next... If you are planning to SELL a house in the next few months, sooner is likely better than later, and I'd be delighted to chat with you about how we might work together. If you are planning to BUY a home in the next few months, you ought to check in with your lender sooner rather than later to get proper expectations of your potential mortgage payments within the context of rising mortgage interest rates... and yes, I'd be delighted to help you with buying as well. Be in touch at any point if I can be of any help to you or your family or friends. You can call/text me at 540-578-0102 or email me here. Until next month... may your summer be as relaxing as this crazy real estate market can be stressful! ;-) | |
An Early Look At June 2022 Home Sales |
|
 As mortgage interest rates rise, many continue to wonder whether it will significantly slow down the amount of home buying activity we are seeing in our local market. It's a reasonable thing to wonder about. Here's a quick preview of how things went last month (June 2022) compared to the same month a year ago... June 2021 Mortgage Interest Rate at Start of Month = 2.99% Closed Home Sales in Harrisonburg & Rockingham County = 175 Contracts Signed = 143 June 2022 Mortgage Interest Rate at Start of Month = 5.09% Closed Home Sales in Harrisonburg & Rockingham County = 168 Contracts Signed = 129 Conclusions By the numbers... there were 4% fewer home sales this June compared to last June... and 10% fewer contracts. So, maybe (?) things are slowing down, a bit? That said, in many months over the past few years home sales seem to be constrained by the number of sellers willing to sell, and not so much the number of buyers interested in buying. Stay tuned for further updates as I take a fuller look at the market over the coming week. | |
City Townhouse Sales Prices Increase 34% Over Four Years |
|
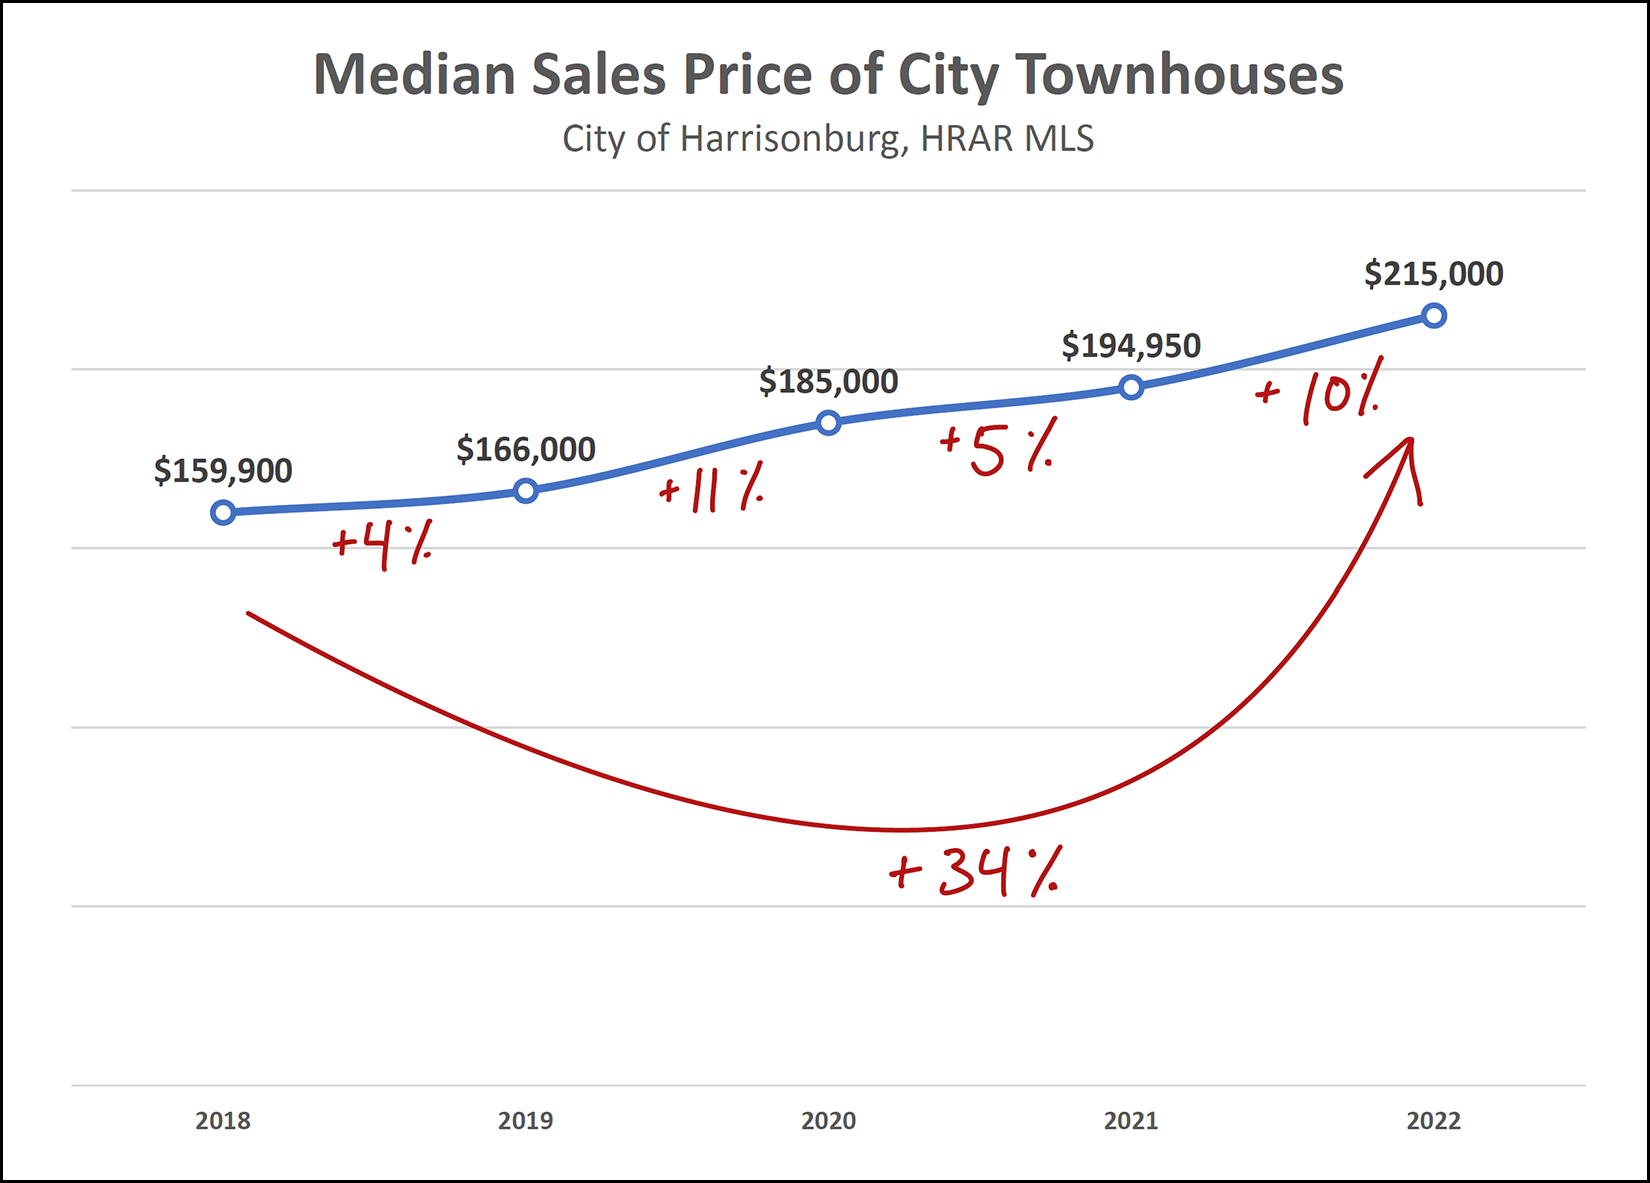 Townhouse values in the City of Harrisonburg have certainly increased rather quickly over the past few years... As shown above, we have seen a 4% to 11% increase in median sales prices for each of the past four years. There has been an overall 34% increase in the median sales price since 2018. If you happened to buy a townhouse a few years ago, you'll likely be in great shape if you're selling now or soon! Also helping this segment of our local housing market is that most new townhouses are now in the $250K+ price range. | |
Are We Seeing A Big Slow Down In Home Sales Activity Locally? |
|
 If you read much national news you'll see plenty of headlines that say the housing market is slowing down... the housing market peaked... slower times are ahead for housing markets across the country. I'm sure that is all true, generally, nationally, and maybe in many markets. But, real estate is and has also been, local. Will the pace of home sales slow down in our local market? Maybe so. Will prices stop climbing as much as they have been in recent years? Maybe so. Are either of those things happening yet? Are we seeing a big slow down in home sales activity locally? It seems not. Properties going under contract in the past 30-ish days (April 25 - May 24) this year compared to last... Last Year = 170 contracts This Year = 162 contracts If things start changing in our local market, I'll be certain to be writing about it here... but just because you're reading it in the national news doesn't mean it is necessarily happening in Harrisonburg and Rockingham County. | |
Sales of Not New Homes Are Increasing Too |
|
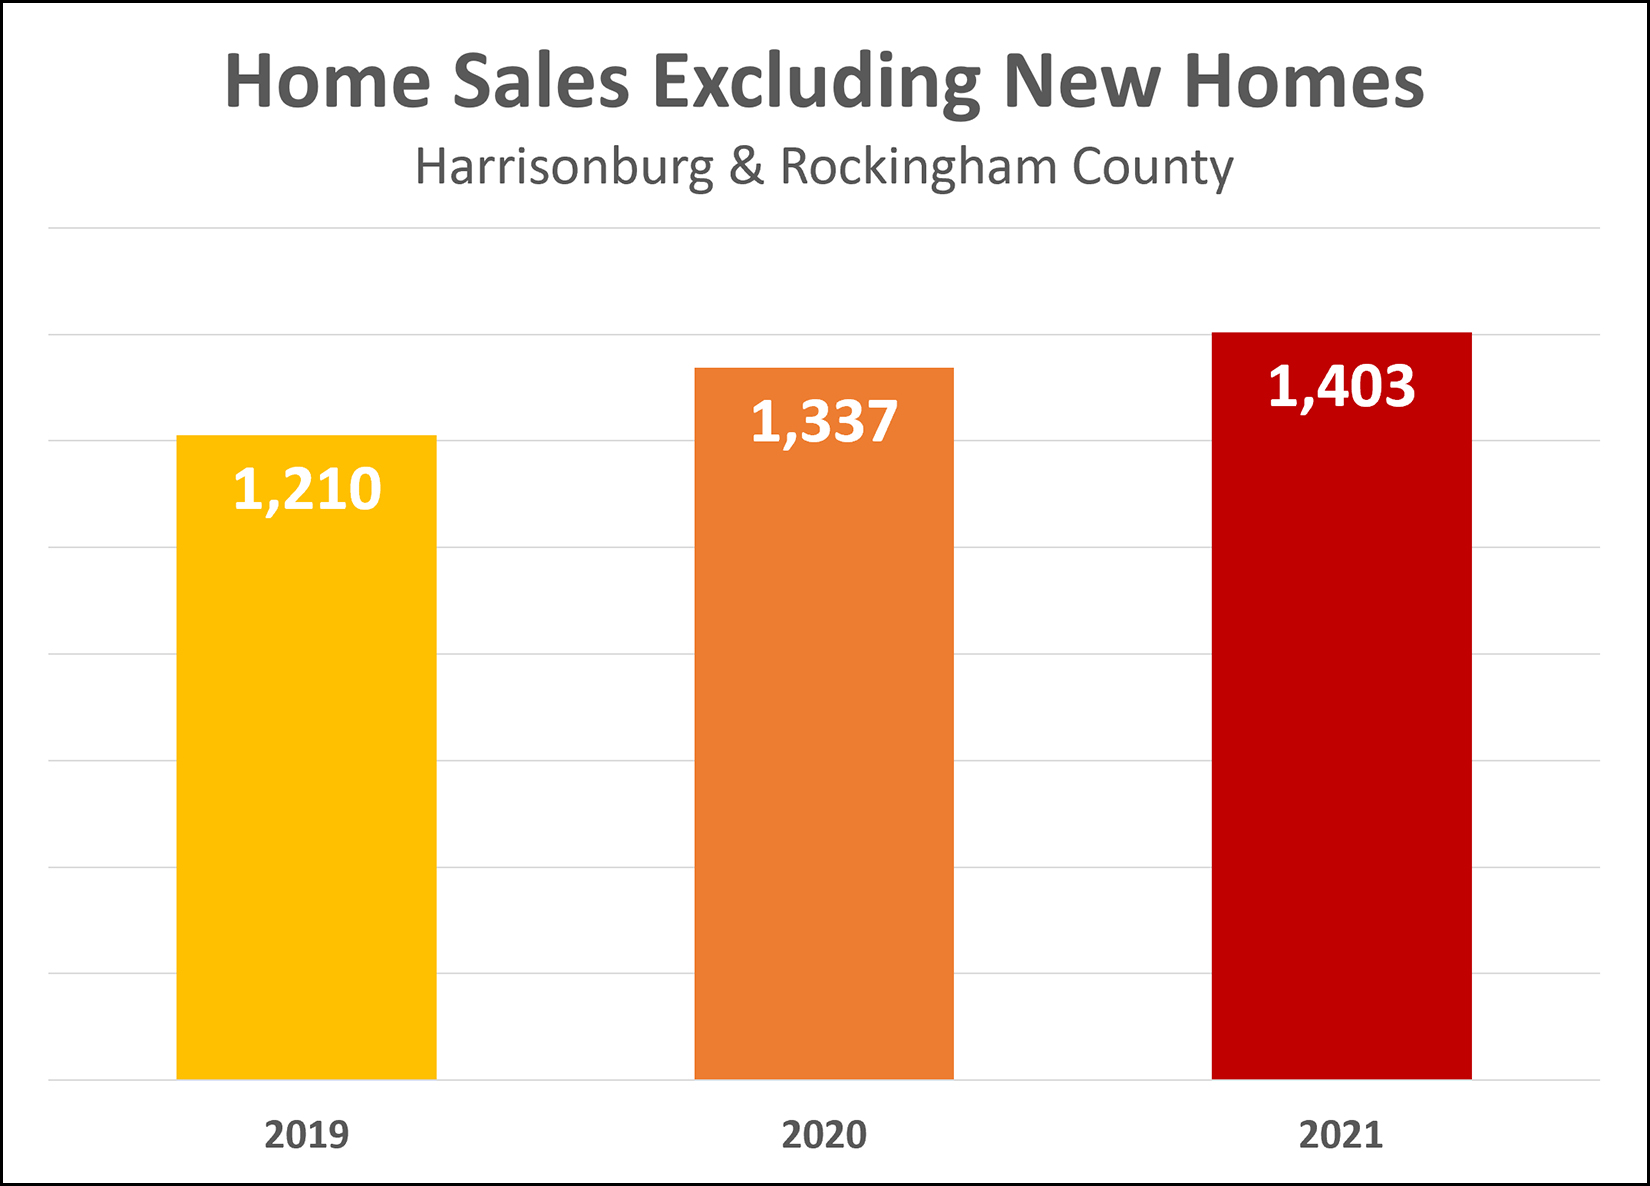 What do we call homes that are not new homes? Resale homes? Used homes? Existing homes? Previously owned homes? :-) Last week I pointed out that we are seeing a rapid increase in the sale of new homes in our market... a 39% increase in 2020 and a 68% increase in 2021. One might have thus wondered if ALL of the increases in our local area home sales can be attributed to new home sales. Well, the answer seems to be... no. As shown above, sales of not-new homes are increasing as well... a 10% increase in 2020 and a 5% increase in 2021. | |
Inventory Levels Have Been Dropping For Almost An Entire Decade |
|
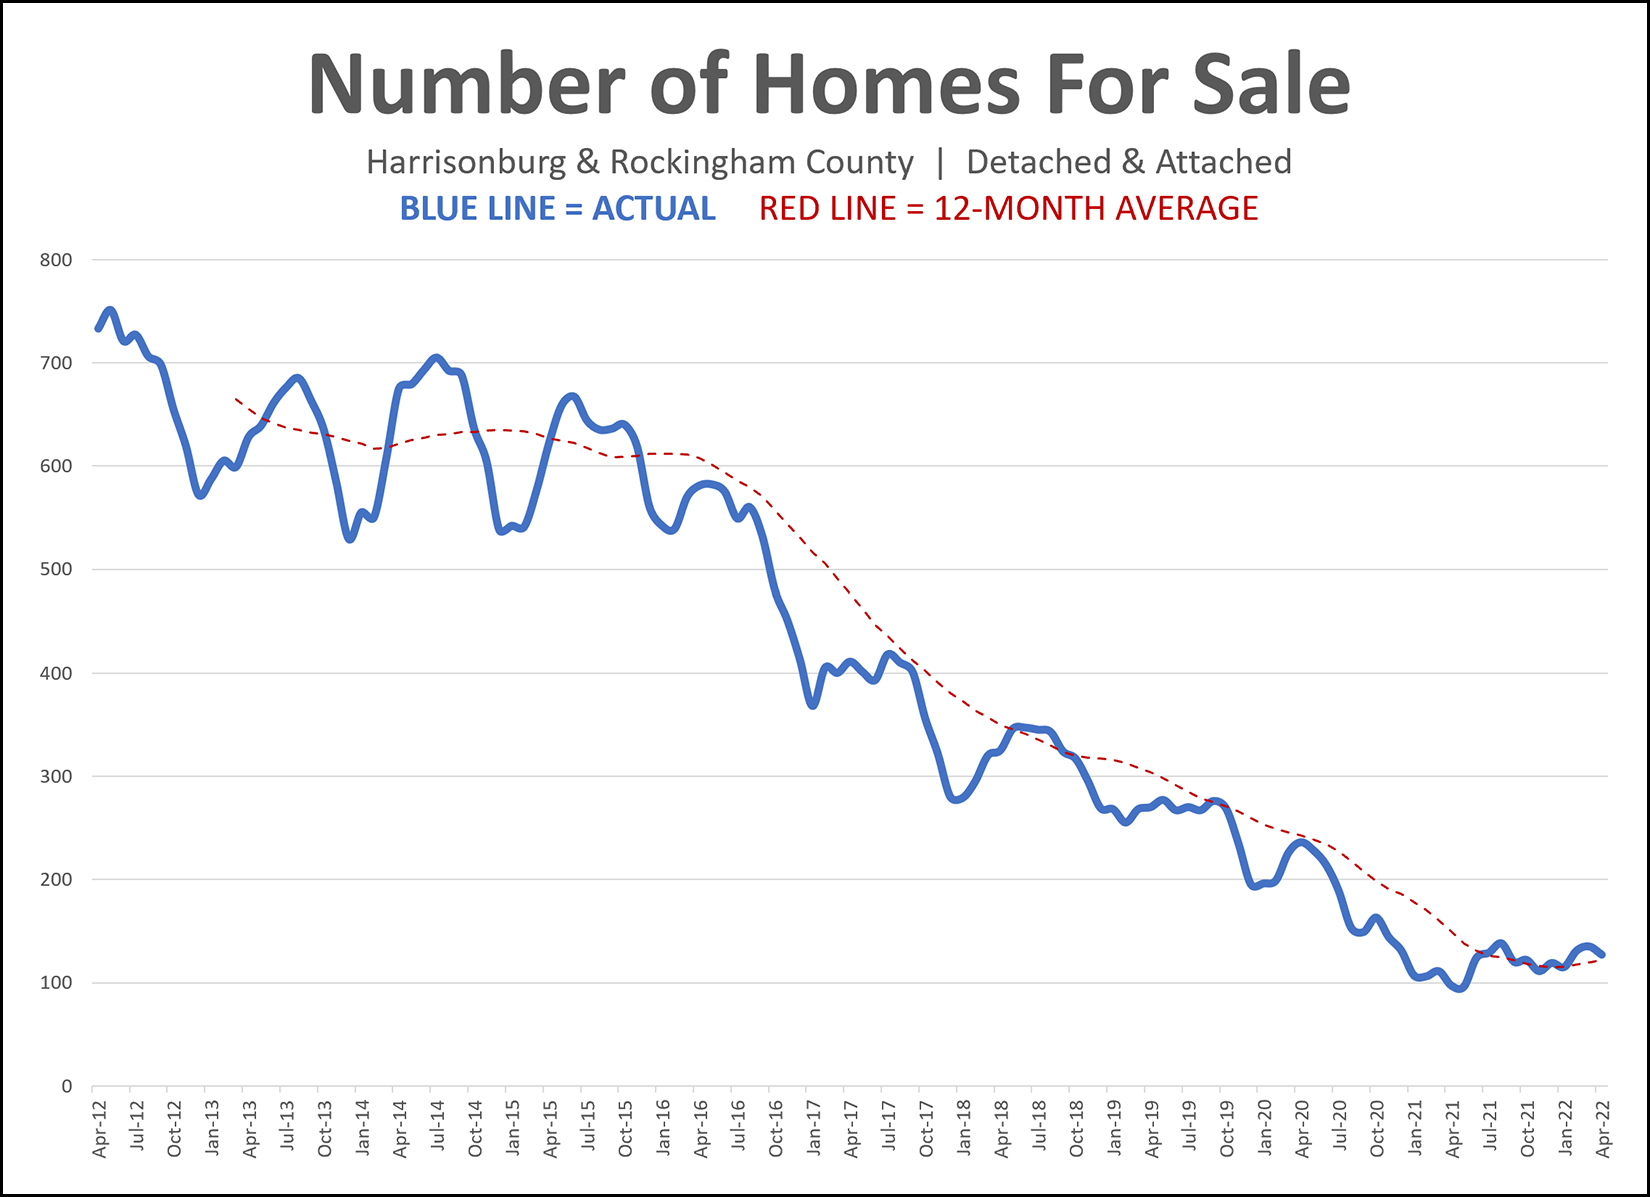 At the end of last month there were only 127 homes for sale in Harrisonburg and Rockingham County. Five years ago, at the end of April 2017, there were 411 homes for sale. Five years before that, at the end of April 2012, there were 733 homes for sale. Home buyers over the past year have had fewer options of what to buy at any given point in time than ever before in the past decade, and possibly ever before, ever. The low inventory levels don't mean fewer buyers are buying -- in fact, more buyers are buying on an annual basis than ever before. The low inventory levels are an indication that there is much more buyer demand than seller supply, so new listings get scooped up (go under contract) within a matter of days -- thus, not contributing to the inventory levels at the end of the month. | |
Generally Speaking, The Larger The Home, The Lower The Price Per Square Foot |
|
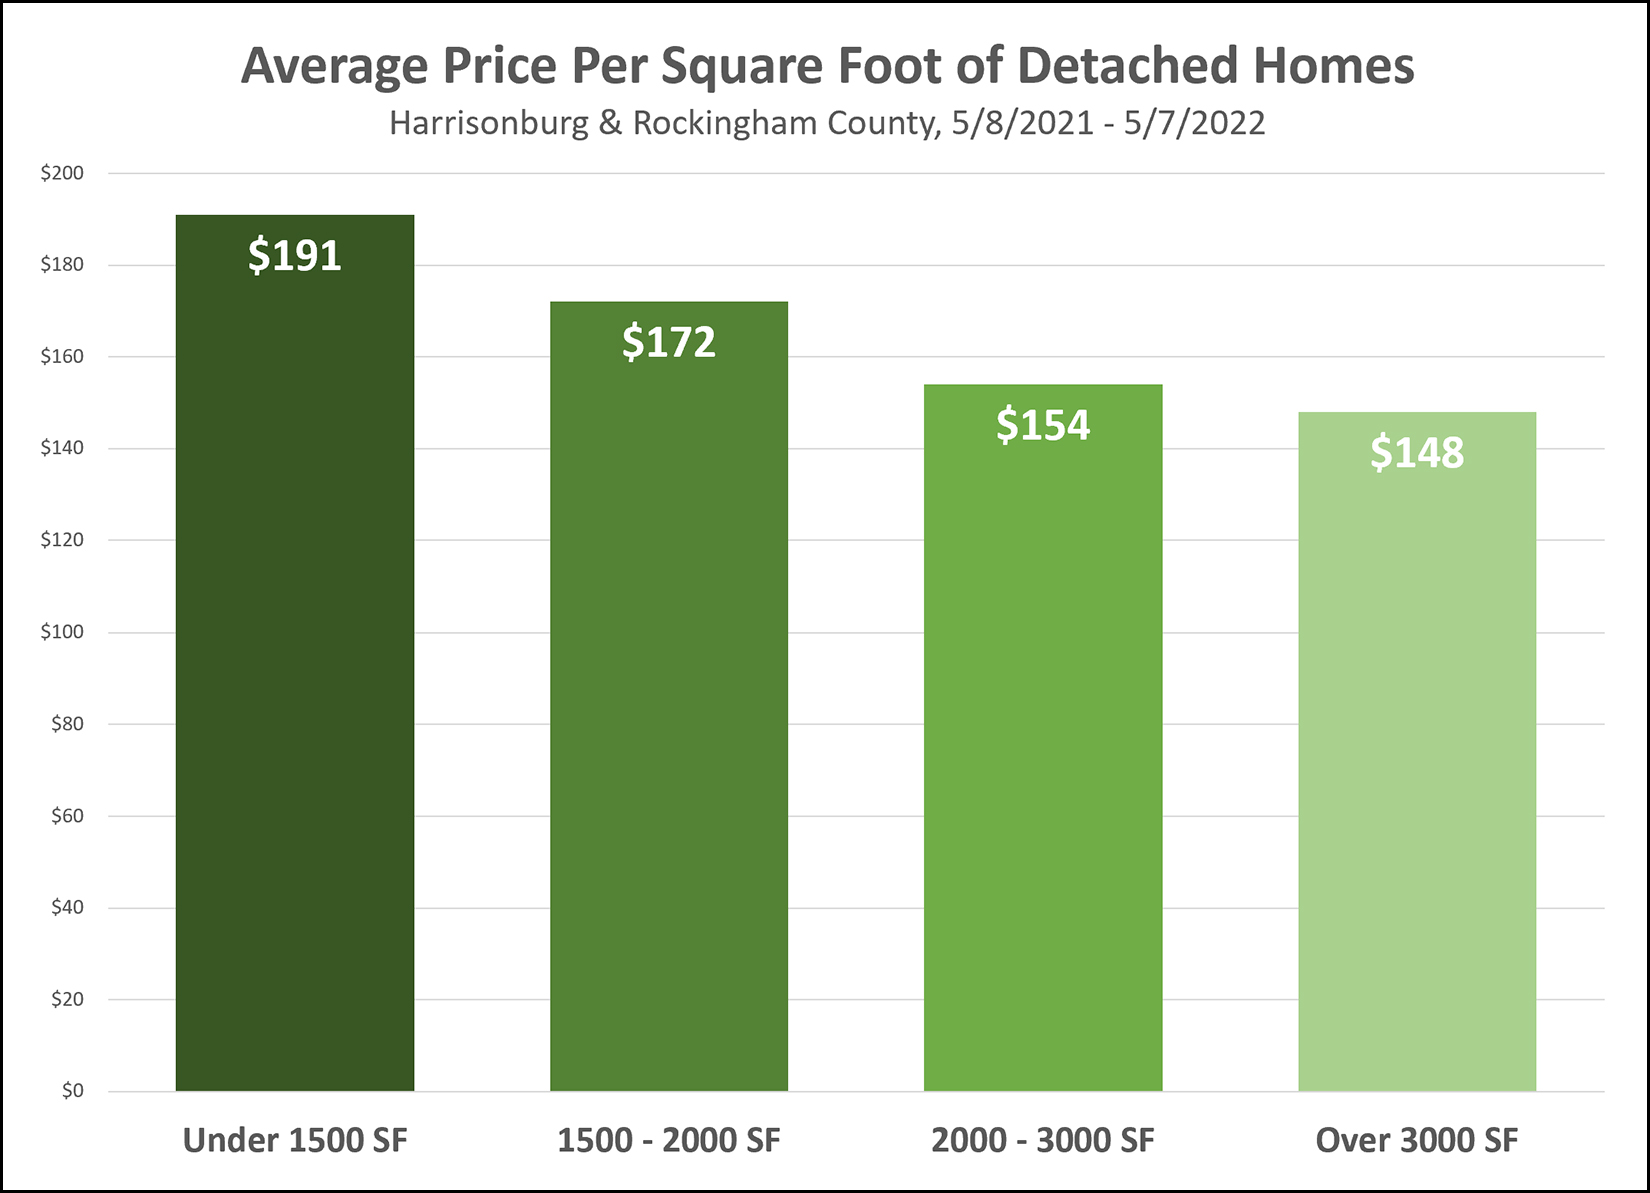 If all other attributes of two houses are the same or similar (age, condition, finishes, location, lot size) then we will almost always see the price per square foot being lower for the larger of the two houses if there is a decent difference in the sizes of the two houses. Stated differently, if we look at five homes that have sold in a neighborhood and we find the following... House 1 = 2,000 SF and sold for $168/SF ($336,000) House 2 = 2,050 SF and sold for $167/SF ($342,350) House 3 = 1,985 SF and sold for $168/SF ($333,480) House 4 = 2,025 SF and sold for $169/SF ($342,225) House 5 = 2,003 SF and sold for $167/SF ($334,501) ...and then if we looked at a sixth house in the neighborhood that is 3,000 SF, would it be reasonable to calculate the average price per square feet of the first five houses and then use that to calculate the value of the sixth house? Average PPSF of First Five Houses = $167.80 / SF Projected Value of Sixth House = 3,000 SF x $167.80 / SF = $503,400 So... is that reasonable? Will this sixth house sell for $503,400 while surrounded by houses that are selling for $330K to $345K? Probably not. Generally speaking, the larger the home, the lower the price per square foot. Thus, we can't reasonable use the PPSF of smaller homes to accurately predict the home value of a larger home. A seller would love to use the logic above to conclude that their home is worth $503,400 but buyers (and an appraiser) are not likely to agree. The reverse is also true... we can't use the PPSF of larger homes to predict the value of a smaller home. House 1 = 3,000 SF and sold for $152/SF ($456,000) House 2 = 3,050 SF and sold for $151/SF ($460,550) House 3 = 2,985 SF and sold for $150/SF ($447,750) House 4 = 3,025 SF and sold for $151/SF ($456,775) House 5 = 3,003 SF and sold for $151/SF ($453,453)...and then if we looked at a sixth house in the neighborhood that is 2,100 SF, would it be reasonable to calculate the average price per square feet of the first five houses and then use that to calculate the value of the sixth house? Average PPSF of First Five Houses = $151 / SF Projected Value of Sixth House = 2,100 SF x $151 / SF = $317,100 So... is that reasonable? Will this sixth house sell for $317,100 while surrounded by houses that are selling for $445K - $465K? Probably not. Generally speaking, the smaller the home, the higher the price per square foot. Thus, we can't reasonable use the PPSF of larger homes to accurately predict the home value of a smaller home. There is a place for using price per square foot for analyzing home value... but it depends on most attributes of all of the homes being very similar... location, age, lot size, finishes, and yes, square footage! | |
If Home Sales Are Going To Slow, April Did Not Show It |
|
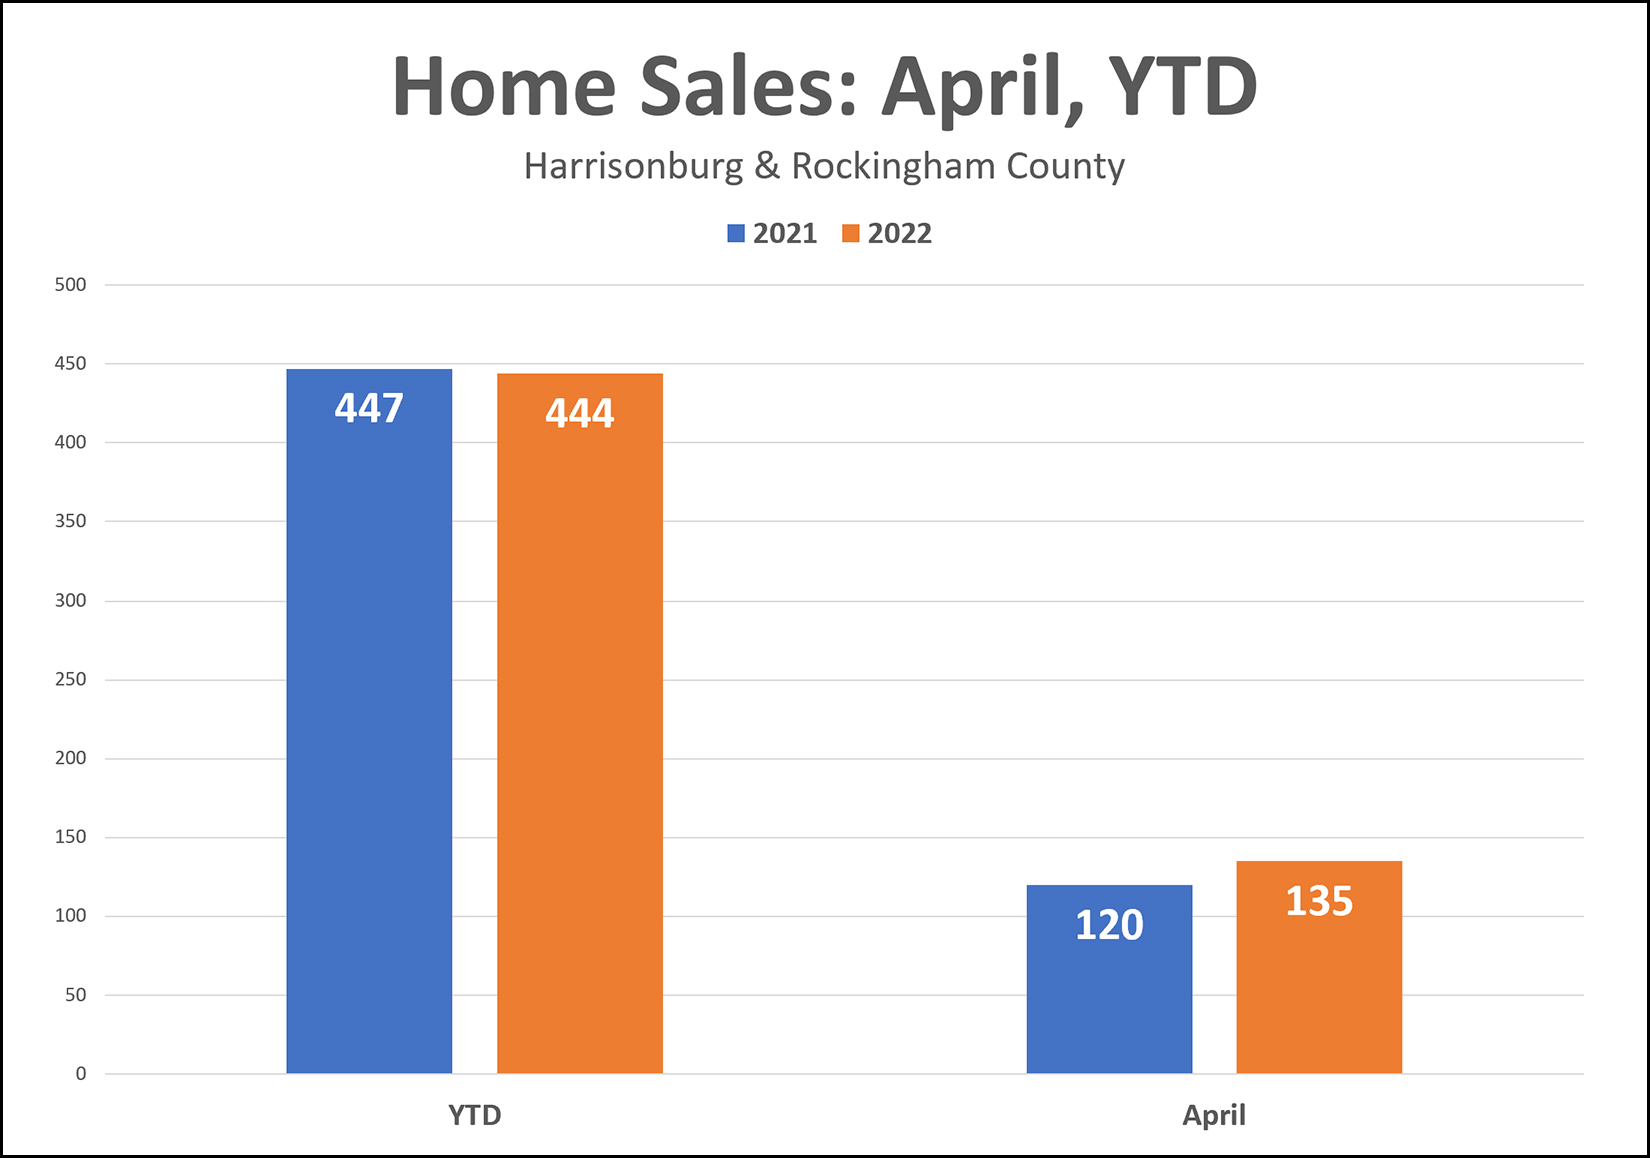 Many wonder or suspect if home sales will slow in 2022 because of rising mortgage interest rates. That is certainly just one of the reasons why home sales could slow -- they could also slow because there aren't enough homeowners willing to sell their homes. Low supply = slow sales. Above, you'll see that we've seen just about the same number of home sales this year as last year during the first four months of the year. Furthermore, home sales this April were stronger than last April!? Finally, there are likely still some April home sales that closed this past Friday that aren't showing up in the MLS yet. So... if home sales are really going to slow down in 2022, it doesn't seem that April sales figures are showing that. Maybe things will slow down in May? Or maybe not! | |
Is FOMO Fueling Rising Home Prices? |
|
 The Federal Reserve Bank of Dallas indicates that there are signs of a brewing housing bubble... and FOMO (fear of missing out) might be a contributing factor. You'll find the article from the Dallas Fed and some accompanying graphs here... Some summary points from that article... [1] If lots of home buyers believe current, large, housing price increases will continue, further and stronger buying can be fueled by FOMO - the fear of missing out - which can drive prices up even further. [2] The Dallas Fed calls this phenomenon described above "expectations-driven explosive appreciation" or "exuberance" and it seems to be happening in many housing markets right now. [3] The U.S. housing market has shown signs of exuberance for more than five consecutive quarters. [4] Since the beginning of 2020 there has been a divergence between home prices and rental rates... home prices have been going up much more quickly than rental rates. [5] Much of the data the Dallas Fed analyzed shows signs of "abnormal U.S. housing market behavior" -- which probably is not a surprising descriptor for anyone who has been in the market (buying or selling) over the past few years. [6] Factors contributing to the abnormal market behavior seem to include historically low interest rates, pandemic-related fiscal stimulus programs, Covid-19-related supply-chain disruptions among other factors. So, that was most of the worrisome parts of the article, but this little paragraph towards the end is somewhat of a reassuring finale... "Based on present evidence, there is no expectation that fallout from a housing correction would be comparable to the 2007-09 Global Financial Crisis in terms of magnitude or macroeconomic gravity. Among other things, household balance sheets appear in better shape, and excessive borrowing doesnât appear to be fueling the housing market boom." So... it's possible that there is a housing bubble (though every local market is different and will behave differently) and if there is a bubble, prices could flatten out or decline, but if they do it doesn't seem likely that it will have the same impact as the 2007-09 housing and financial crisis. Happy Monday!? ;-) P.S. Read the actual article yourself... it has some great additional commentary and context... | |
Real Estate Tax Rates Moving Up and Down |
|
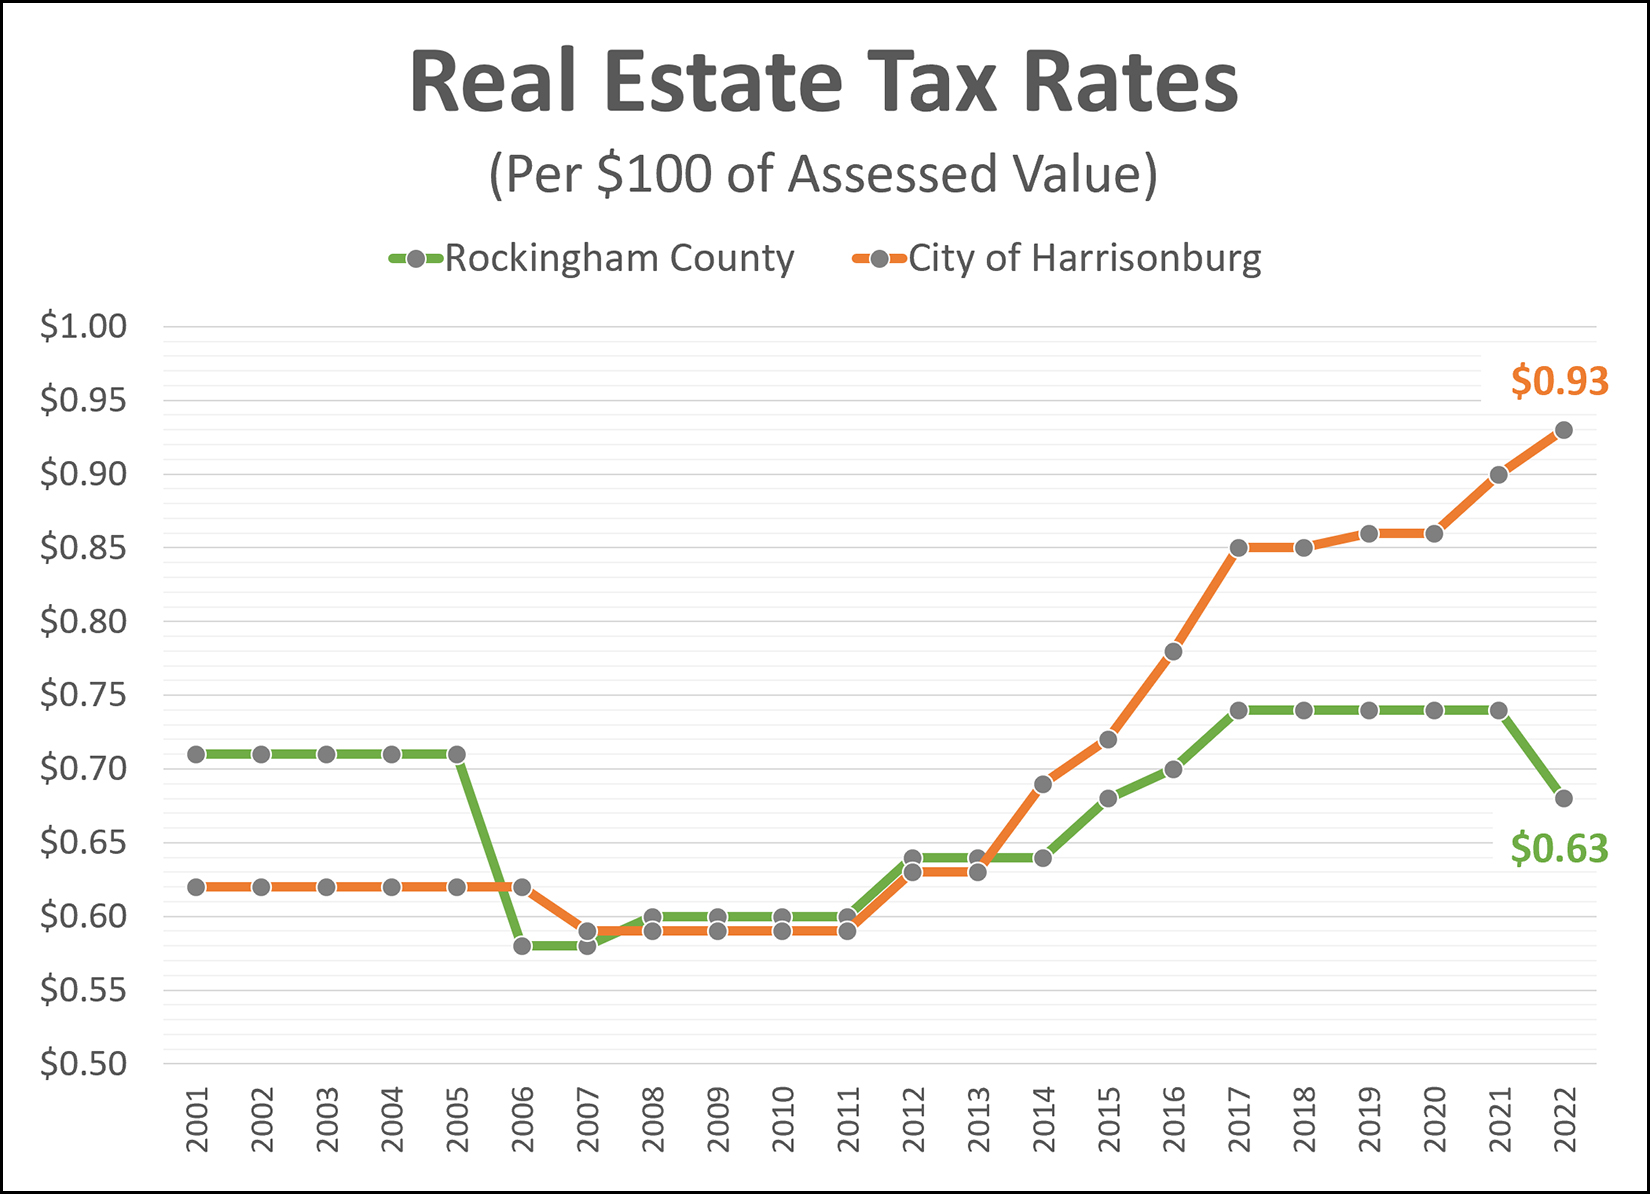 Rockingham County - tax rate down 8% The Rockingham County real estate tax rate is currently $0.74 per $100 of asssessed value, but the Board of Supervisors just approved a reduction in the tax rate to $0.68 per $100 of assessed value. But... that is in the context of recently updated tax assessed value for all properties in Rockingham County, most of which increased significantly because the last reassessment took place four years ago before significant shifts in market values in this area. As a result, most Rockingham County property owners will see an increase in their tax bill despite the reduction in the tax rate. City of Harrisonburg - tax rate up 3% (pending approval) The Harrisonburg City Council will soon consider increasing the tax rate from $0.90 per $100 of assessed value to $0.93 per $100 of assessed value. The City of Harrisonburg updates their assessed values every year, so while many or most property owners recently received notice of the updated assessed value of their property, those values likely did not increase as drastically as assessed values did in Rockingham County. As a result, almost all City of Harrisonburg property owners will see an increase in their tax bill because though small increases, their assessed value and tax rate are both likely to have gone up or to go up. | |
Current Mortgage Interest Rates in the Context of the Past Decade |
|
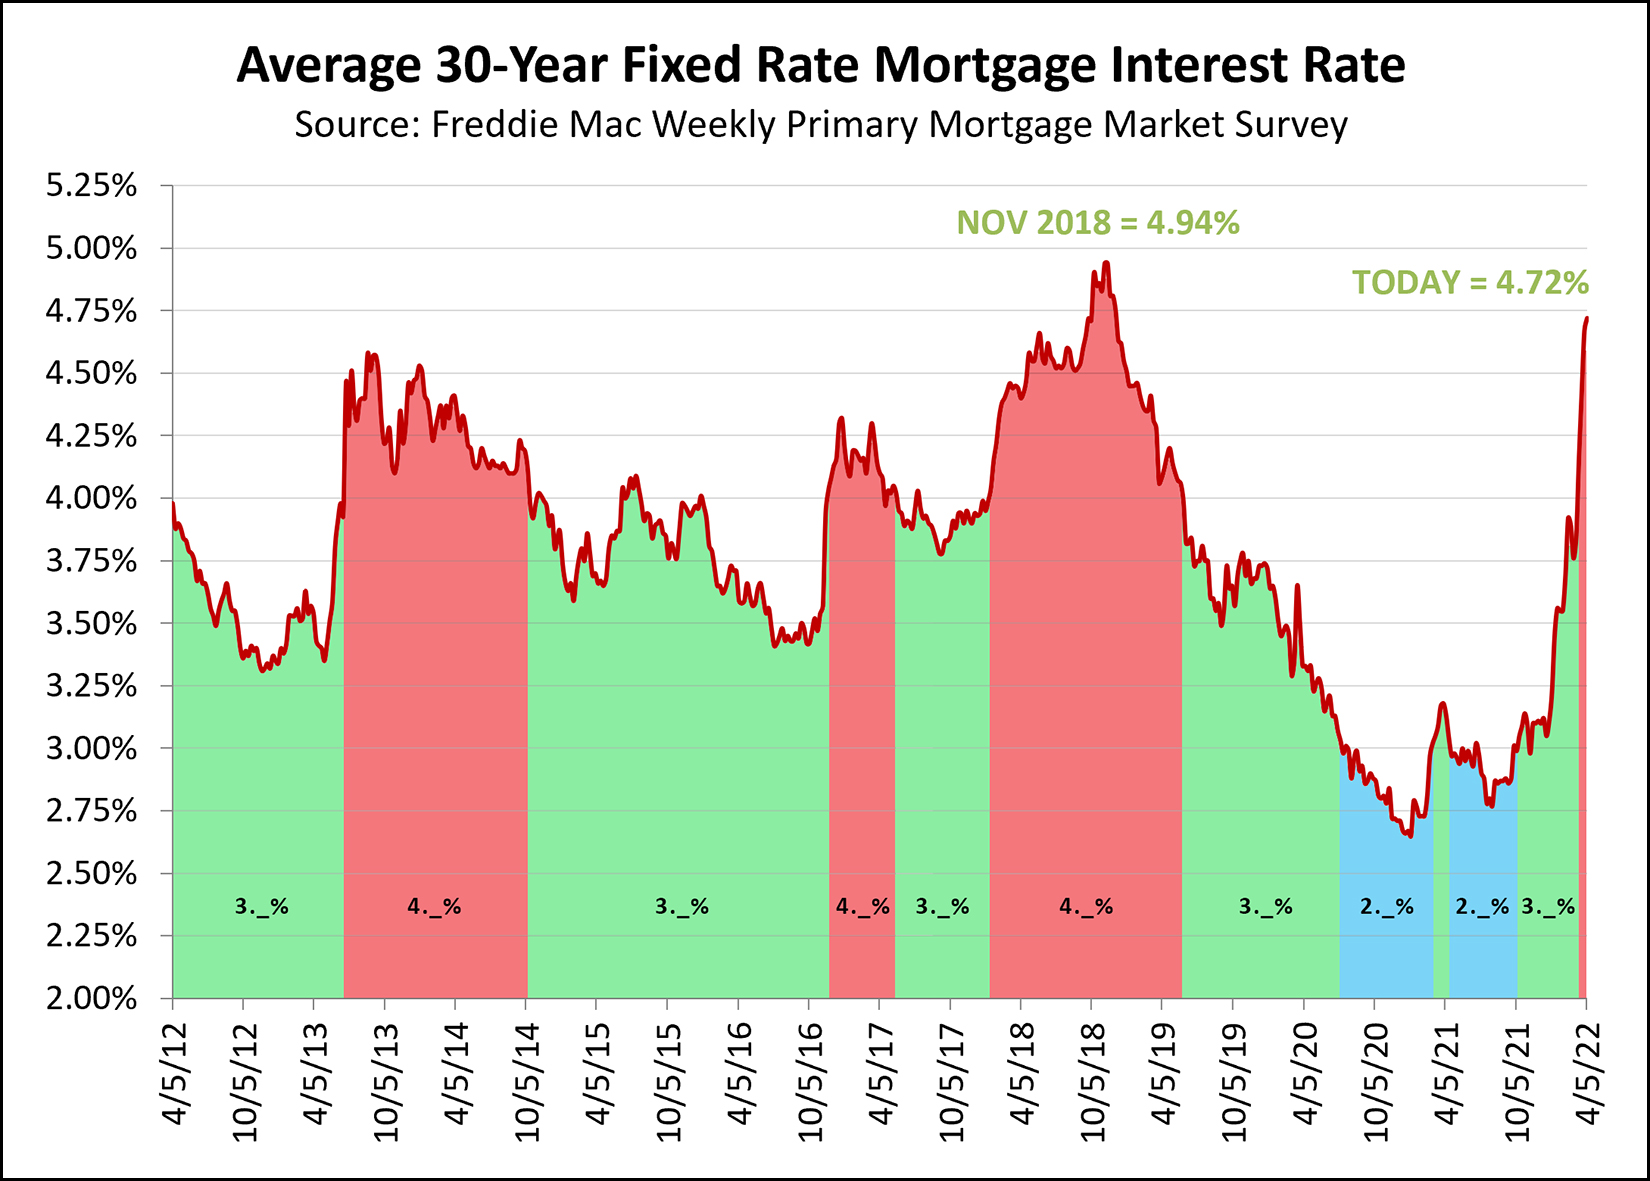 Mortgage interest rates keep on rising. The graph above shows the average mortgage interest rate over the past decade. Periods of Green = 3._% (somewhere between 3% and 4%) Periods of Red = 4._% (somewhere between 4% and 5%) Periods of Blue = 2._% (somewhere between 2% and 3%) A few resulting observations... [1] We're getting ready to pop over 4.75%, it seems, which we've seen once (for a few months) in late 2018. [2] We might be headed all the way up towards 5%, which we haven't seen at all in the past ten years. [3] While we've spent most of the past decade below 4% (green+blue) we have certainly also seen long spells above 4% (red) as well. [4] We moved pretty quickly from 2._% to 3._% to 4._% and it almost seems like 5._% could be knocking on the door. As mortgage interest rates rise, monthly mortgage payments (for new buyers) rise, which certainly creates the possibility that at some point rapidly rising home prices won't be rising quite as rapidly. | |
More Contracts Were Signed In March 2022 Than In Any Month In The Past Decade |
|
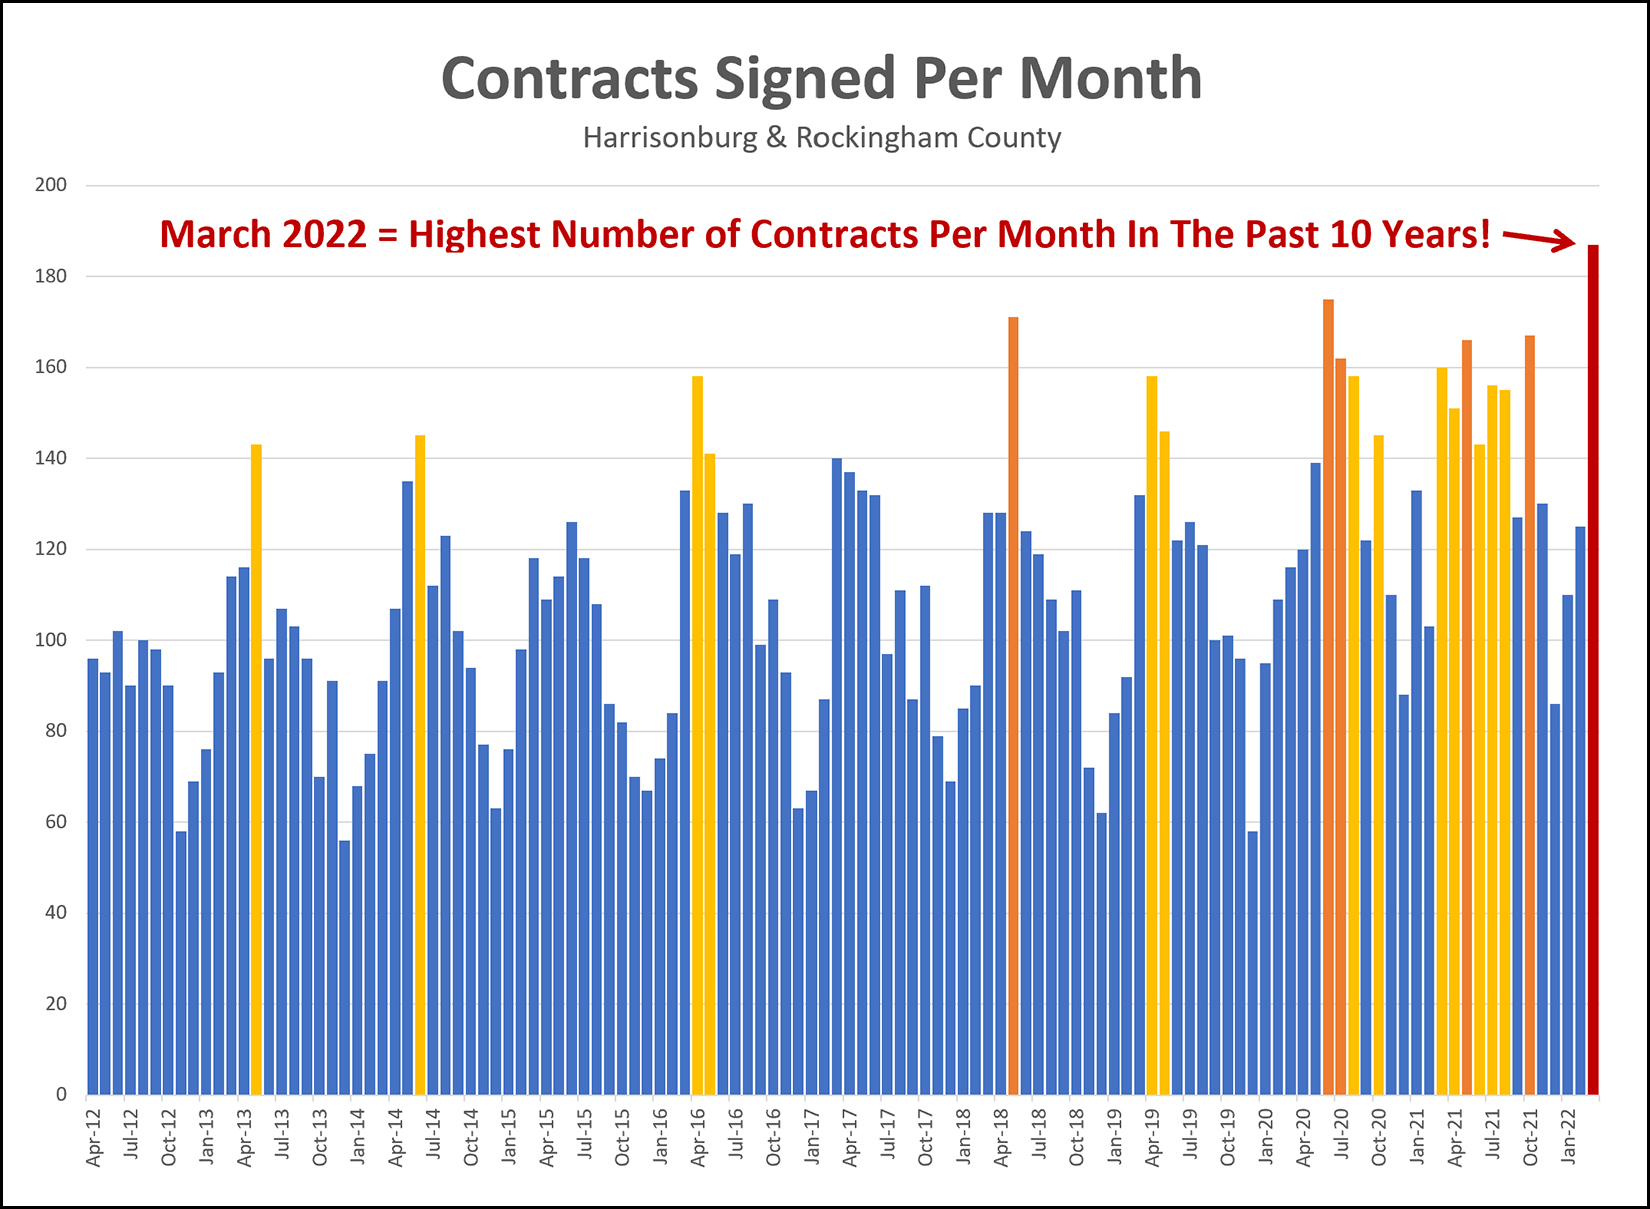 Wow! I knew that a lot of homes went under contract last month when I compiled my market report but I hadn't yet put it in a larger context. During March 2022, contracts were signed on a total of 186 properties in Harrisonburg and Rockingham County. Looking back an entire decade, there has never been a month when more contracts have been signed! In fact, there have only been a handful of months (five) when more than 160 contracts were signed. So, what gives? Why so much contract activity? [1] The market is strong, silly, sellers are excited to sell, buyers are excited to buy. [2] For some reason, more sellers than usual waited until March to list their homes (instead of January or February) causing an unexpected peak in March 2022. [3] Sellers are buyers are seeing interest rates rising and sellers want to go ahead and sell before rates get too high and buyers want to go ahead and buy before rates get too high. Maybe 1 and 2 and 3? ;-) Whatever the reason, there isn't any doubt that March 2022 was a record setting month for buyer and seller activity in the Harrisonburg and Rockingham County real estate market. | |
Home Sales Slow Slightly, Prices Still Climbing Quickly! |
|
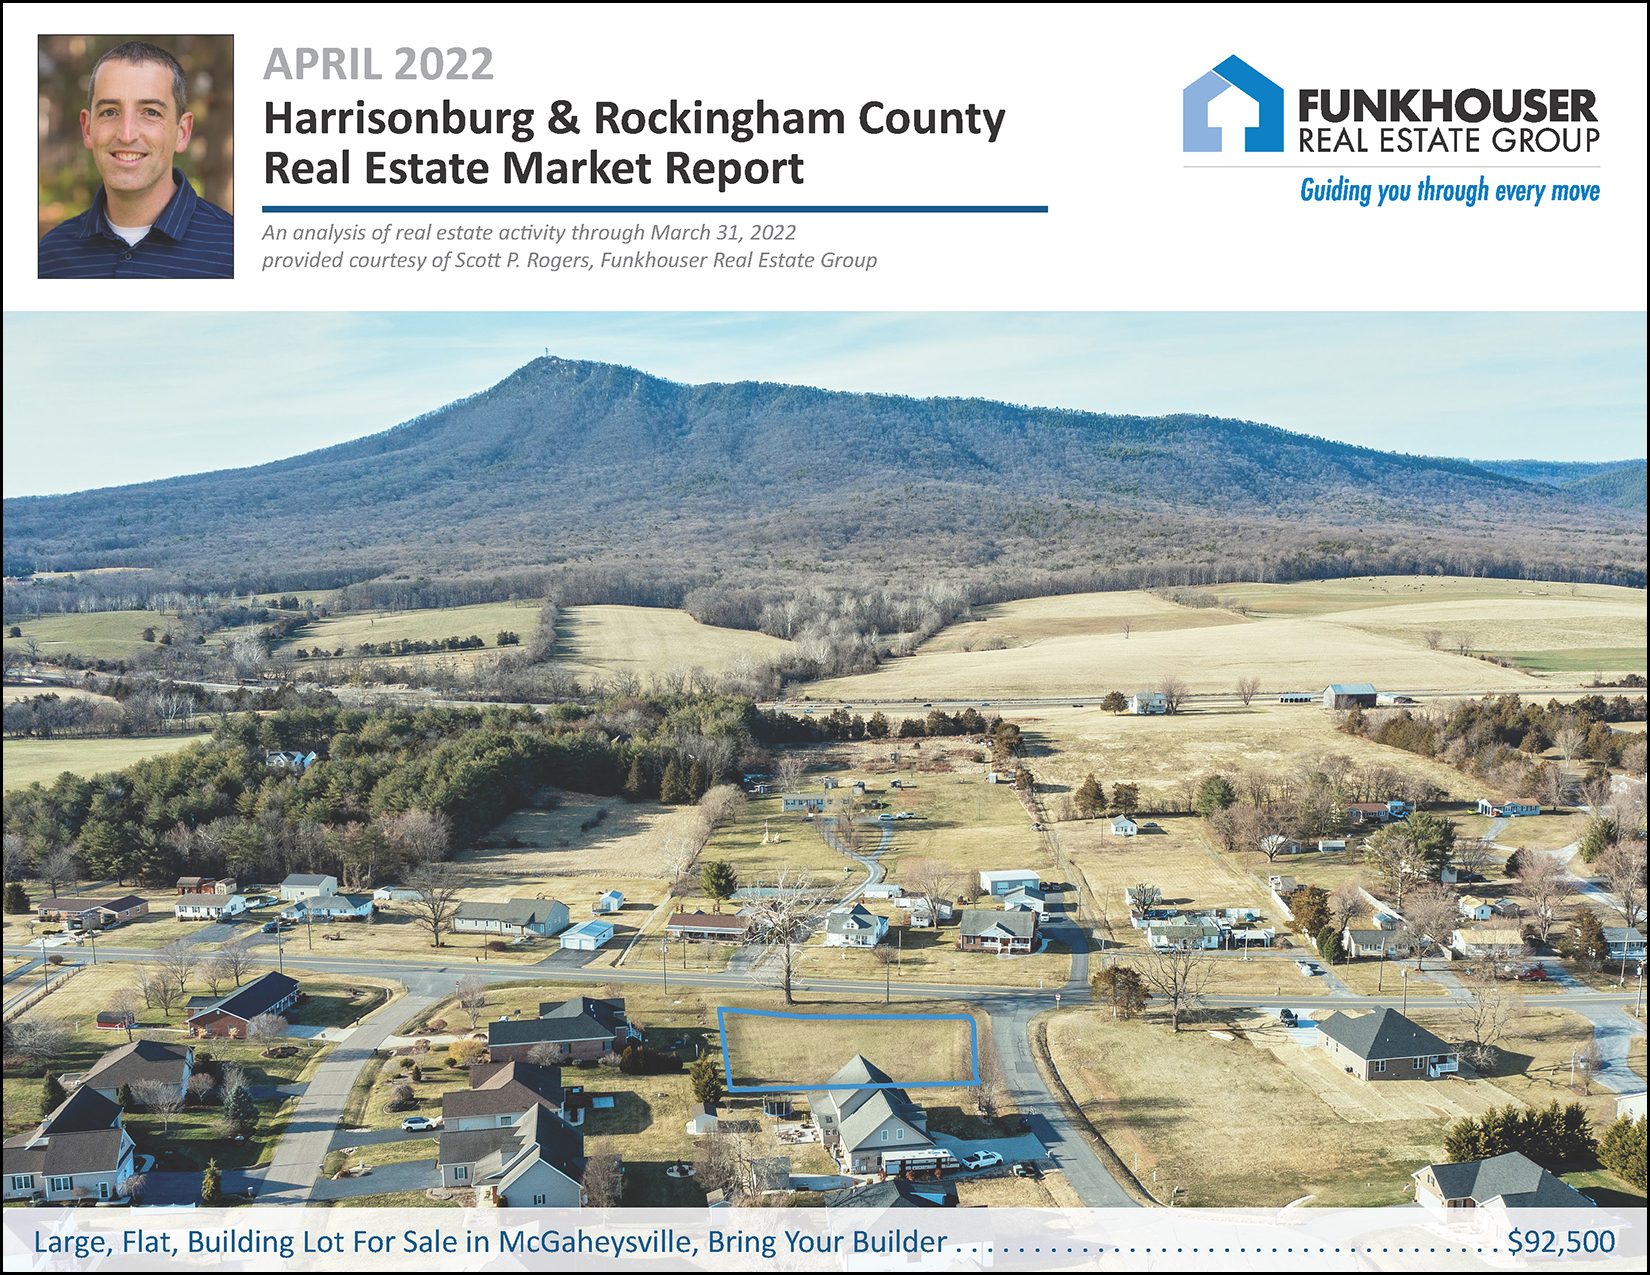 Happy Tuesday morning, friends! I hope you are enjoying the warmer weather this week, and perhaps some sporting events! We have a baseball player and a runner here in our house and the warmer weather this week is a welcome change for these outdoor sports. 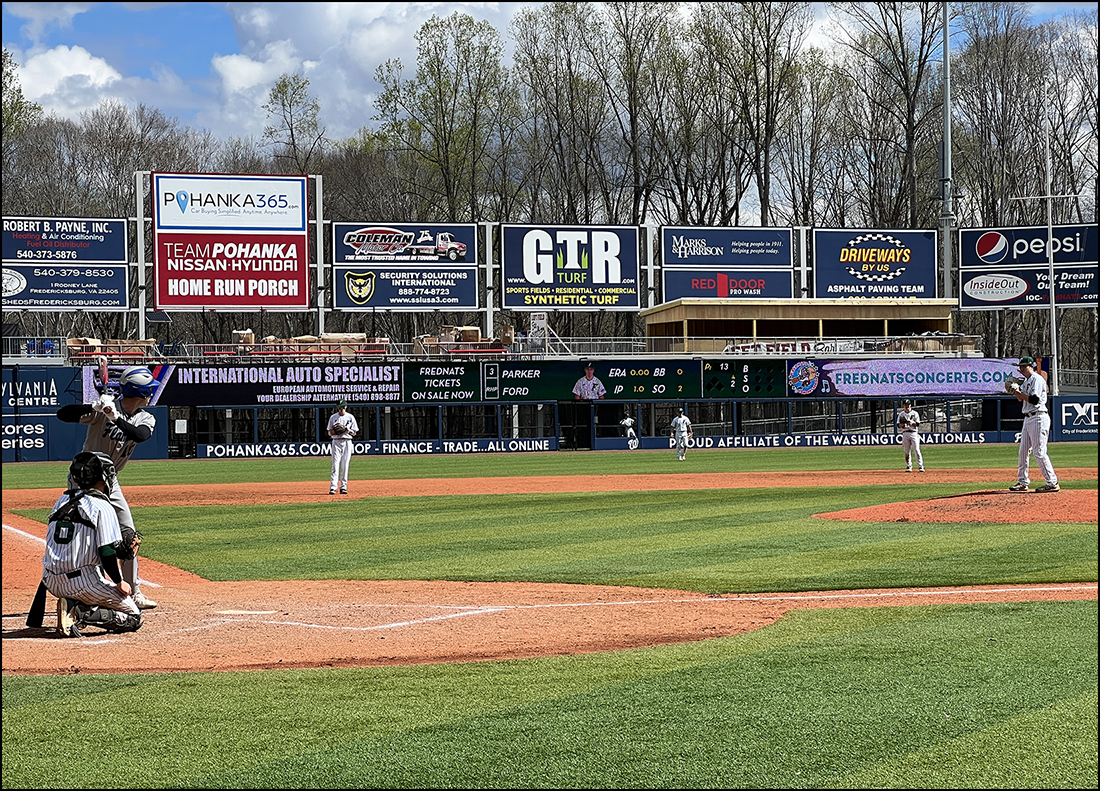 Whether you're watching baseball games, track meets or soccer games these days, I hope your kids are enjoying the sport and their teammates, and you are not freezing in the stands. :-) Before I get started on this month's market report, a few quick notes... Check Out Vito's Italian Kitchen... Each month in this space I highlight one of my favorite spots to enjoy a meal, or a cup of coffee, or maybe a few other surprises in the coming months. This month, it's Vito's Italian Kitchen... a familiar and favorite restaurant on Port Republic Road in Harrisonburg. If you find me enjoying a meal at Vito's, it will likely be their calzone... or of late, I have been partaking of their delicious Coconut Chicken & Fruit salad. If you haven't visited Vito's lately, do so, this week! And... maybe next week you can go back for free! I'm giving away a $50 gift certificate to Vito's... just for fun! Enter your name and email address here and I'll pick a winner in about a week. :-) Congrats to Michael S. who won the Magpie gift card last month! Featured Property... Are you tired of bidding on house after house and not having the seller select your offer? Maybe you should build your next house instead of buying one? ;-) The photo on the cover of this month's market report is a beautiful, flat building lot in McGaheysville, currently offered for sale... and ready for you to build your next home! Find out more here. Download All The Graphs... Finally, for those of you who like to download all the graphs and examine every data point, you can grab those here. Now, then, onto your data fix for the month... 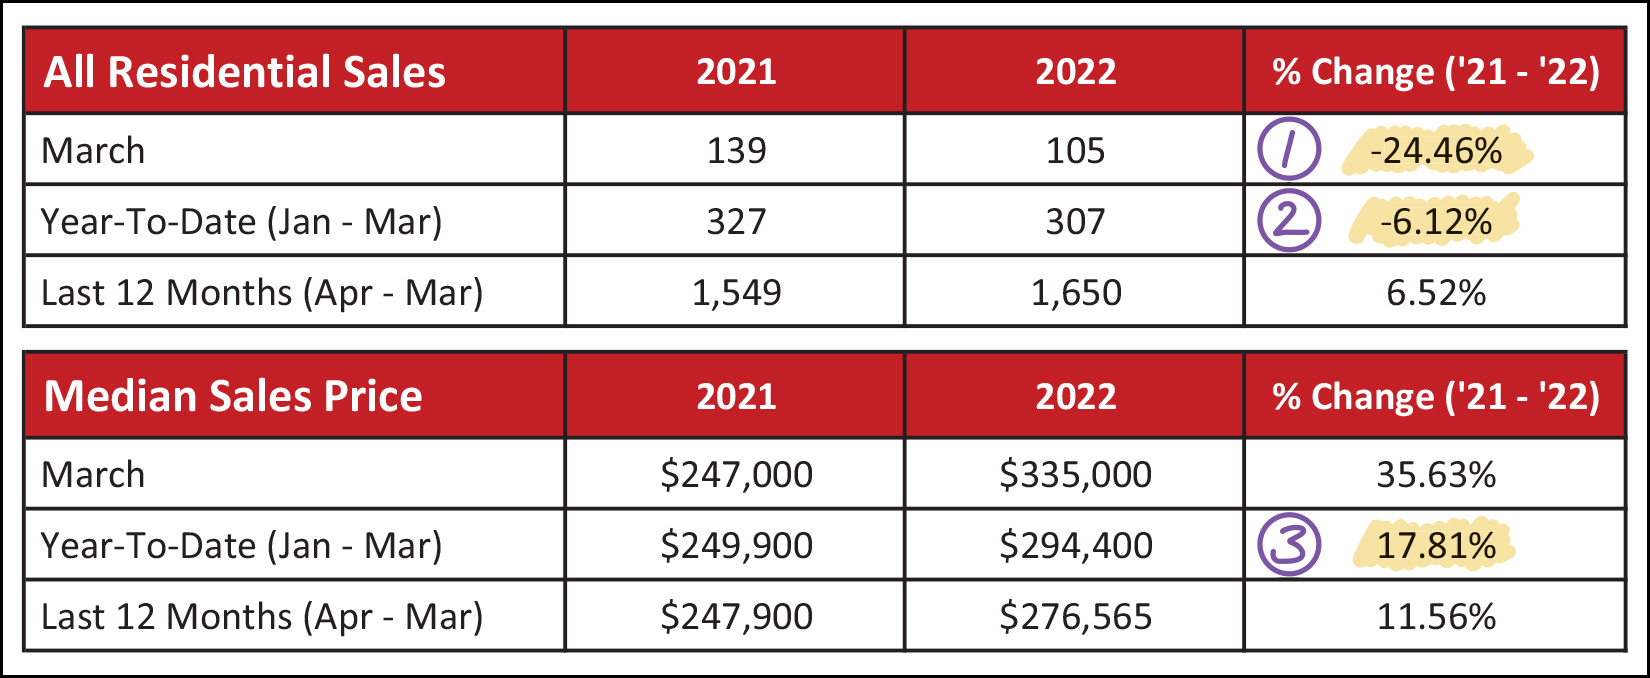 First off, yes, it's really true... after month after month of "more sales" and then "more sales" and then "more sales" -- this month there are a few indicators that are showing "fewer sales" instead. Don't panic. Read the entire market overview below for some analysis, context and commentary. In the chart above you'll note that... [1] There were 24% fewer sales this March than last March. A knee jerk reaction here might be "oh, I knew it, interest rates went up and home sales declined" but keep in mind that buyers that closed on their purchases in March likely contracted on those homes in January and February, before much of the increase in interest rates. A better indicator of whether interest rates are having an effect on buyer activity will be... buyer activity... signed contracts... and we'll get to that a bit further down in the report. The data might surprise you. ;-) [2] That 24% comparative deficit in March contributed to a first quarter of home sales in 2022 that included 6% fewer home sales than the first quarter of last year. [3] Despite a slightly (6%) slower first quarter of the year for home sales, the prices of those homes keeps on increasing. The median sales price in the first quarter of 2022 was $294,400... which is 18% higher than it was in the first quarter of last year. As I do from time to time, let's look at the trends in detached home sales (in green below) compared to attached home sales (in orange below) which includes duplexes, townhouses and condos... 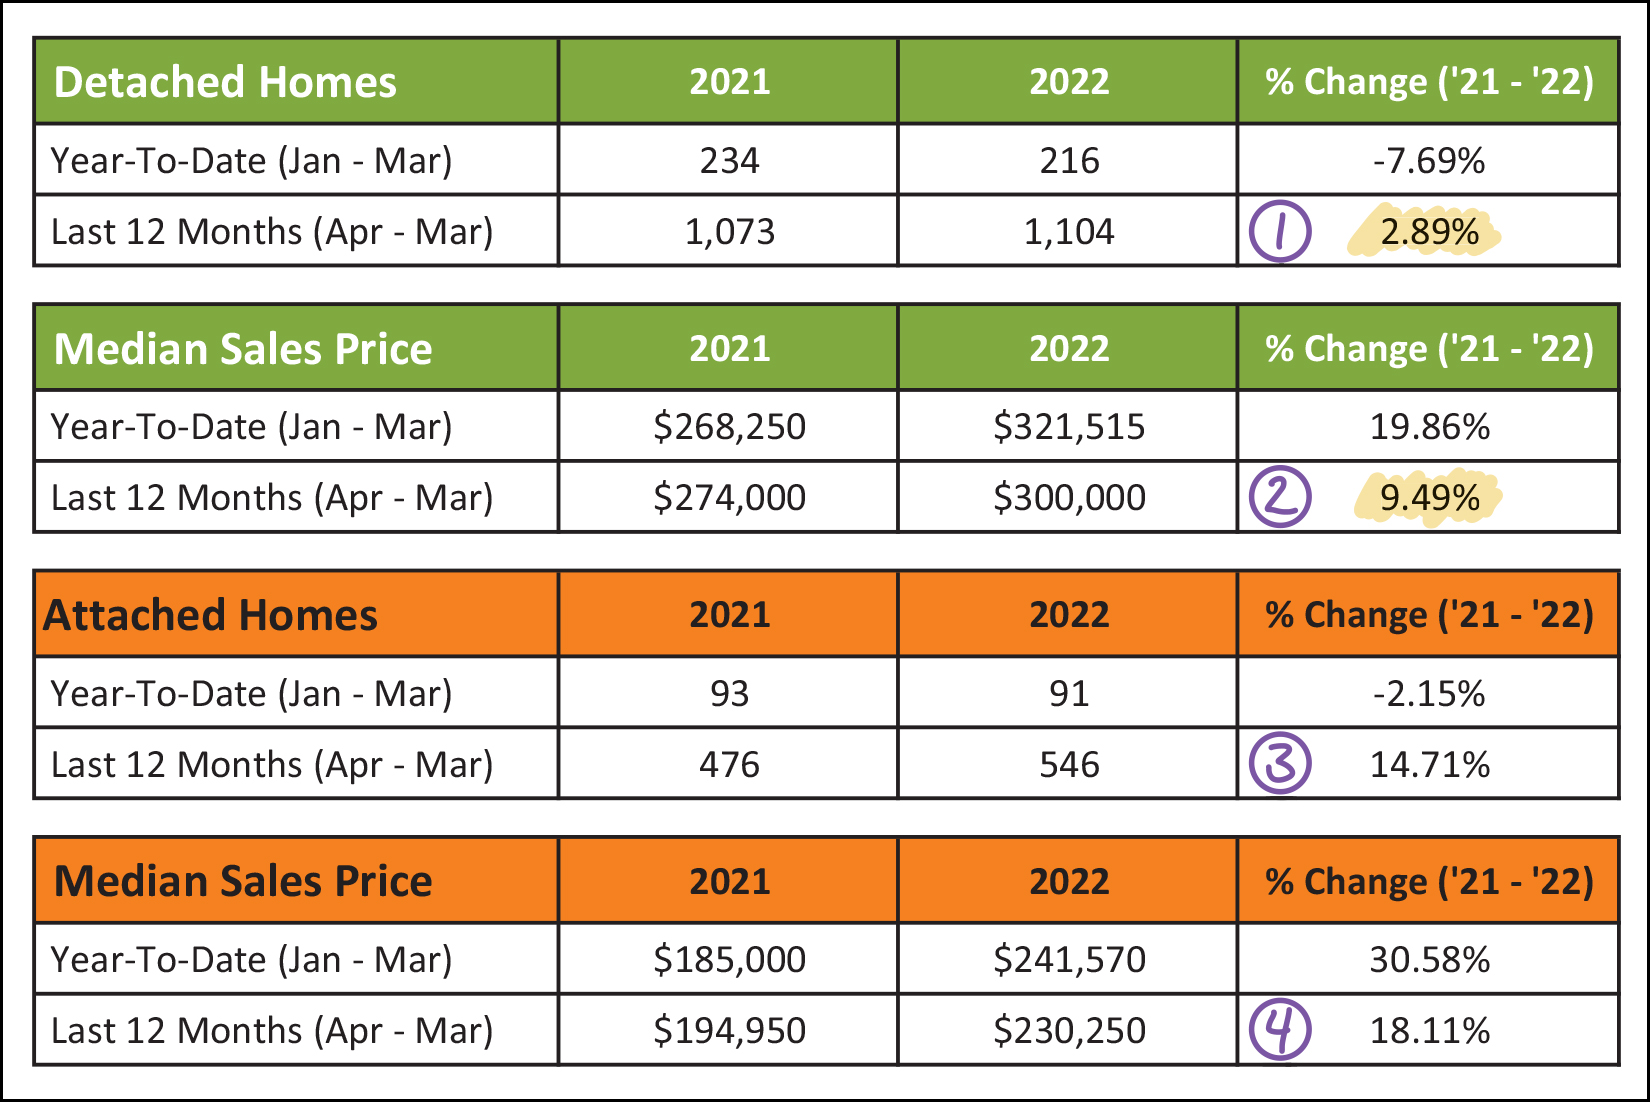 As shown above... [1] We've seen 1,104 detached home sales over the past year... which is 3% more than seen in the 12 months before that. [3] Comparatively, though, the number of attached home sales has increased much more over the past year. We've seen 546 attached home sales in the past 12 months, which is 15% more than in the 12 months before that! And how about prices... [2] The median sales price of a detached home in Harrisonburg and Rockingham County has increased 9% over the past year, to a nice (or not nice, if you're buying) round $300,000. [3] Prices of attached homes has increased at an even faster rate, with an 18% increase over the past year to a median sales price of $230,250! Here's one of my favorite graphs each month, showing monthly sales in our area... 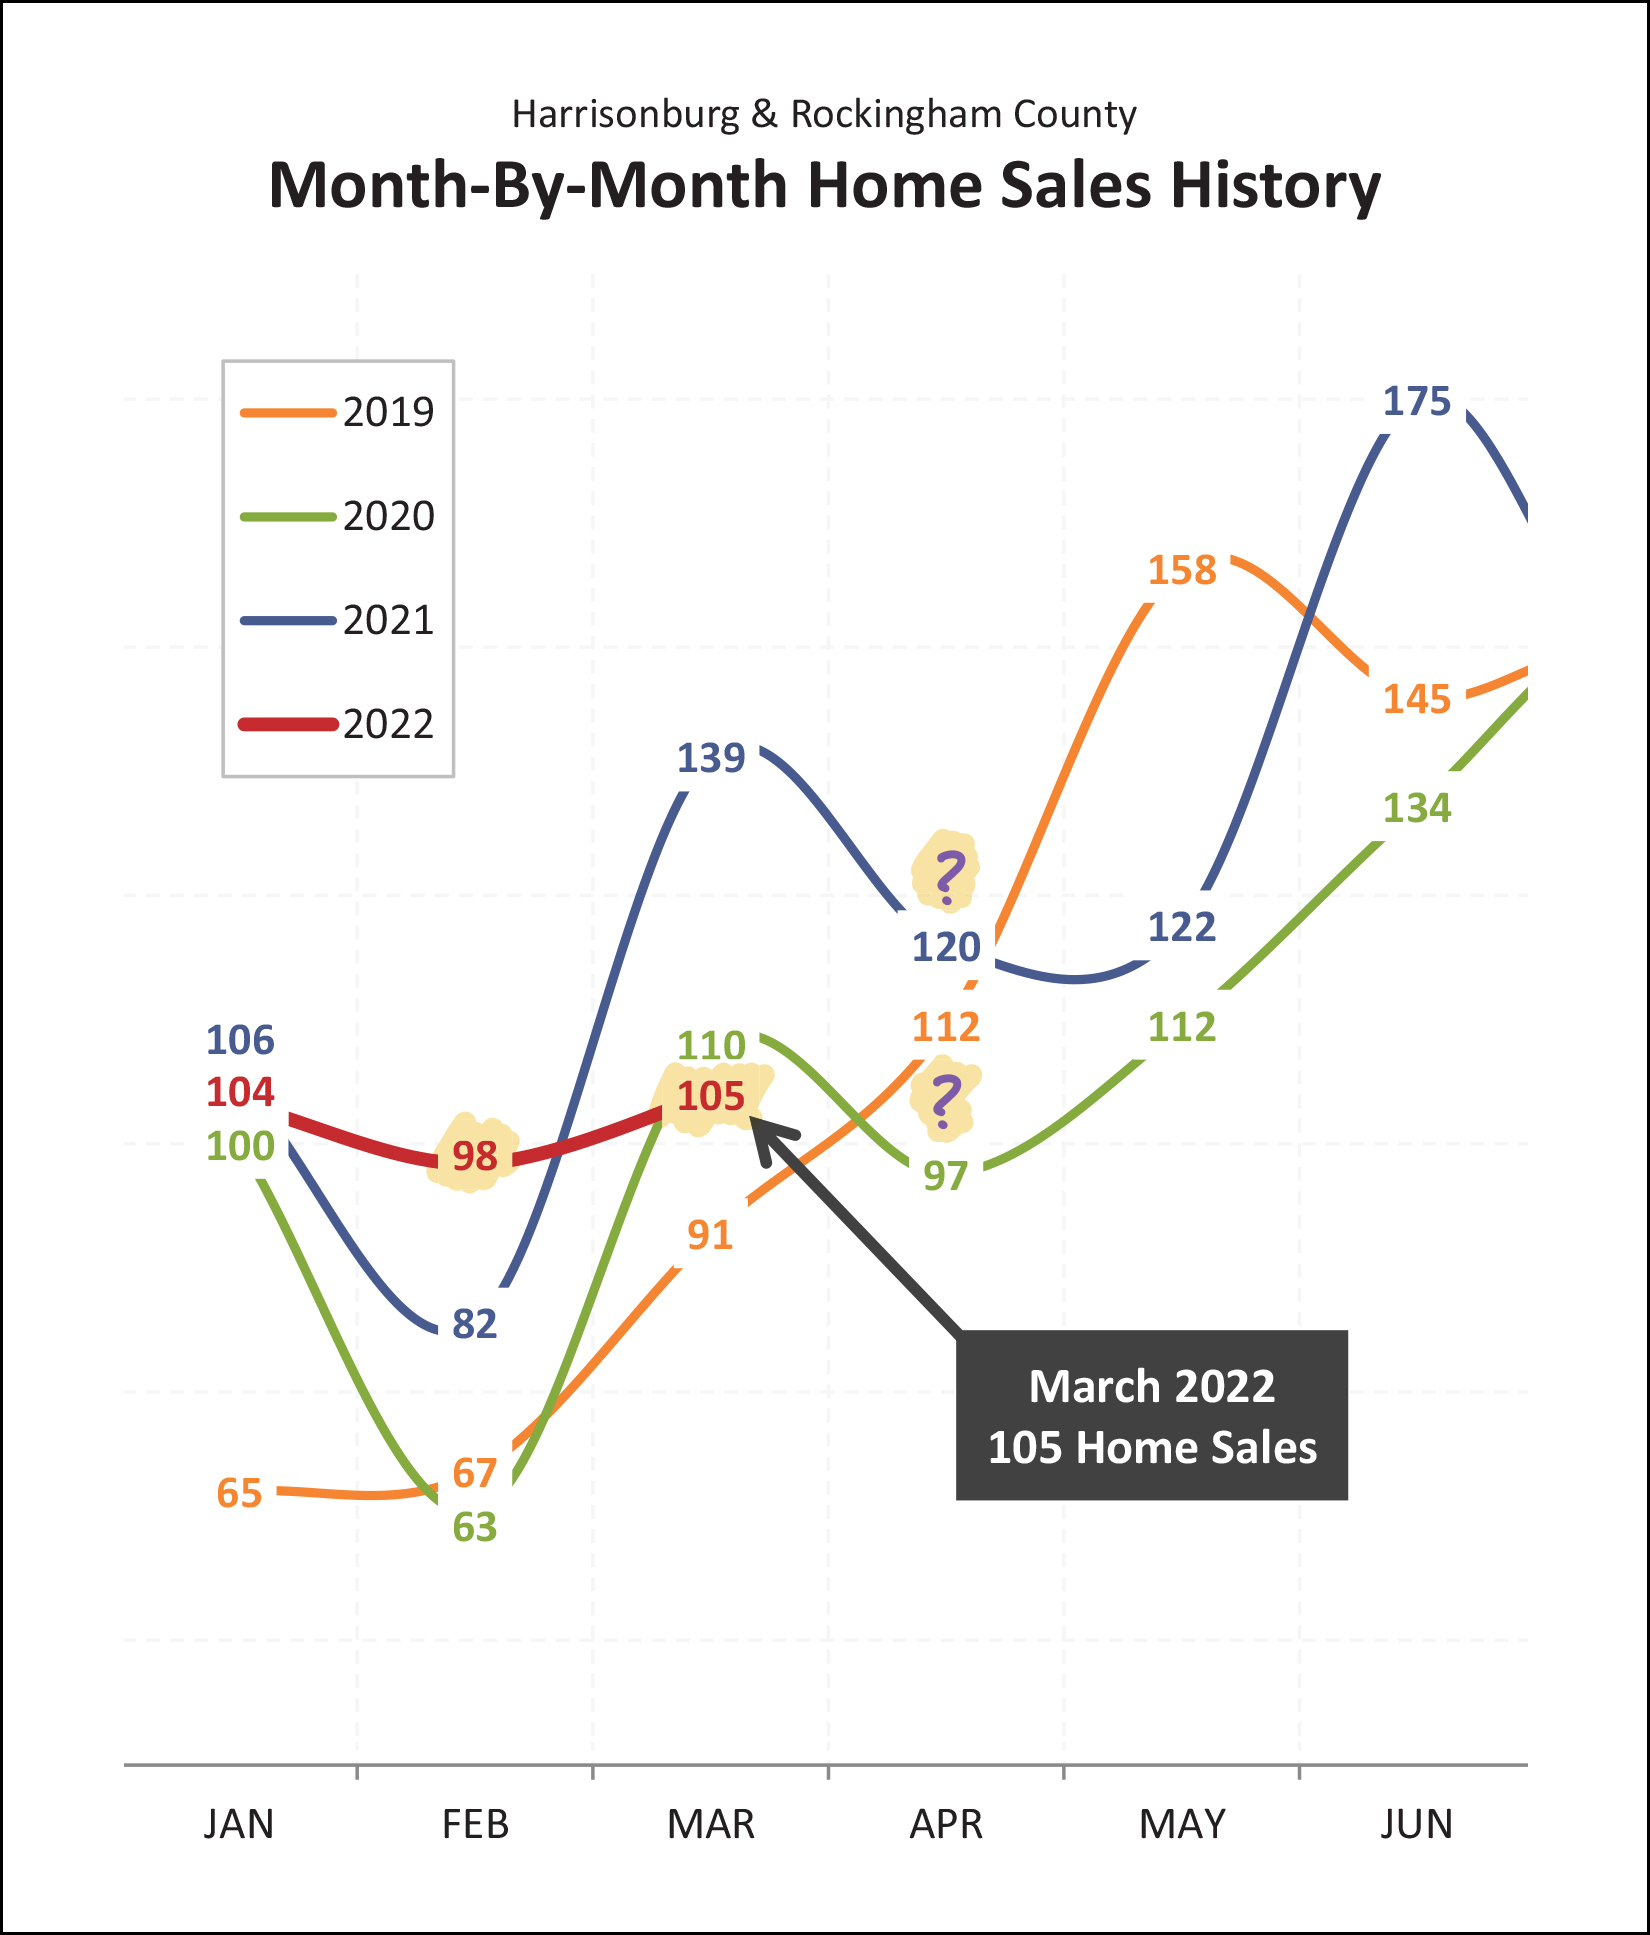 So, plenty going on in the graph above. January 2022 was what we might have expected -- right in the middle of the pack as compared to past months of January. February sales were surprisingly high, easily exceeding previous months of February. But March, hmmm, not as exciting as we might have hoped. Why weren't there more buyers in March? Some of them might have bought in February. But more likely... home buyers didn't buy (close on a purchase) in March because there weren't enough home sellers listing their homes for sale in January and February. Fewer homes available to purchase means... fewer homes will be purchased. All that said, we are certainly seeing a significant shift in mortgage interest rates right now, and that may also affect buyer (and seller) behavior moving forward. It will be helpful to see what happens over the next three to six months to better understand the overall trends in our local housing market... which is a statement that is probably always true. The next six months of data will be the best indicator of what is going on right now. :-) Next up, stack 'em up... 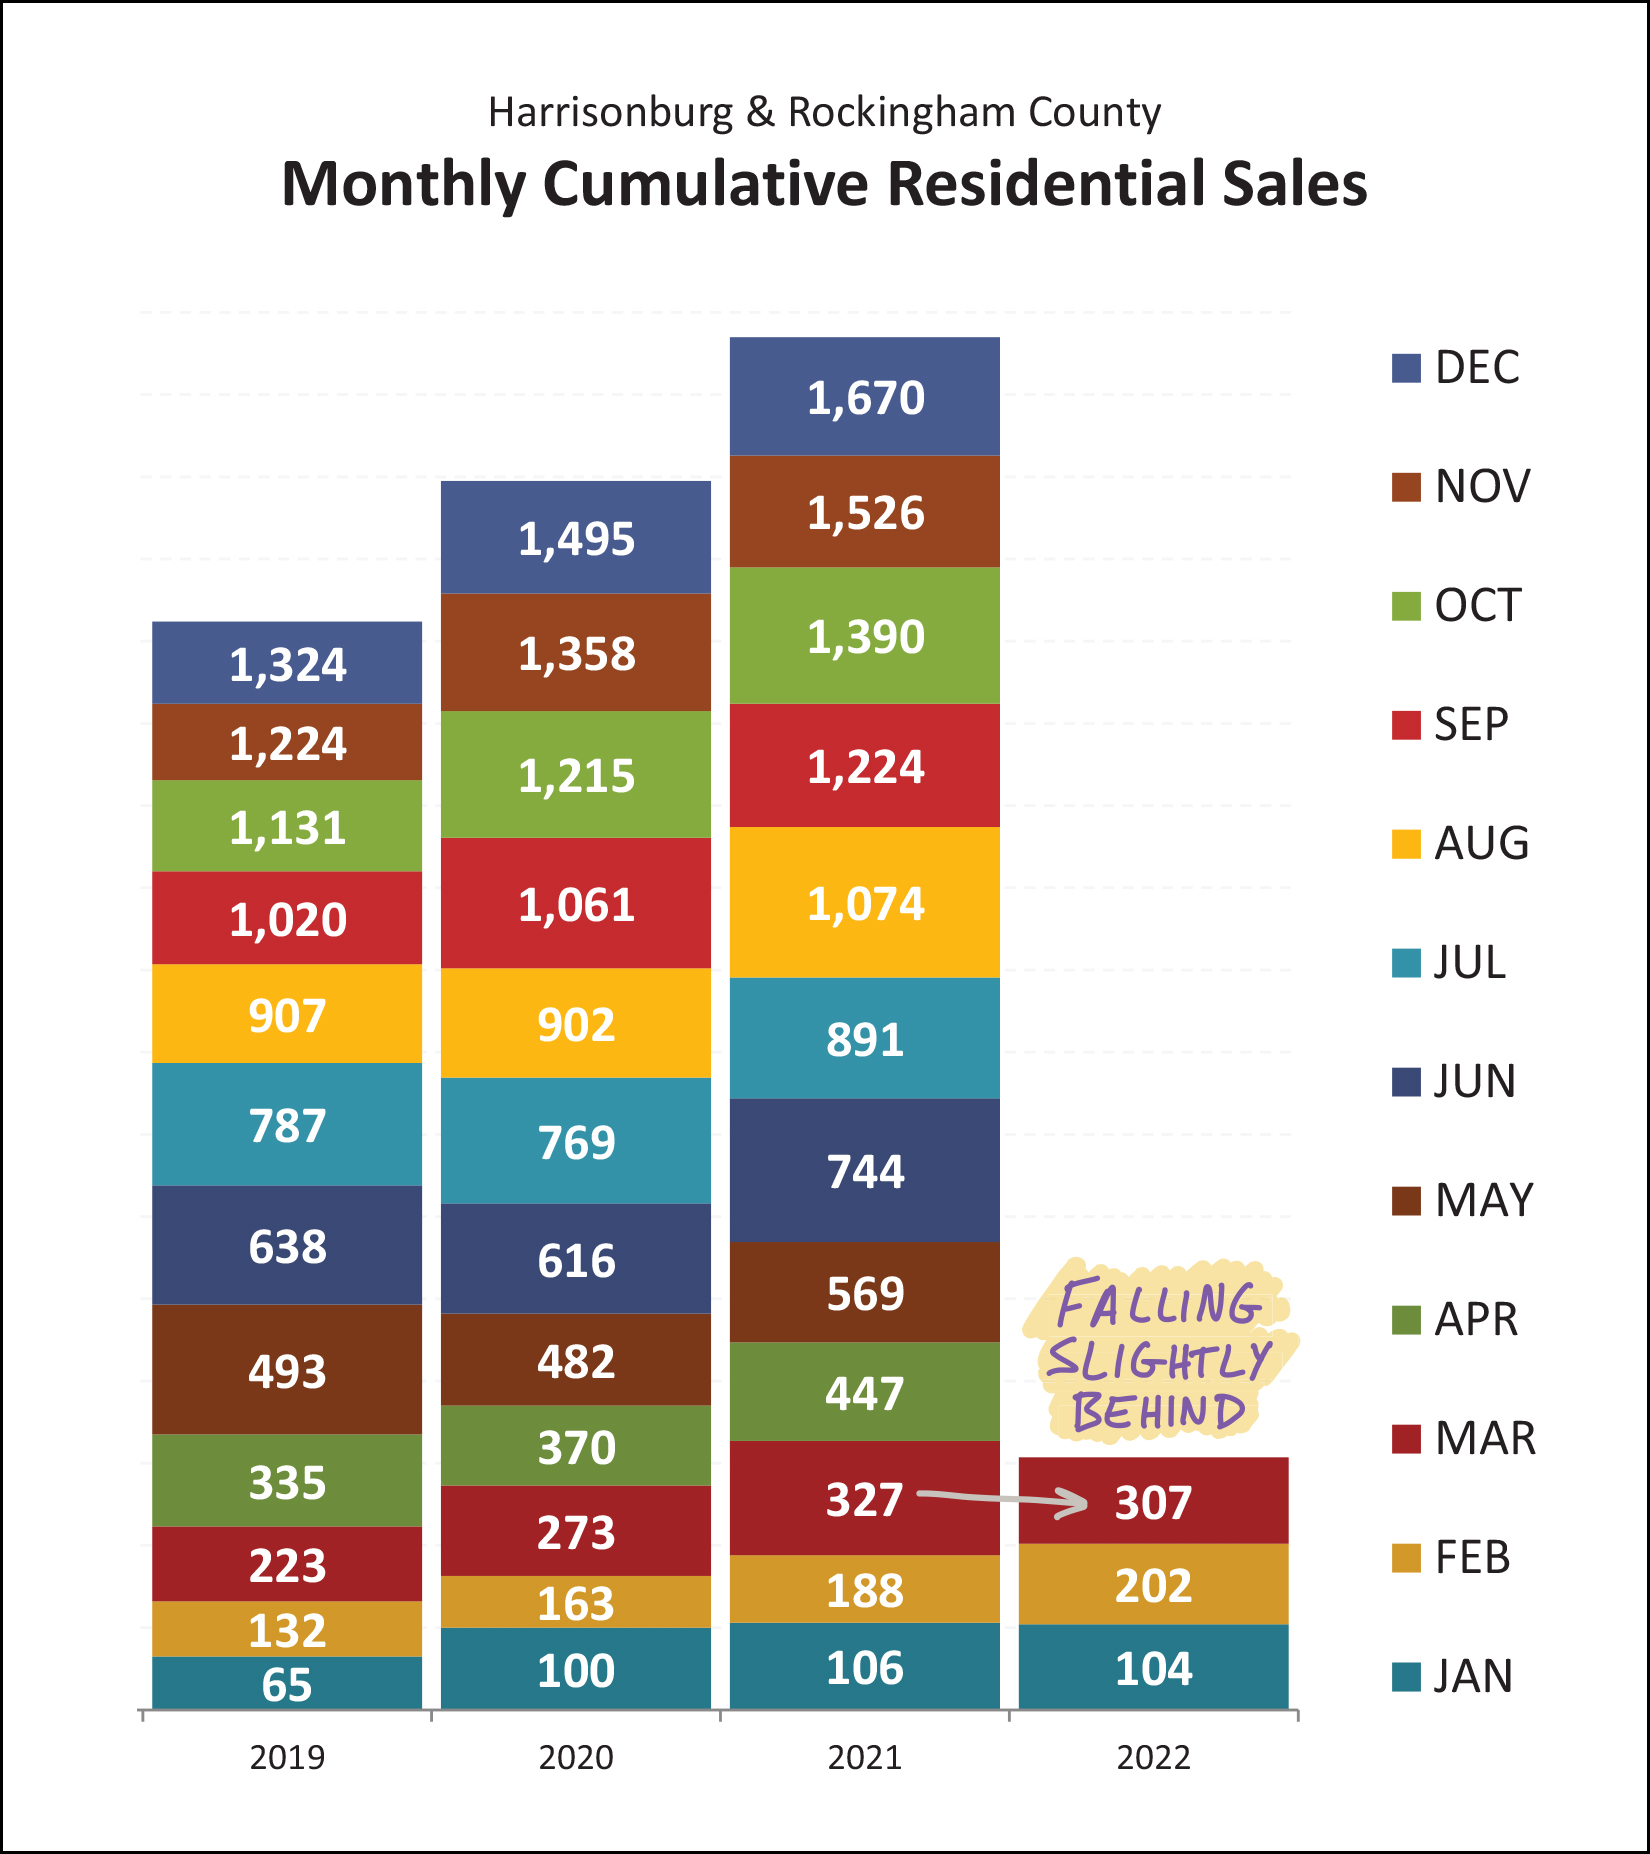 Here's where we'll be able to keep good track of cumulative trends as we go through the year. The first three months of home sales this year (307) is slightly lower than those same three months last year... but higher than the two years before that. Will enough home sales pile on in April to make up that deficit? One indicator that might point to a yes or no will be contract activity in March. Keep reading... Slicing and dicing the data again, we end up reviewing our basic understanding of landforms... 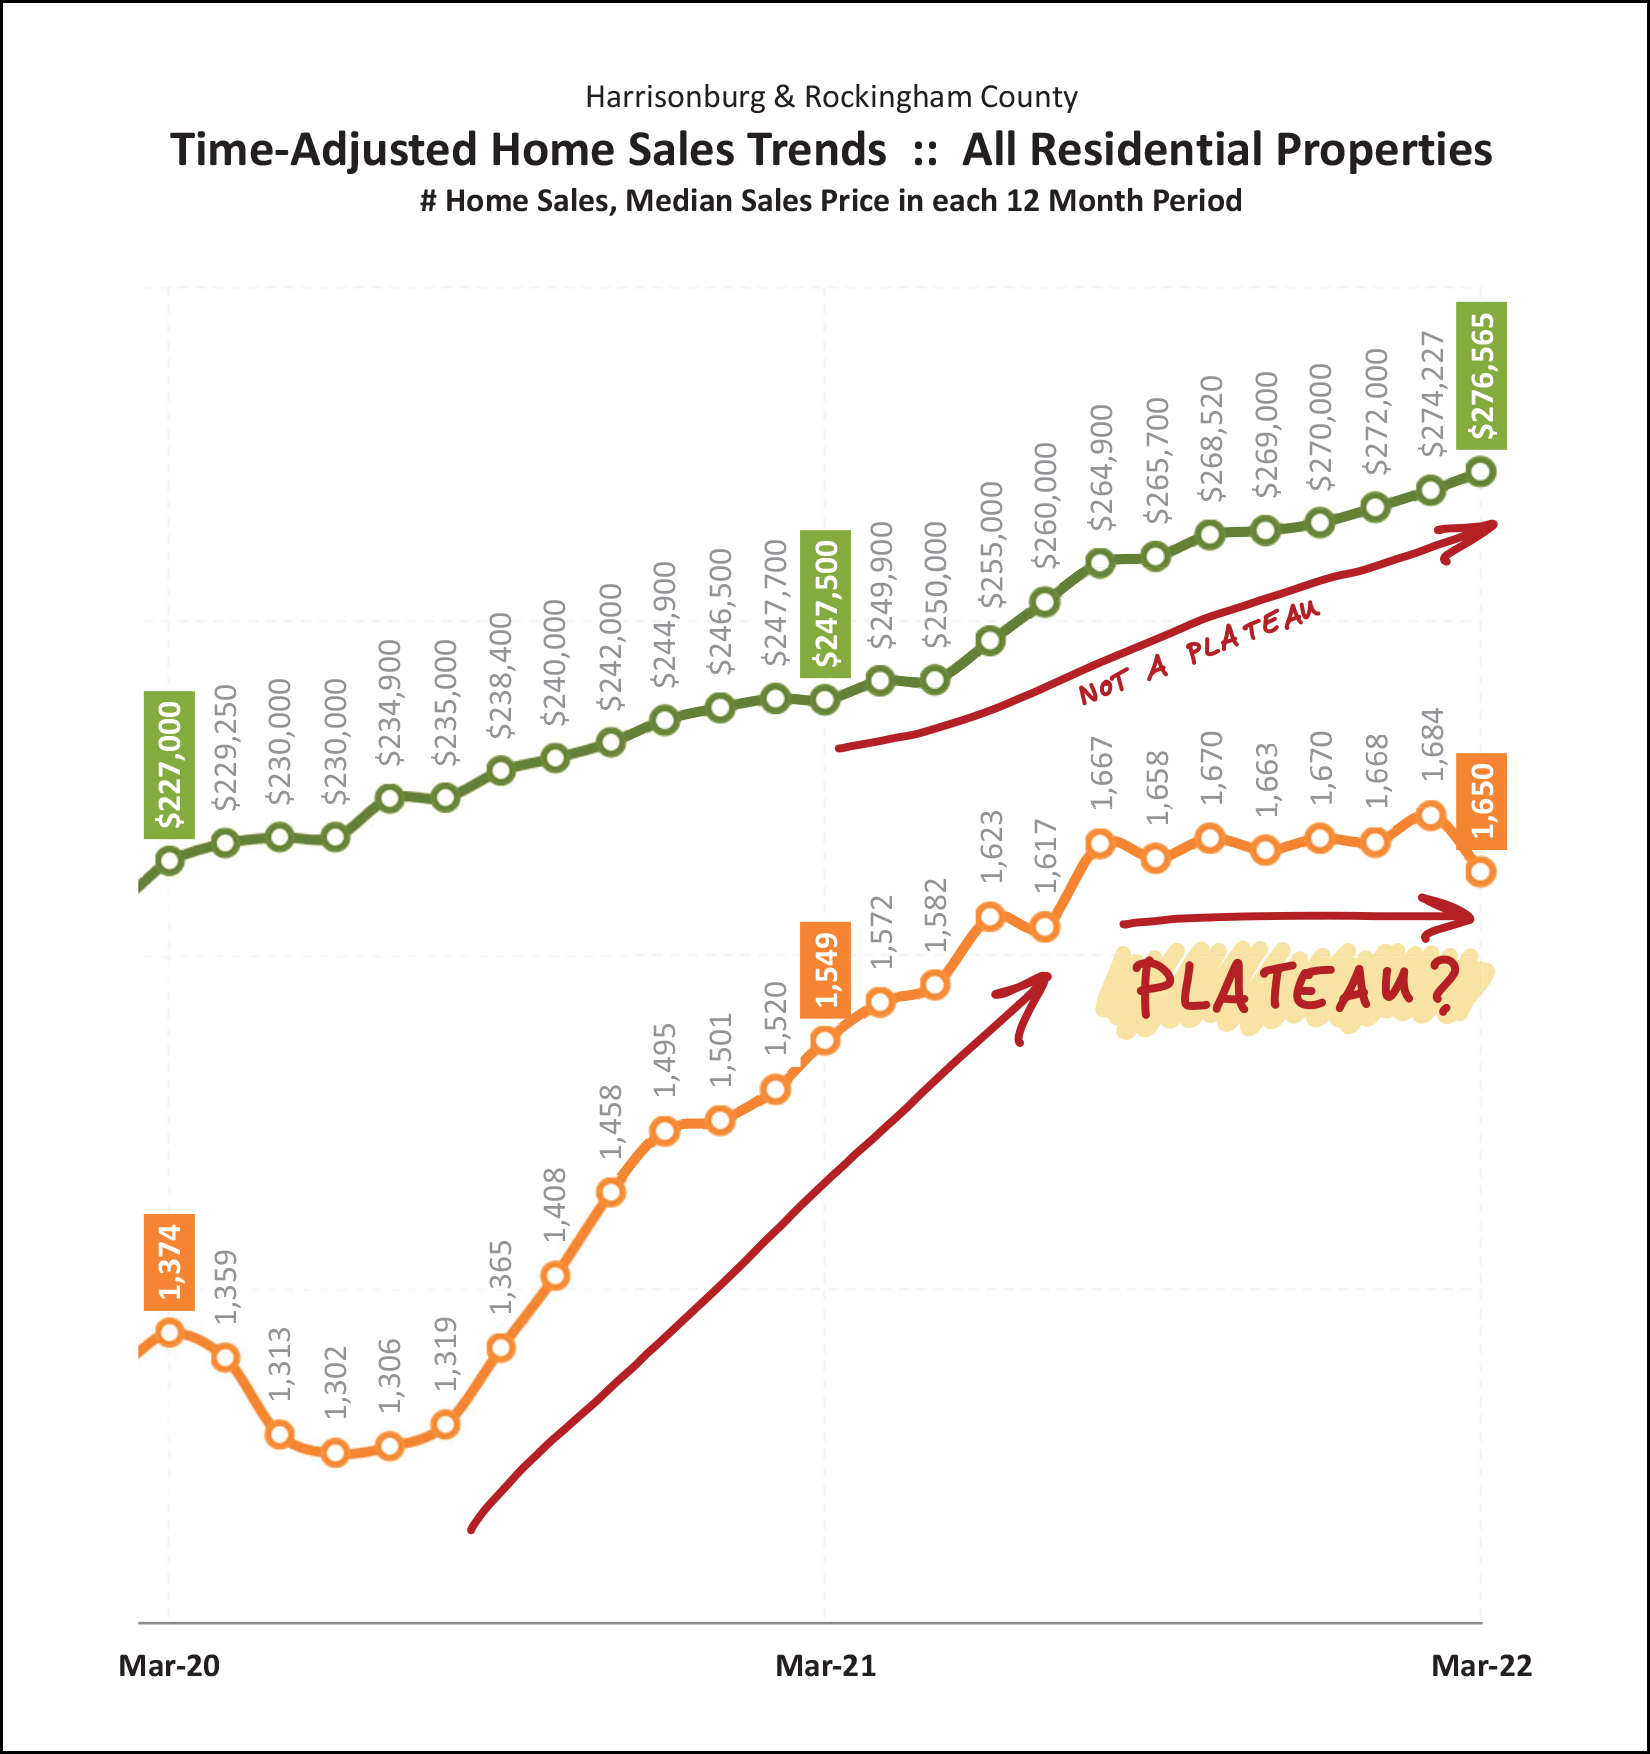 OK, let's see how you did at geography... before you read the captions above... the green line is or is not a plateau? And how about the orange line? Indeed, the green line is definitely not a plateau... sales prices keep on climbing, higher and higher and higher again. But the orange line... might be (?) a plateau? The number of homes selling a year in Harrisonburg and Rockingham County dipped down to around 1300/year in mid 2020 at the start of the pandemic, but then accelerated well past 1600/year by the fourth quarter of 2021. Over the past eight months, however, we have been seeing a relatively steady number of home sales per year. So, lots of home sales, but that number is no longer increasing, at least for now. So, will we see annual home sales ever (even for a month) rise to 1700 sales per year? Maybe not, given the past eight months of hanging out in the 1650 - 1690 range. And below is one more sign of a possible change in a trend in our local housing market... 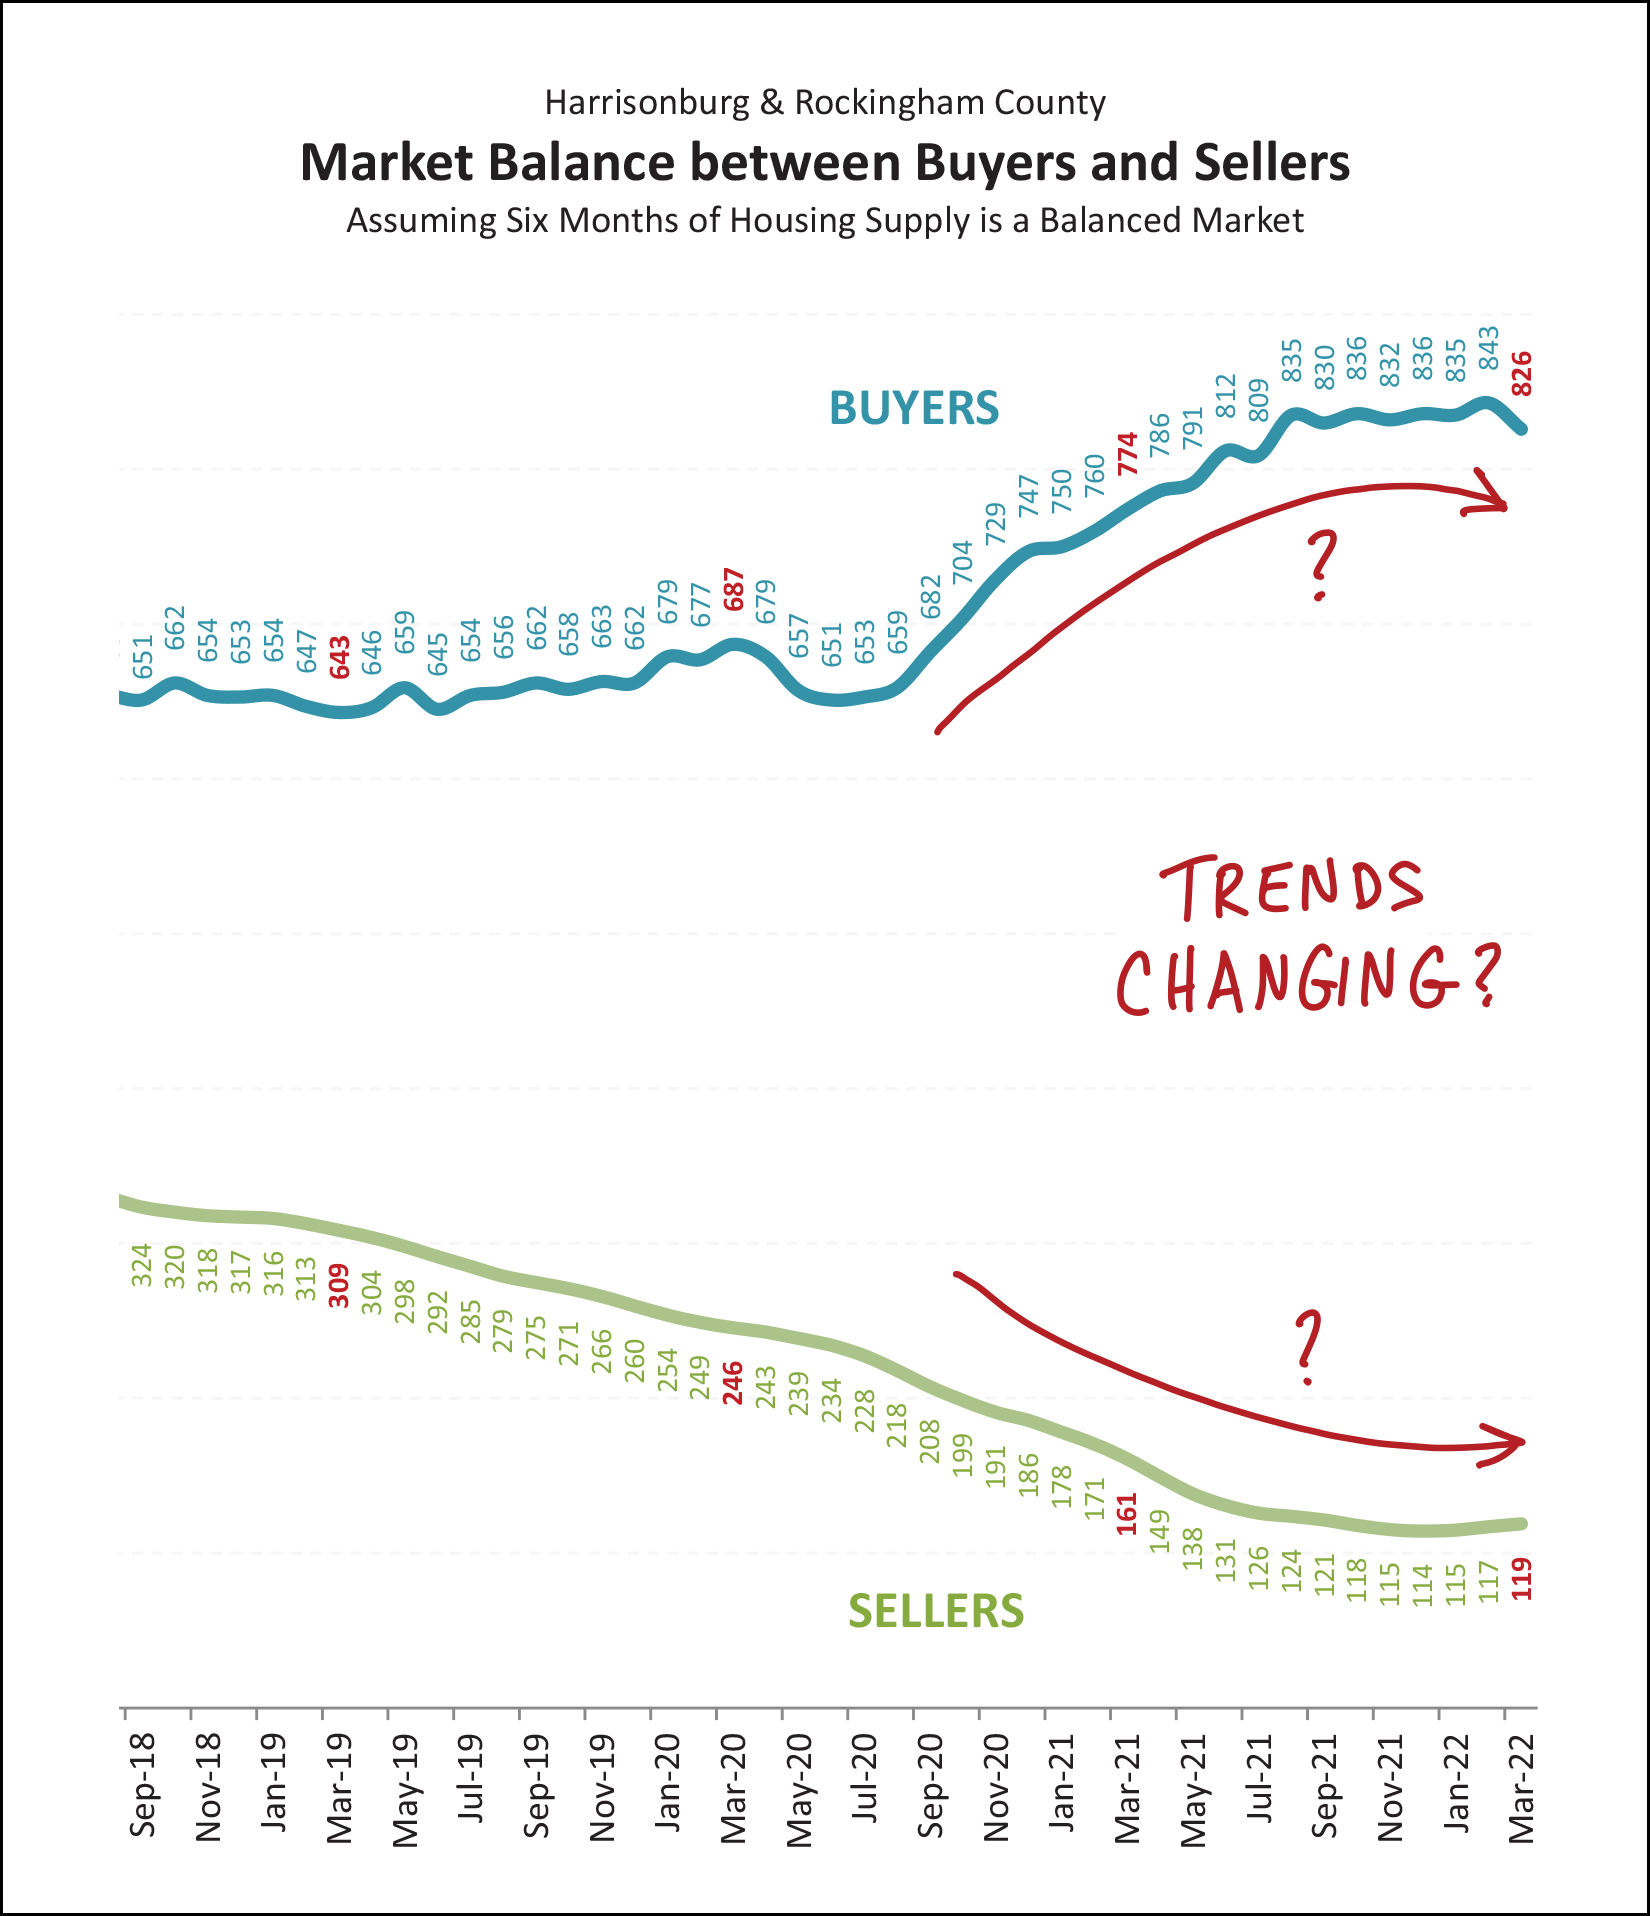 As can be generally observed above, the number of buyers buying has been flattening out over the past six to nine months -- and the number of sellers selling (inventory levels) have been stabilizing (at a really, really low point) during that same time period. So, is something changing in our local real estate market? Maybe? We probably shouldn't and wouldn't conclude that the balance in the market is shifting unless we see a measurable decline in buyer activity AND a corresponding increase in availability in homes offered for sale. Which brings us right back around to needing to remember that in order for a high level of buyer activity to be sustained.... we also need to see a sustained high level of seller activity. No houses to buy... no houses will be bought. But before anyone starts thinking that the balance in the market is changing, let's take a look at how negotiations are going these days... 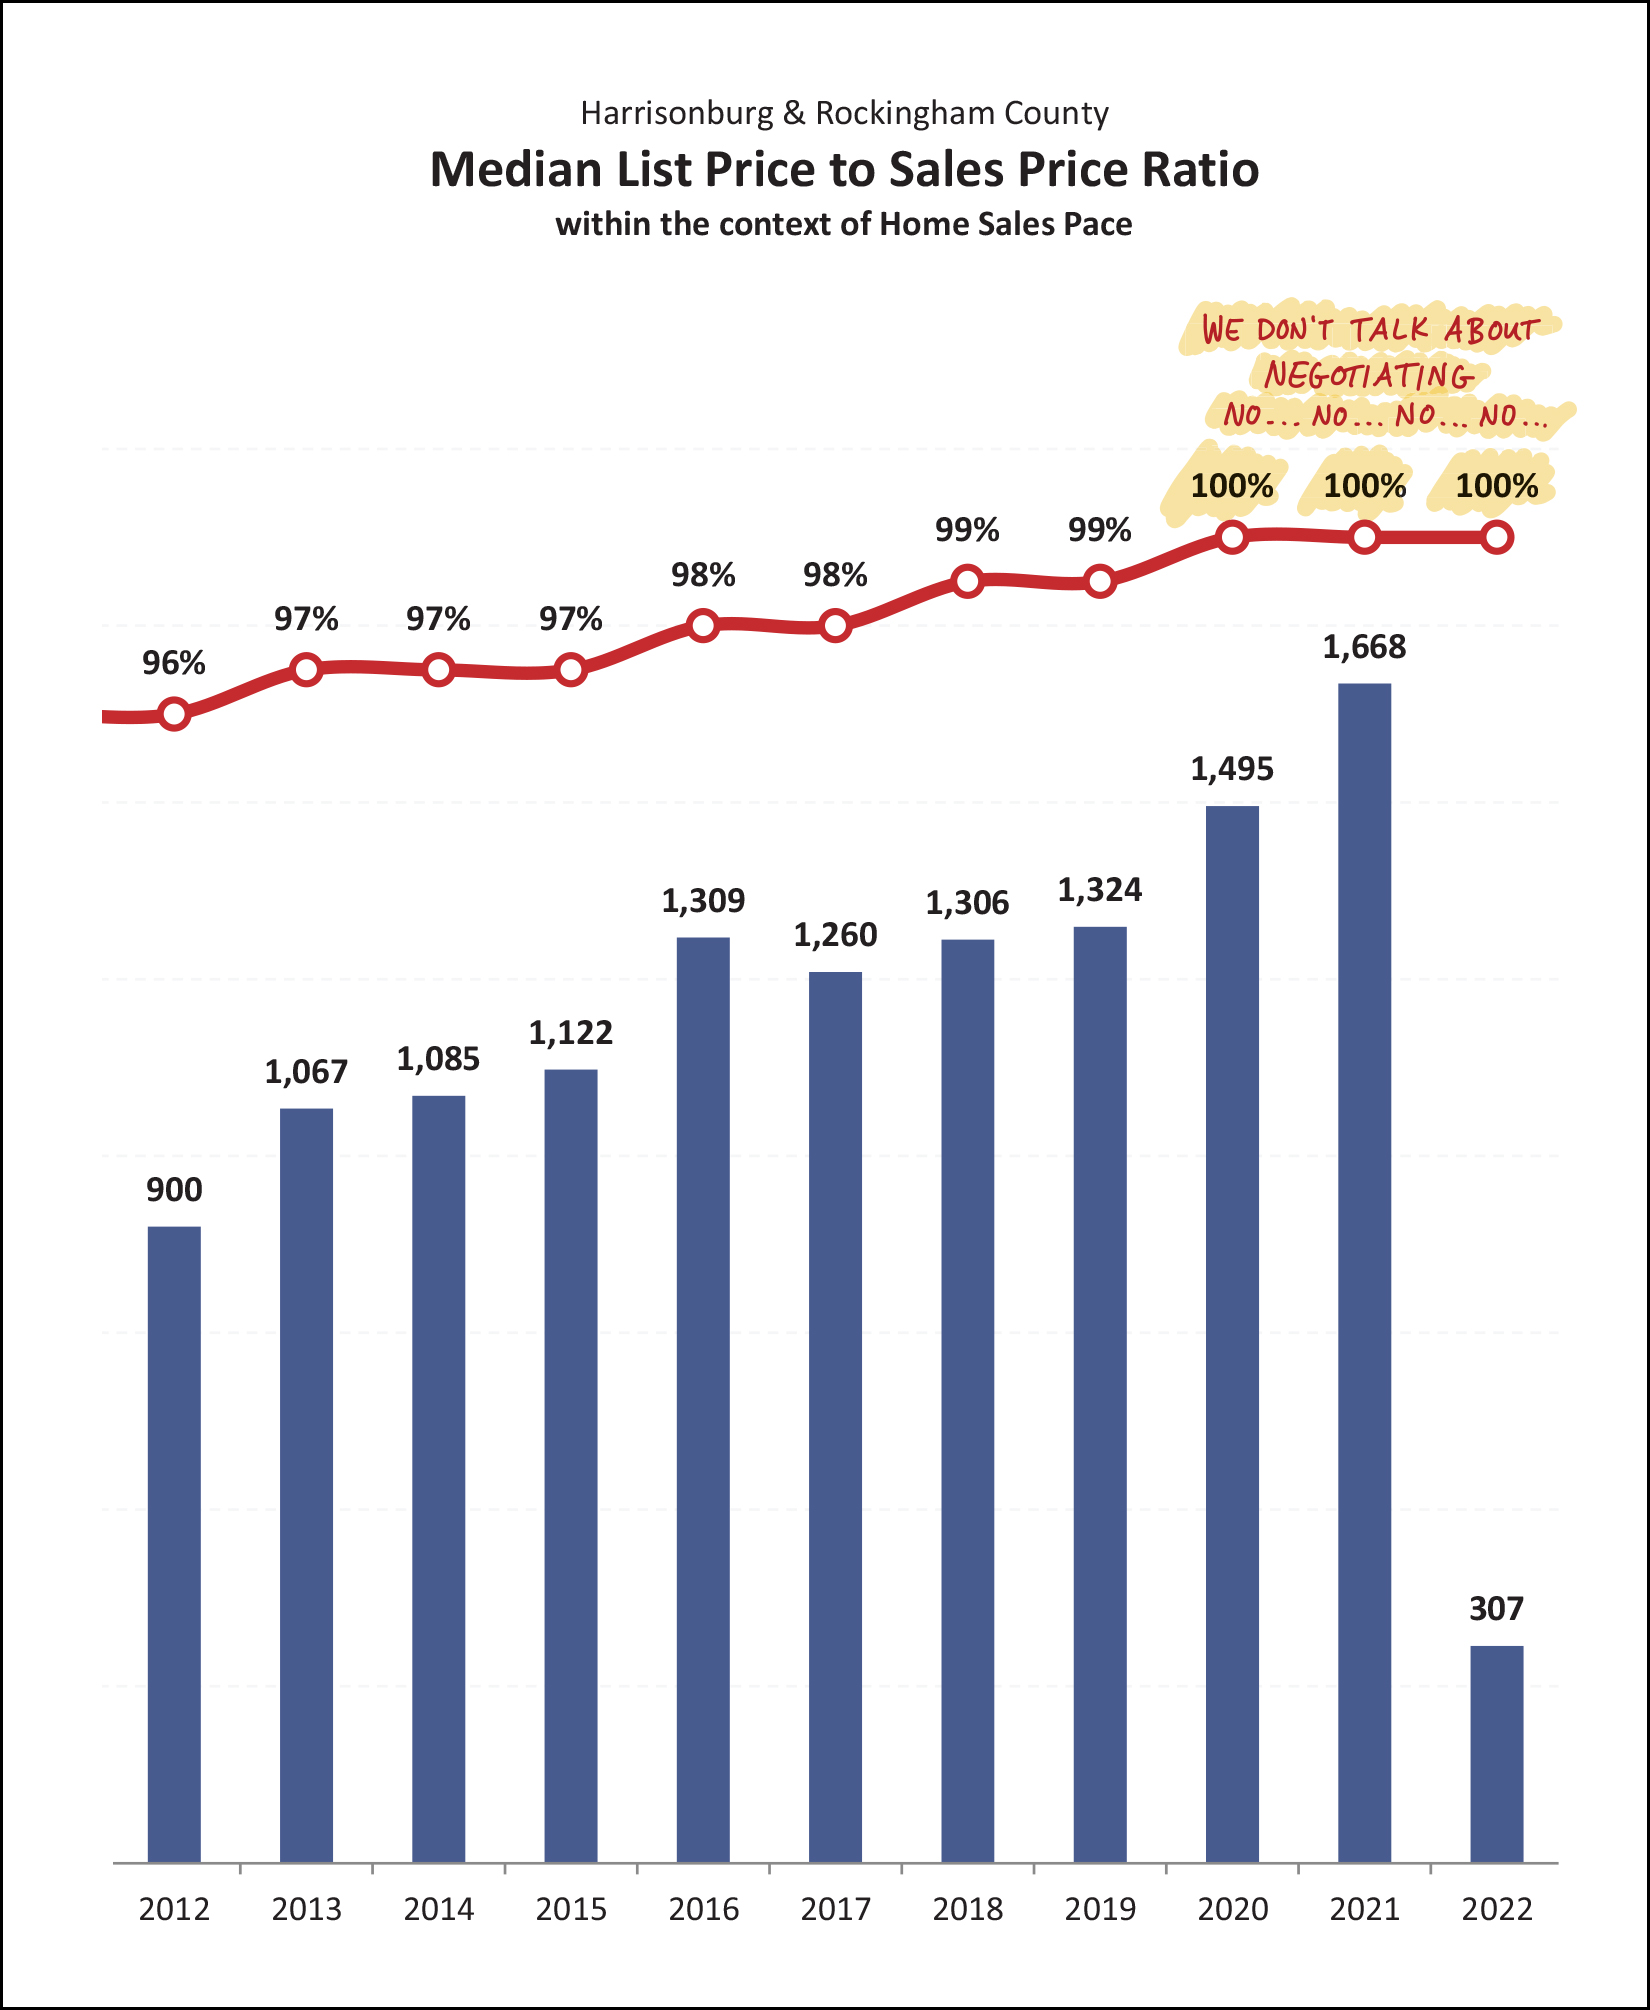 Indeed, buyers and sellers in today's market will tell you that there is very little negotiating happening on price... unless you consider going well above the list price as negotiating. I listed three homes for sale last week... we had three offers on one, three offers on the second, and seven offers on the third. All are selling for more than the list price. So, even if buyer activity in the overall market is declining slightly, that might be simply a result of fewer sellers selling... because the competition for each singular listing is still quite fierce. So, no, Buyer Bruno, we certainly don't talk about negotiating. Nice try, though. OK, this next graph is what I've alluded to a few times earlier... 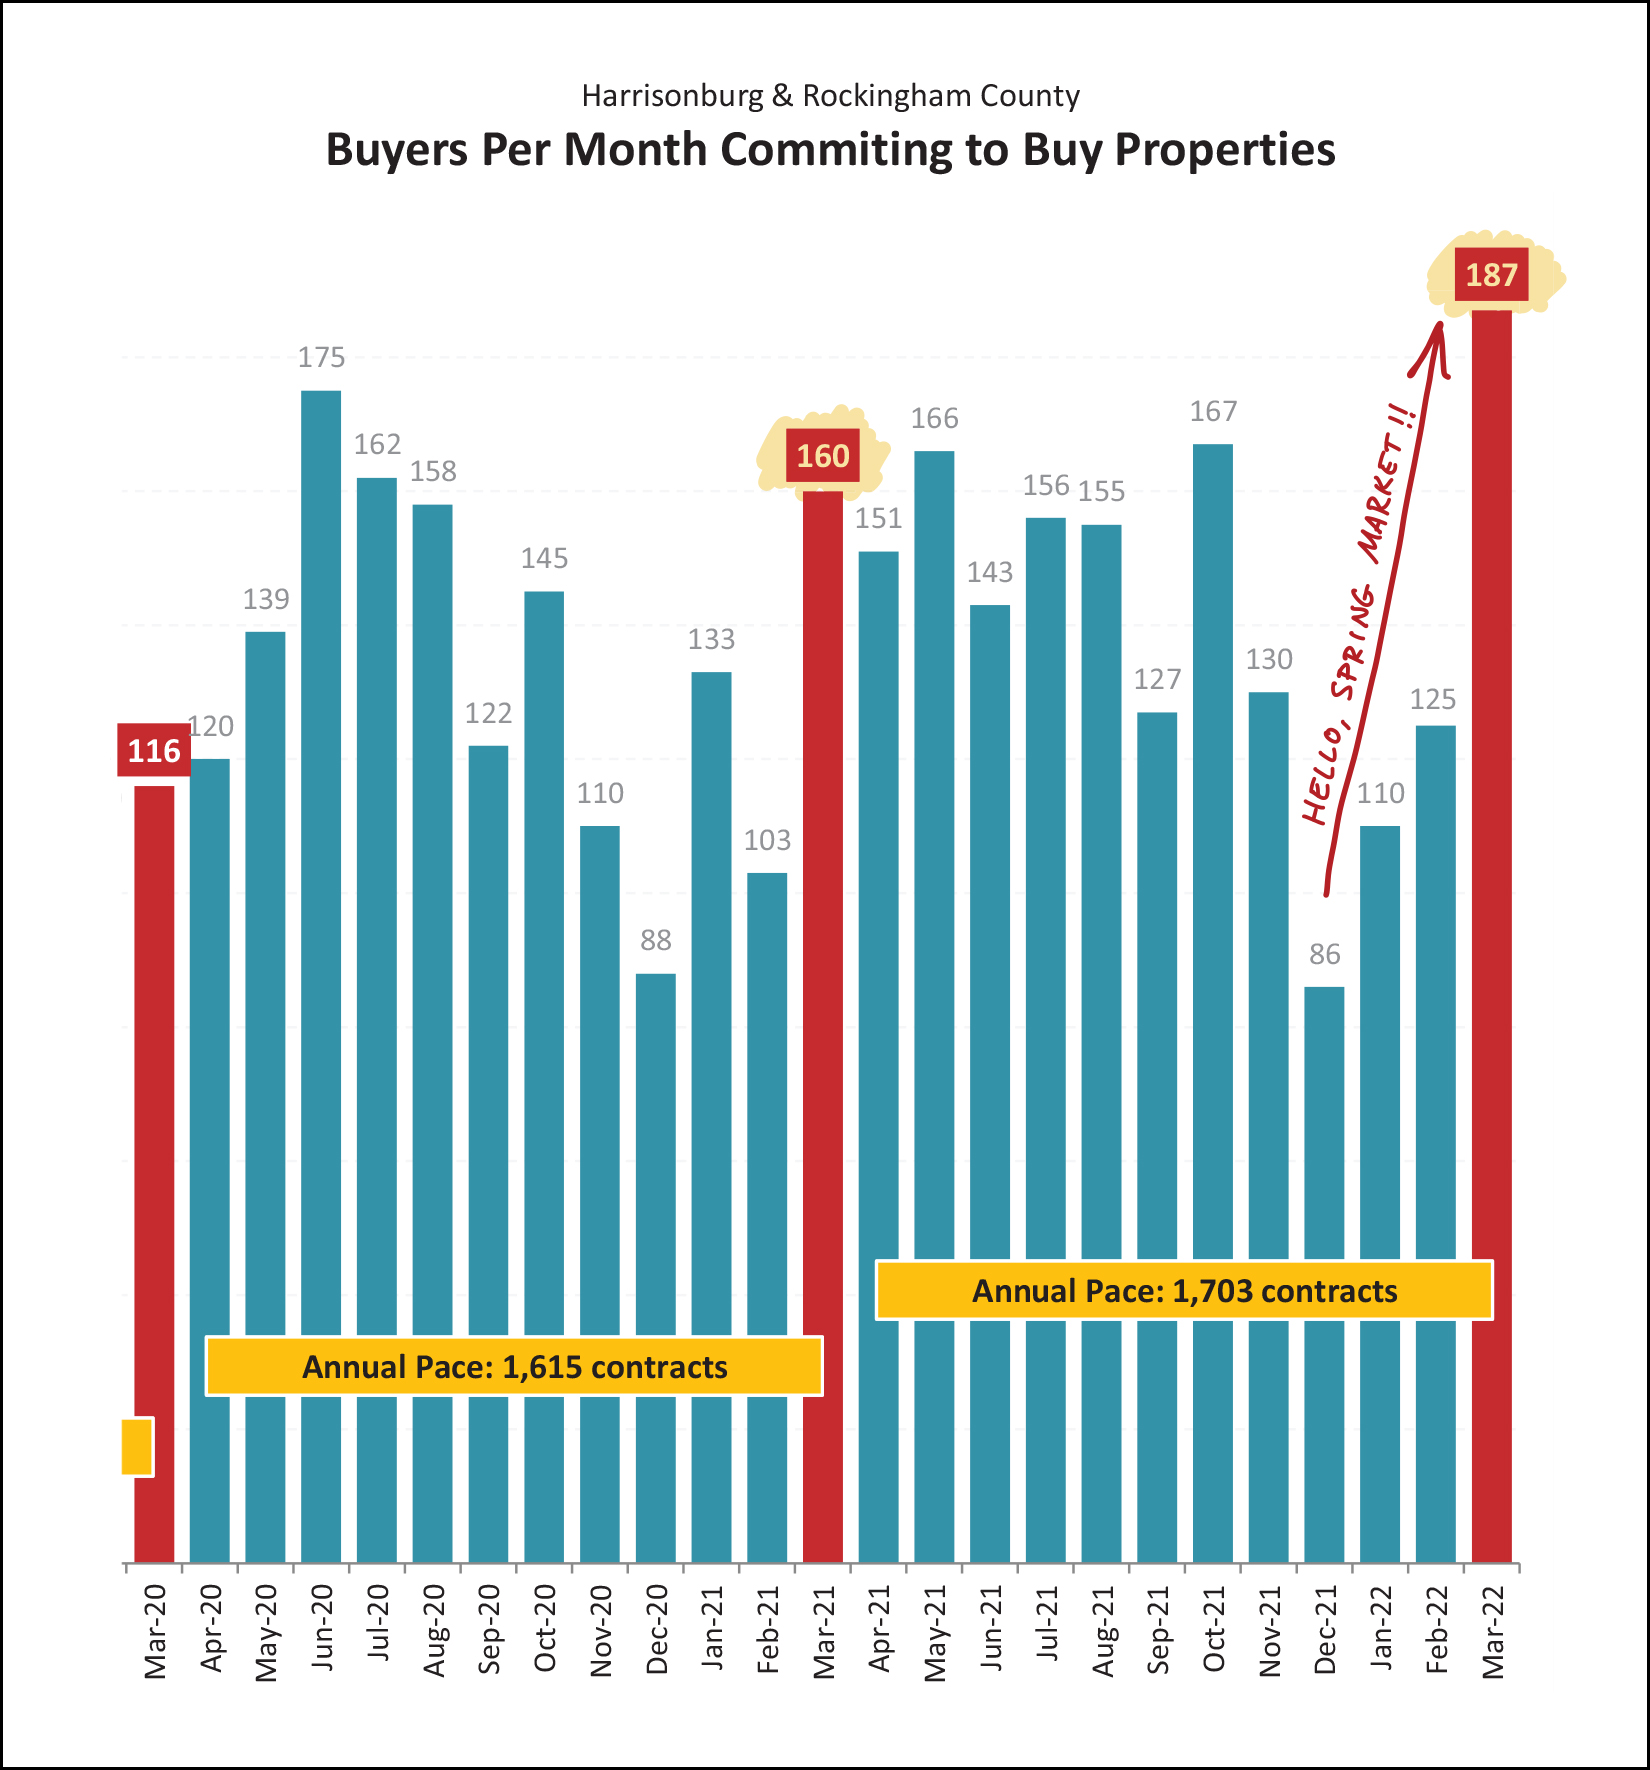 Yowzers! Contract activity was STRONG in March 2022! After a somewhat slow start to the year as far as buyer and sellers signing contracts to buy and sell... things took off in March! There were 187 contracts signed during March 2022, which was well above the 160 seen last March! And yes, as I alluded to a few times, this probably means we're going to see a rather strong month of closed sales in April. If that, indeed, happens, the slower month of March sales will then have quickly become a distant memory. Stay tuned. Maybe more buyers are buying (in March) because more sellers were willing to sell... 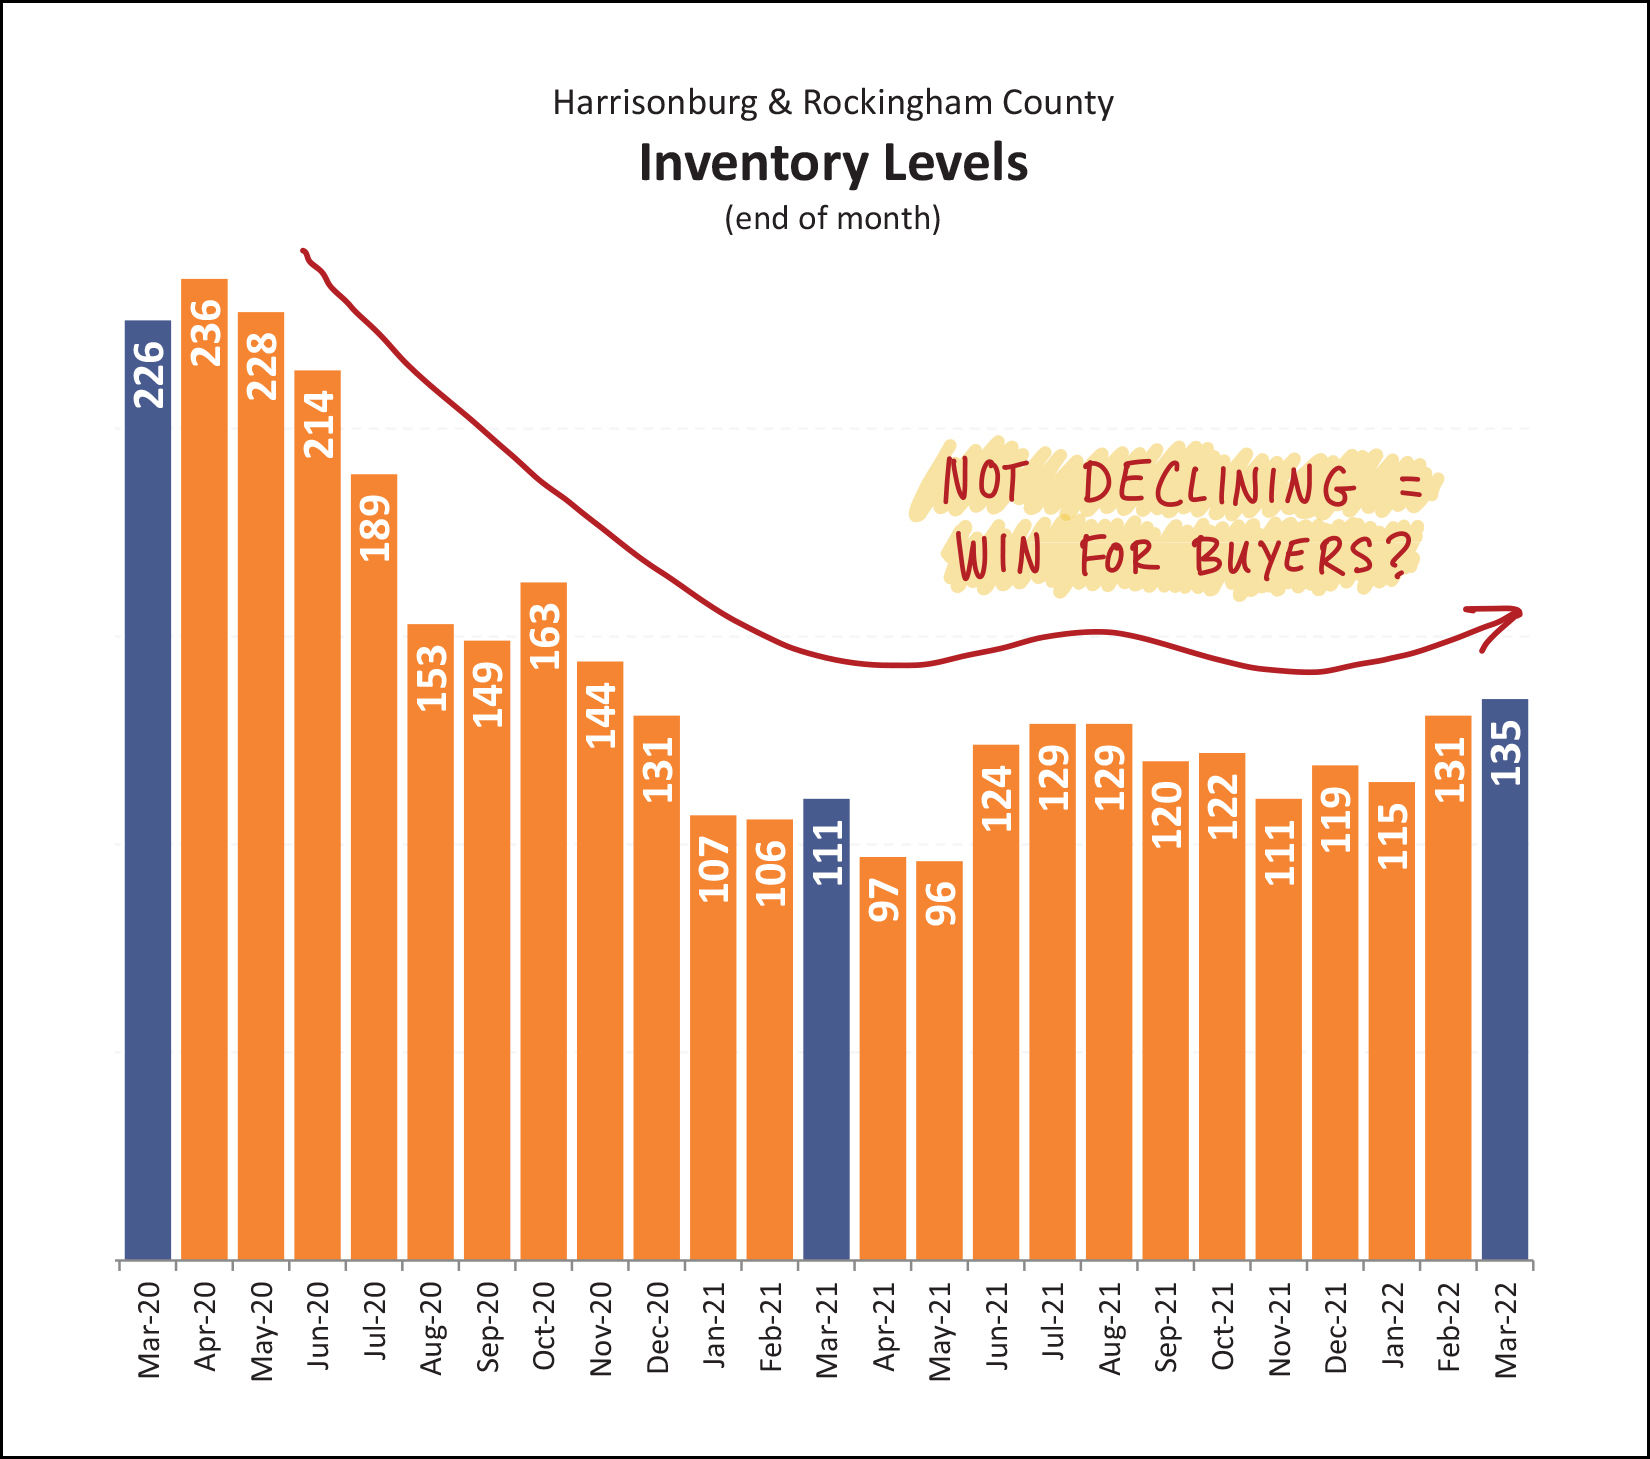 After many, many months of fewer and fewer homes for sale at any given time, we're finally seeing that metric staying stable and increasing ever so slightly. Maybe this is a win for buyers... at least inventory levels didn't drop any further? Whatever we can do to encourage home buyers in this market, let's do it, because it can be a discouraging time to try to buy a home right now! Below is another picture of why it can be discouraging to try to buy right now... and I guess this one is a reverse plateau...oops, a valley!? 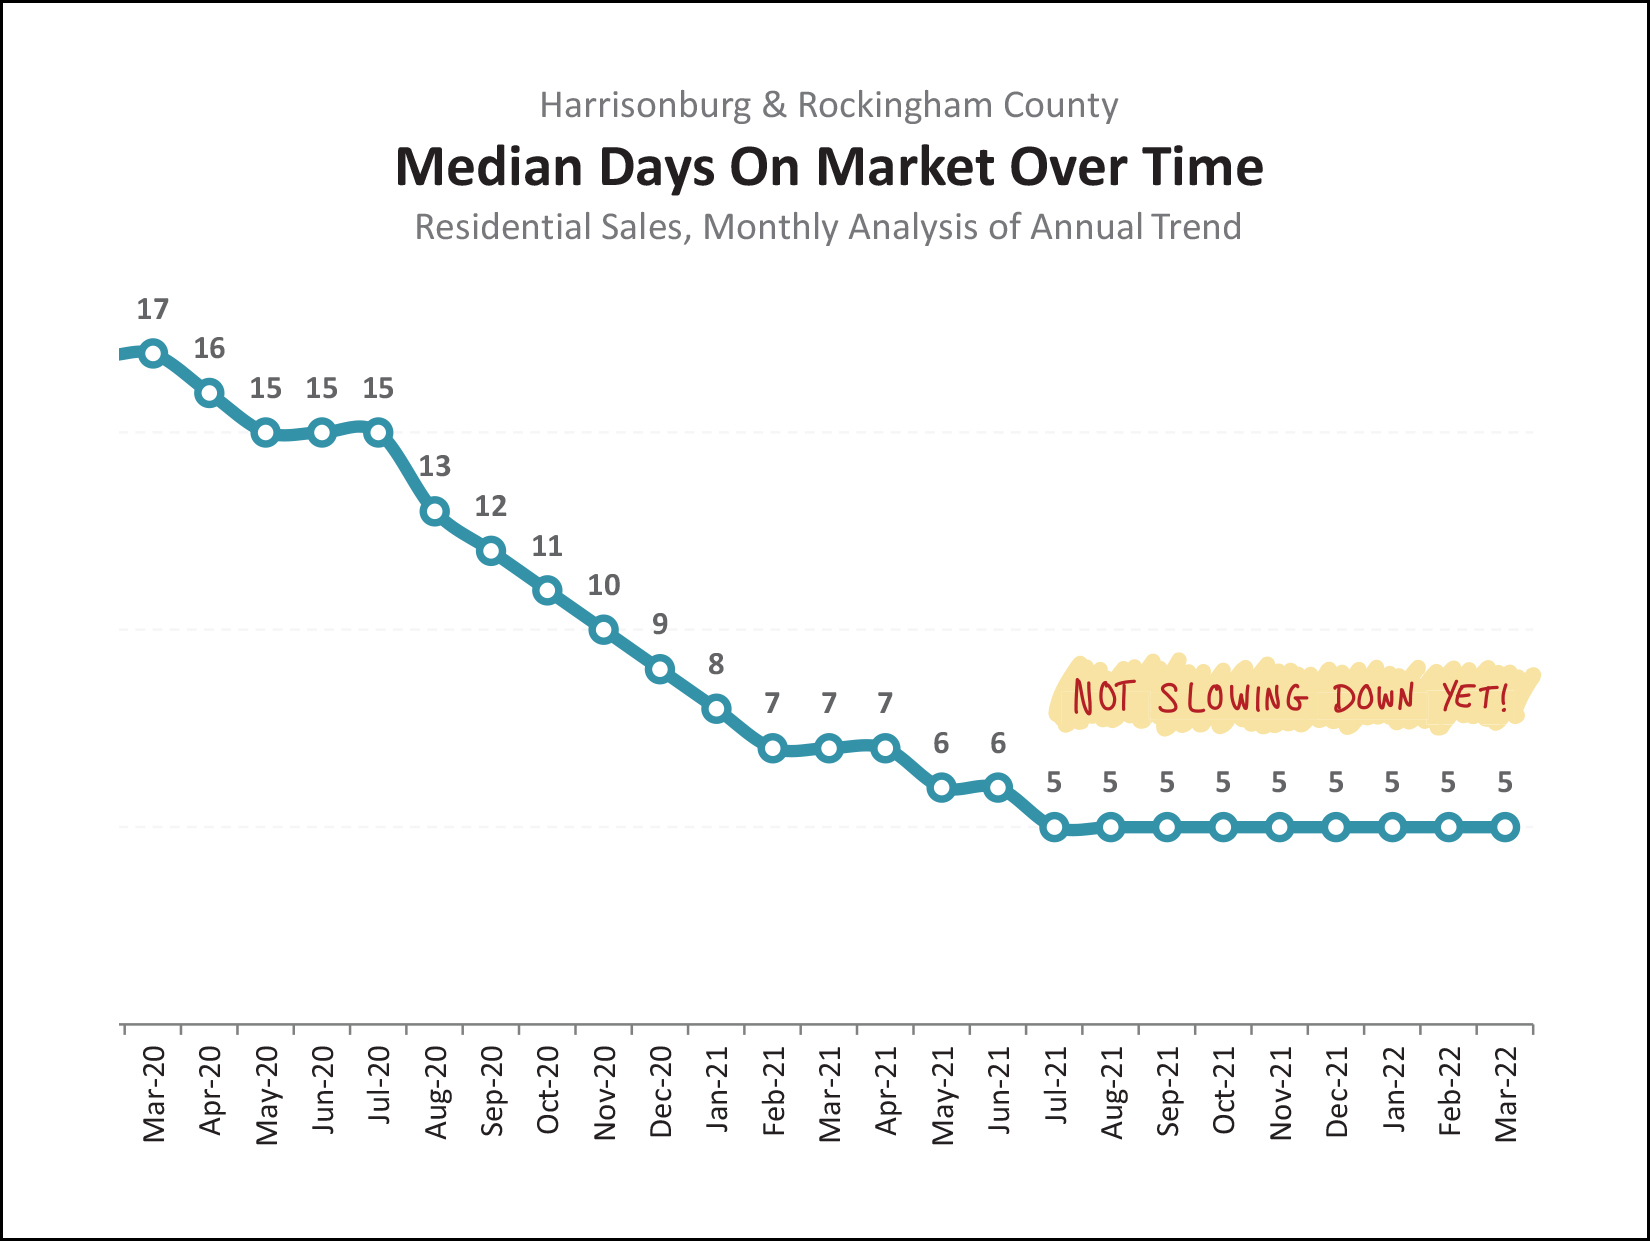 This chart is measuring the annual trend of how long it takes for homes to go under contract once they are listed for sale. That very last data point of "5" means that over the past 12 months the median "days on market" was five days. So, half of the homes that sold went under contract in five or fewer days. So, so fast! This makes it somewhat more difficult to be a thoughtful, intentional, deliberate home buyer, because you are going to need to make a decision quickly!! And one last graph, that even shocked my Apple Pencil as I doodled on this month's graphs for you... 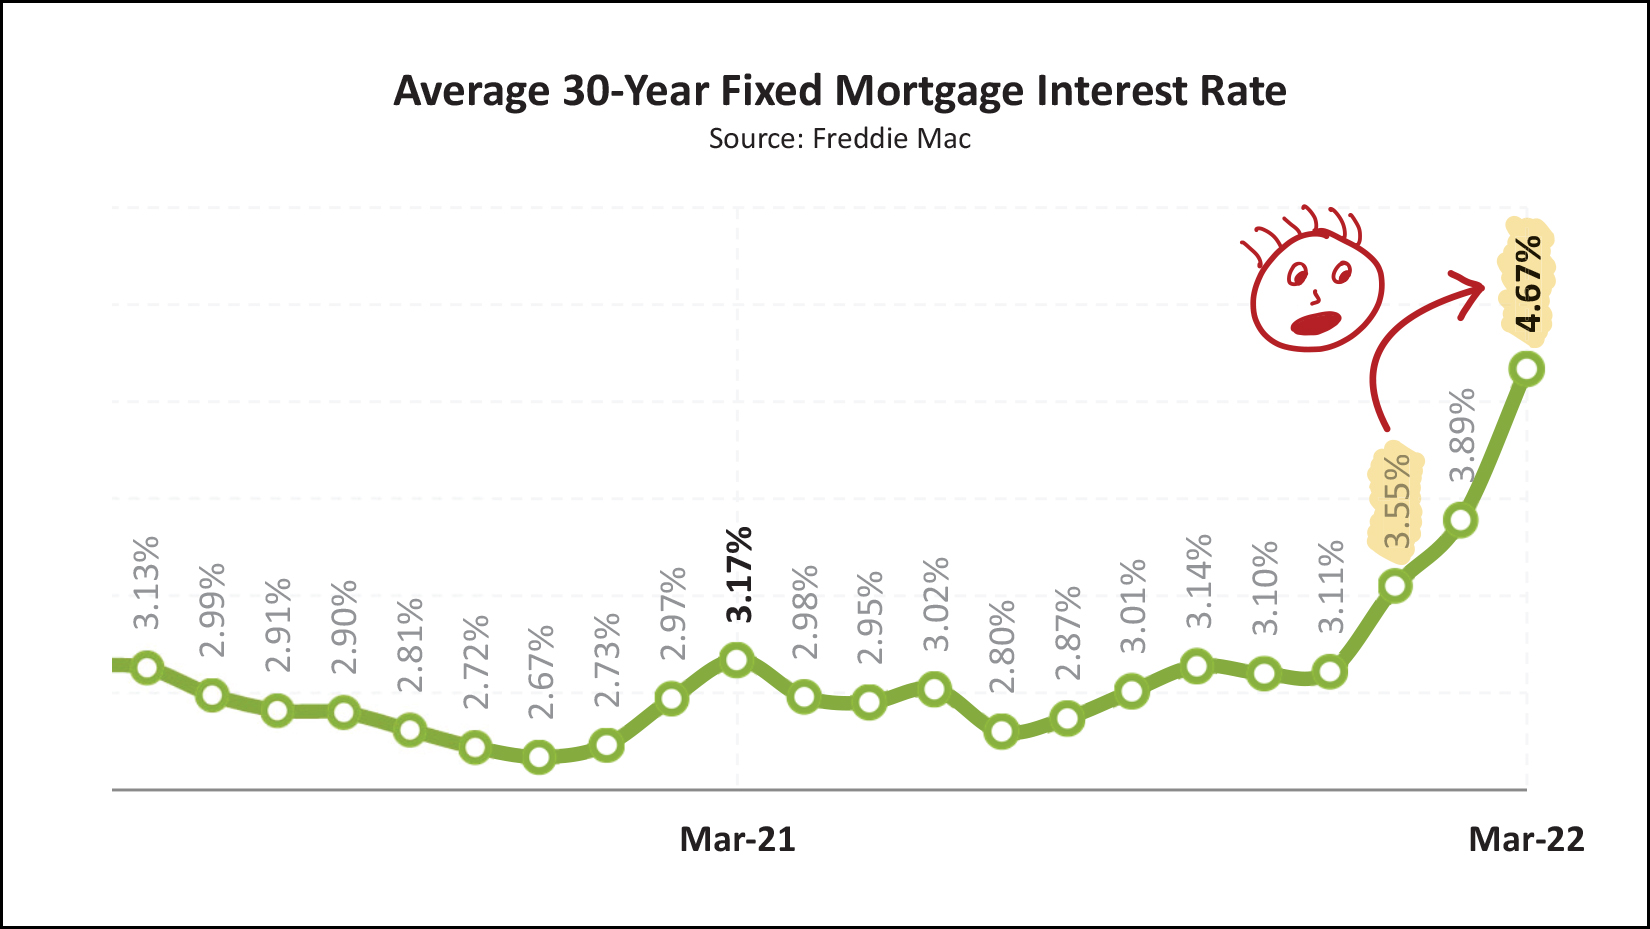 Yes, you are seeing that correctly. You can gasp as well if you'd like. Over the past two months, the average mortgage interest rate has risen from 3.55% to 4.67%. That was fast!?! For years now, I have incorrectly predicted that mortgage interest rates would really start to increase soon. As we entered 2022 it became clear that the time had really could when we would see rates start to increase... but I certainly wasn't expecting it to happen this quickly. Will rates push past 5% as we continue through the year? Will they stabilize between 4.5% and 5%? Any buyers who is hoping to buy in 2022 is carefully watching these rates as it relates to their potential monthly housing costs. OK! That brings us to the end of this month's recap of our local housing market. As you can see, there is a lot going on... home sales are slowing a bit, prices keep climbing, contracts are stronger than ever, interest rates are soaring... so much to watch as we move into the hustle and bustle of the spring market! Finally, some action items for you... [1] Go enjoy a meal at Vito's Italian Kitchen and take a friend, family member, or neighbor with you! [2] Are you preparing to sell your home this spring? Let's set up a time for me to swing by your house to walk through together and talk about house preparations, the market, the process and timing. Email me or call/text me at 540-578-0102 to get that process started. [3] Ready to buy? It can be done! Let's chat about what you hope to buy, and I can connect you with a few of my favorite lenders if you need some recommendations. Signing off now... reach out anytime if you need anything... and if you have a family member, friend, colleague or neighbor that is looking to buy or sell soon, feel free to send them my way. I'd be happy to help. | |
Home Sales Rise Again, Along With Prices, In February 2022 |
|
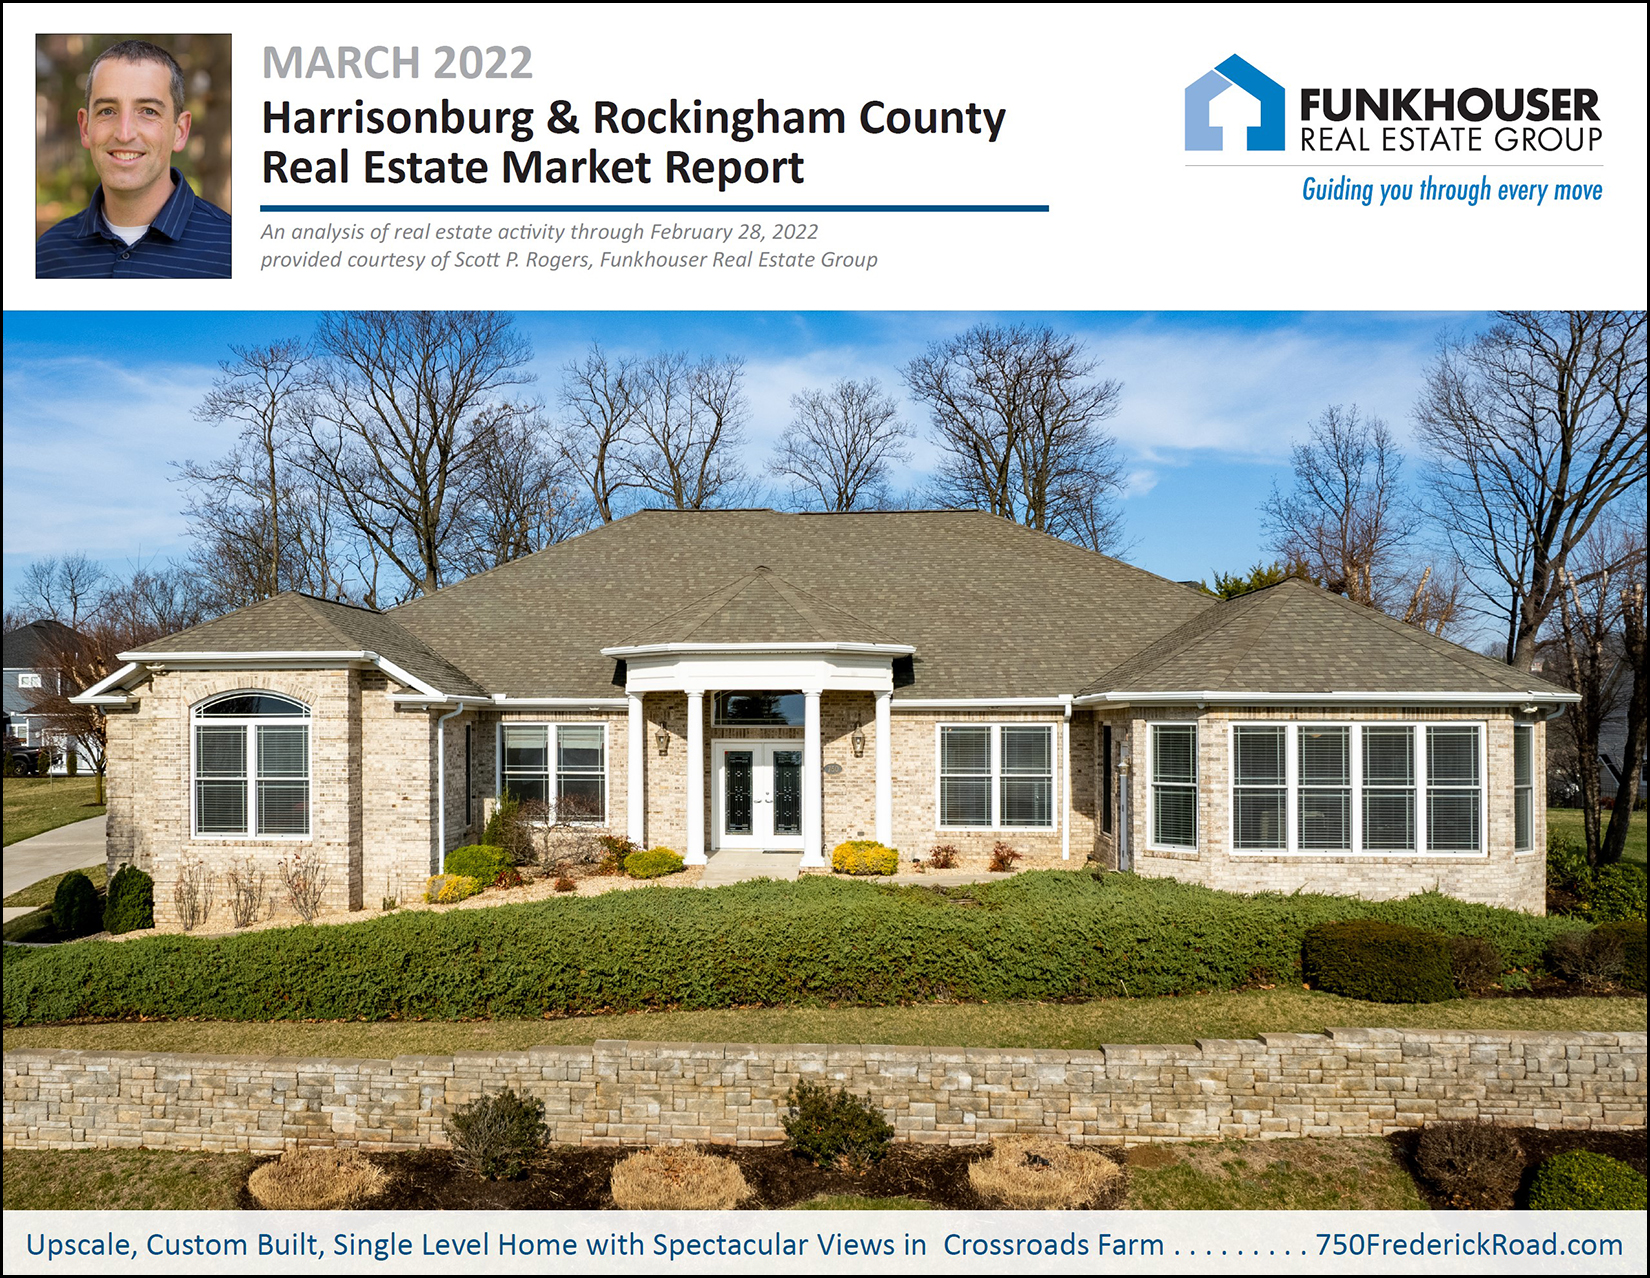 Happy Friday Morning, and for many of you, Happy (end of) Spring Break! I hope your week has gone well, whether you had a break or not. I was able to skip town for part of this week down to Virginia Beach where I was delighted to experience several beautiful sunrises like this one on Monday...  There sure is something relaxing about being near the water... and if the water (and air) were warmer, it probably would have been quite relaxing to be in the water as well! :-) Before I dive into this month's charts and graphs, a few quick notes... Check Out Magpie Diner... Each month in this space I'll be highlighting one of my favorite spots in the 'burg, or surrounding, where I enjoy dining, having a cup of coffee, etc. This month... it's Magpie Diner... a breakfast and lunch restaurant with a diner-inspired menu. If I'm at Magpie, I'll likely be having the french toast of the week with some scrambled eggs and a side of bacon. Yum! Have you checked out Magpie? If not, I highly recommend that you do so sometime this month. To make it even more fun, I'm giving away a $50 gift card to Magpie Diner. Enter your name/email here and I'll pick a winner in about a week. :-) Featured Home... The beautiful home pictured above is a custom built, single level home with amazing views from the top of Crossroads Farm. Check out additional photos and all of the details of this home by visiting 750FrederickRoad.com. Download All The Graphs... Some of you prefer to download the full slide deck of charts and graphs. You can do so here. Now, let's move on to the market data... 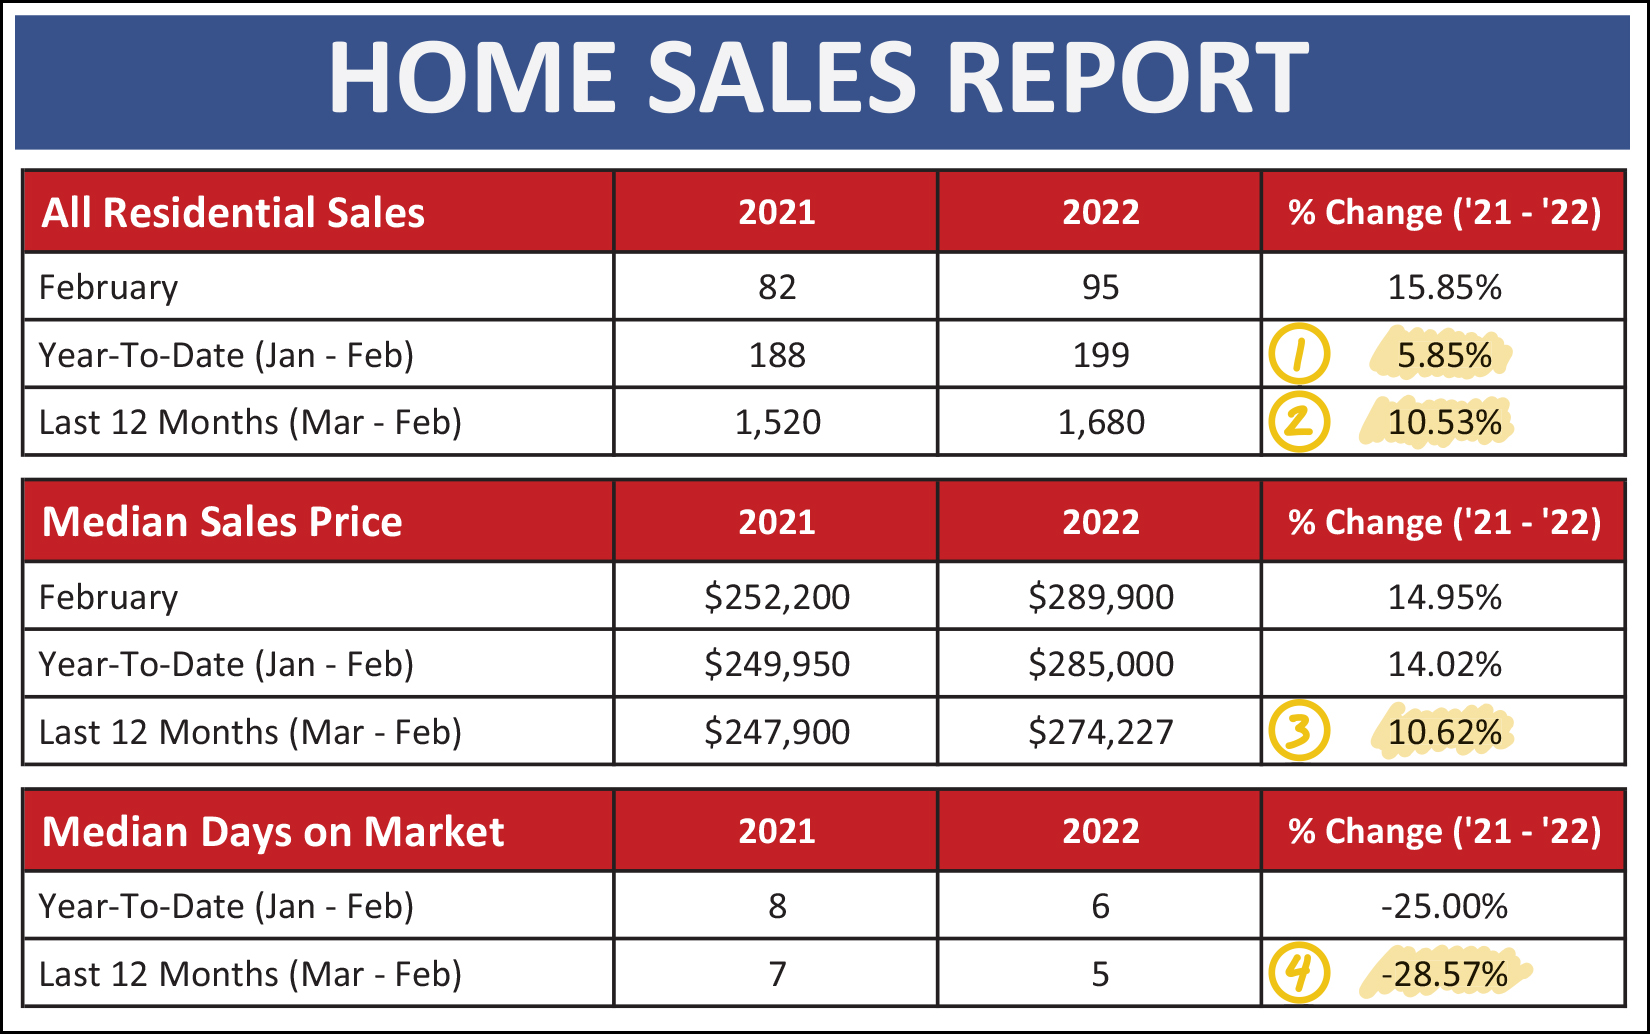 As shown above, things started getting busier in February... [1] There have been 199 home sales in Harrisonburg and Rockingham County thus far in 2022... which is a 5.85% increase from the same timeframe last year. [2] When looking at the past 12 months there have been 1,680 home sales in our local market, which is an even larger (10.53%) increase over the prior 12 months. [3] These increase in the quantity of home sales have been accompanied by an 11% increase in the median sales price over the past year. The median sales price of all homes sold in Harrisonburg and Rockingham County increased from $247,900 up to $274,227 in the last year alone! [4] If you thought homes couldn't sell any faster... you (and I) were wrong. The median "days on market" for Harrisonburg and Rockingham County has fallen 29% over the past year... from a median of seven days to a median of five days! But, despite these strong increases across the board... not all property types have seen the same changes over the past year... 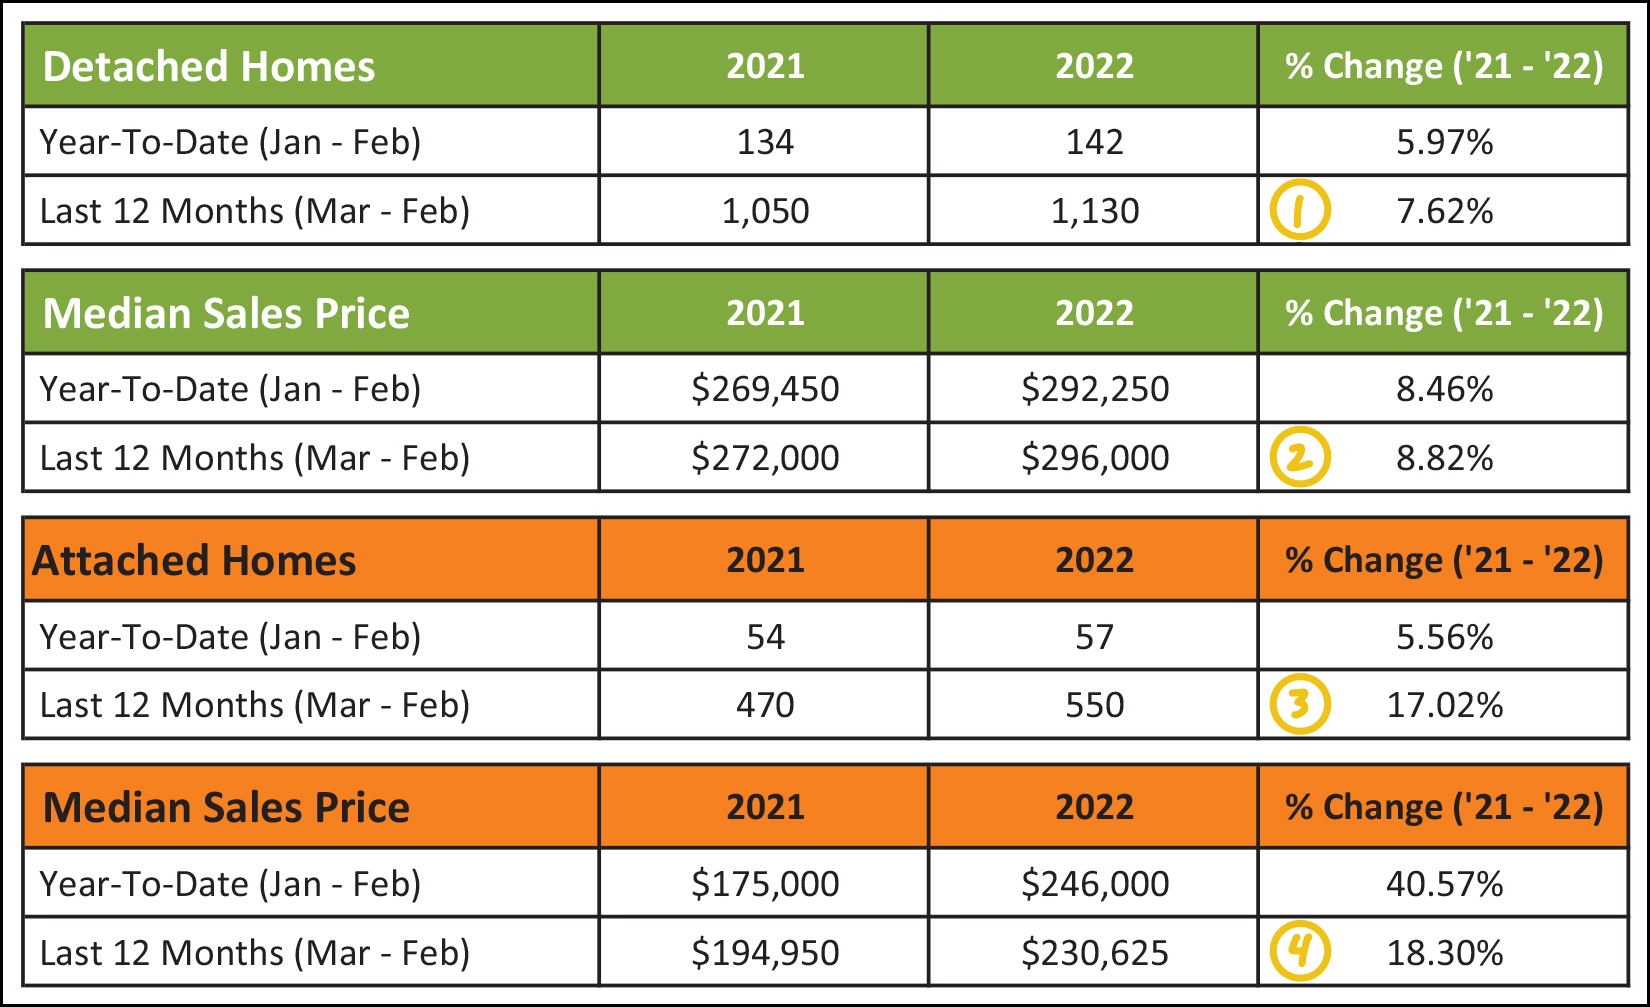 As shown above, the "attached" portion of the local market (townhomes, duplexes and condos) have seen a bigger boom over the past year than detached (single family) homes... [1] We have seen 8% more detached home sales in Harrisonburg and Rockingham County over the past year as compared to the prior year, while... [3] We have seen a much larger 17% increase in attached home sales during that same time. [2] The median sales price of detached homes has increased 9% over the past year, while... [4] The median sales price of attached homes has increased by 18% in a single year! So, it has certainly been a good time to sell (and a tough time to buy) a townhouse or duplex lately! Looking at the monthly "play by play" we can see that things started to get a bit spicy in February... 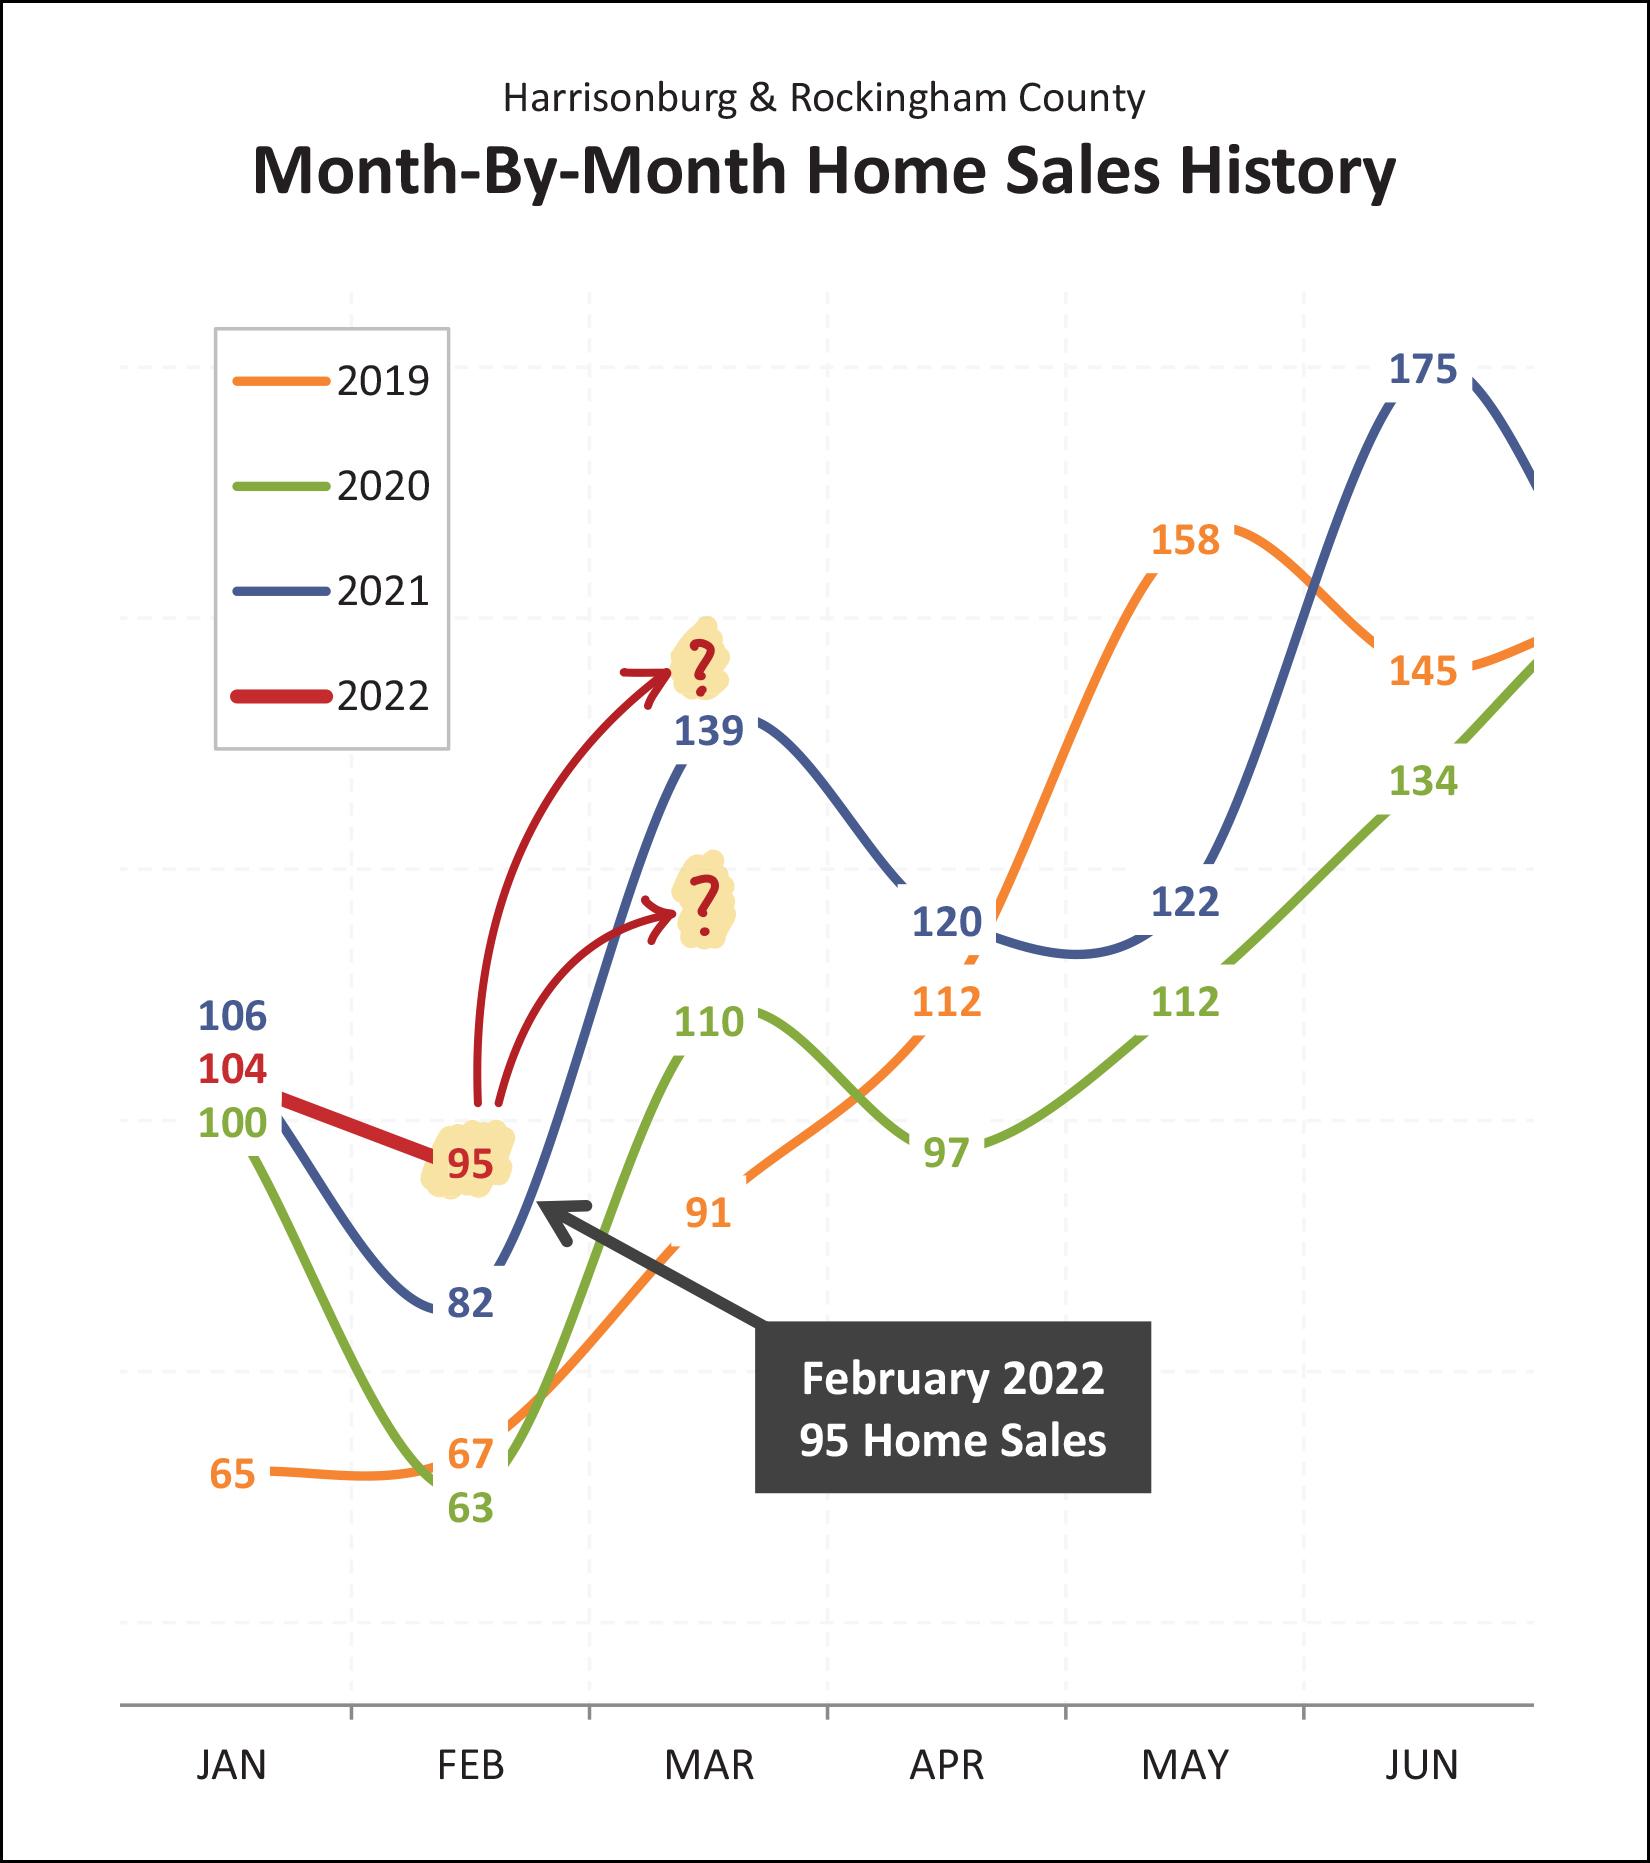 As you might notice, above, the 104 home sales we saw this January fell right in the middle of the pack for what we might have expected in a January. But... February was different. We saw 95 home sales this February which was well and above any other recent month of January. Where do we go from here? We'll know within the next few weeks as we finish out March. Will we be able to surpass last March's very, very active month with 139 home sales? Will we fall somewhere between March 2020 and March 2021? Stay tuned to find out. I know we're only two months into the year, but... 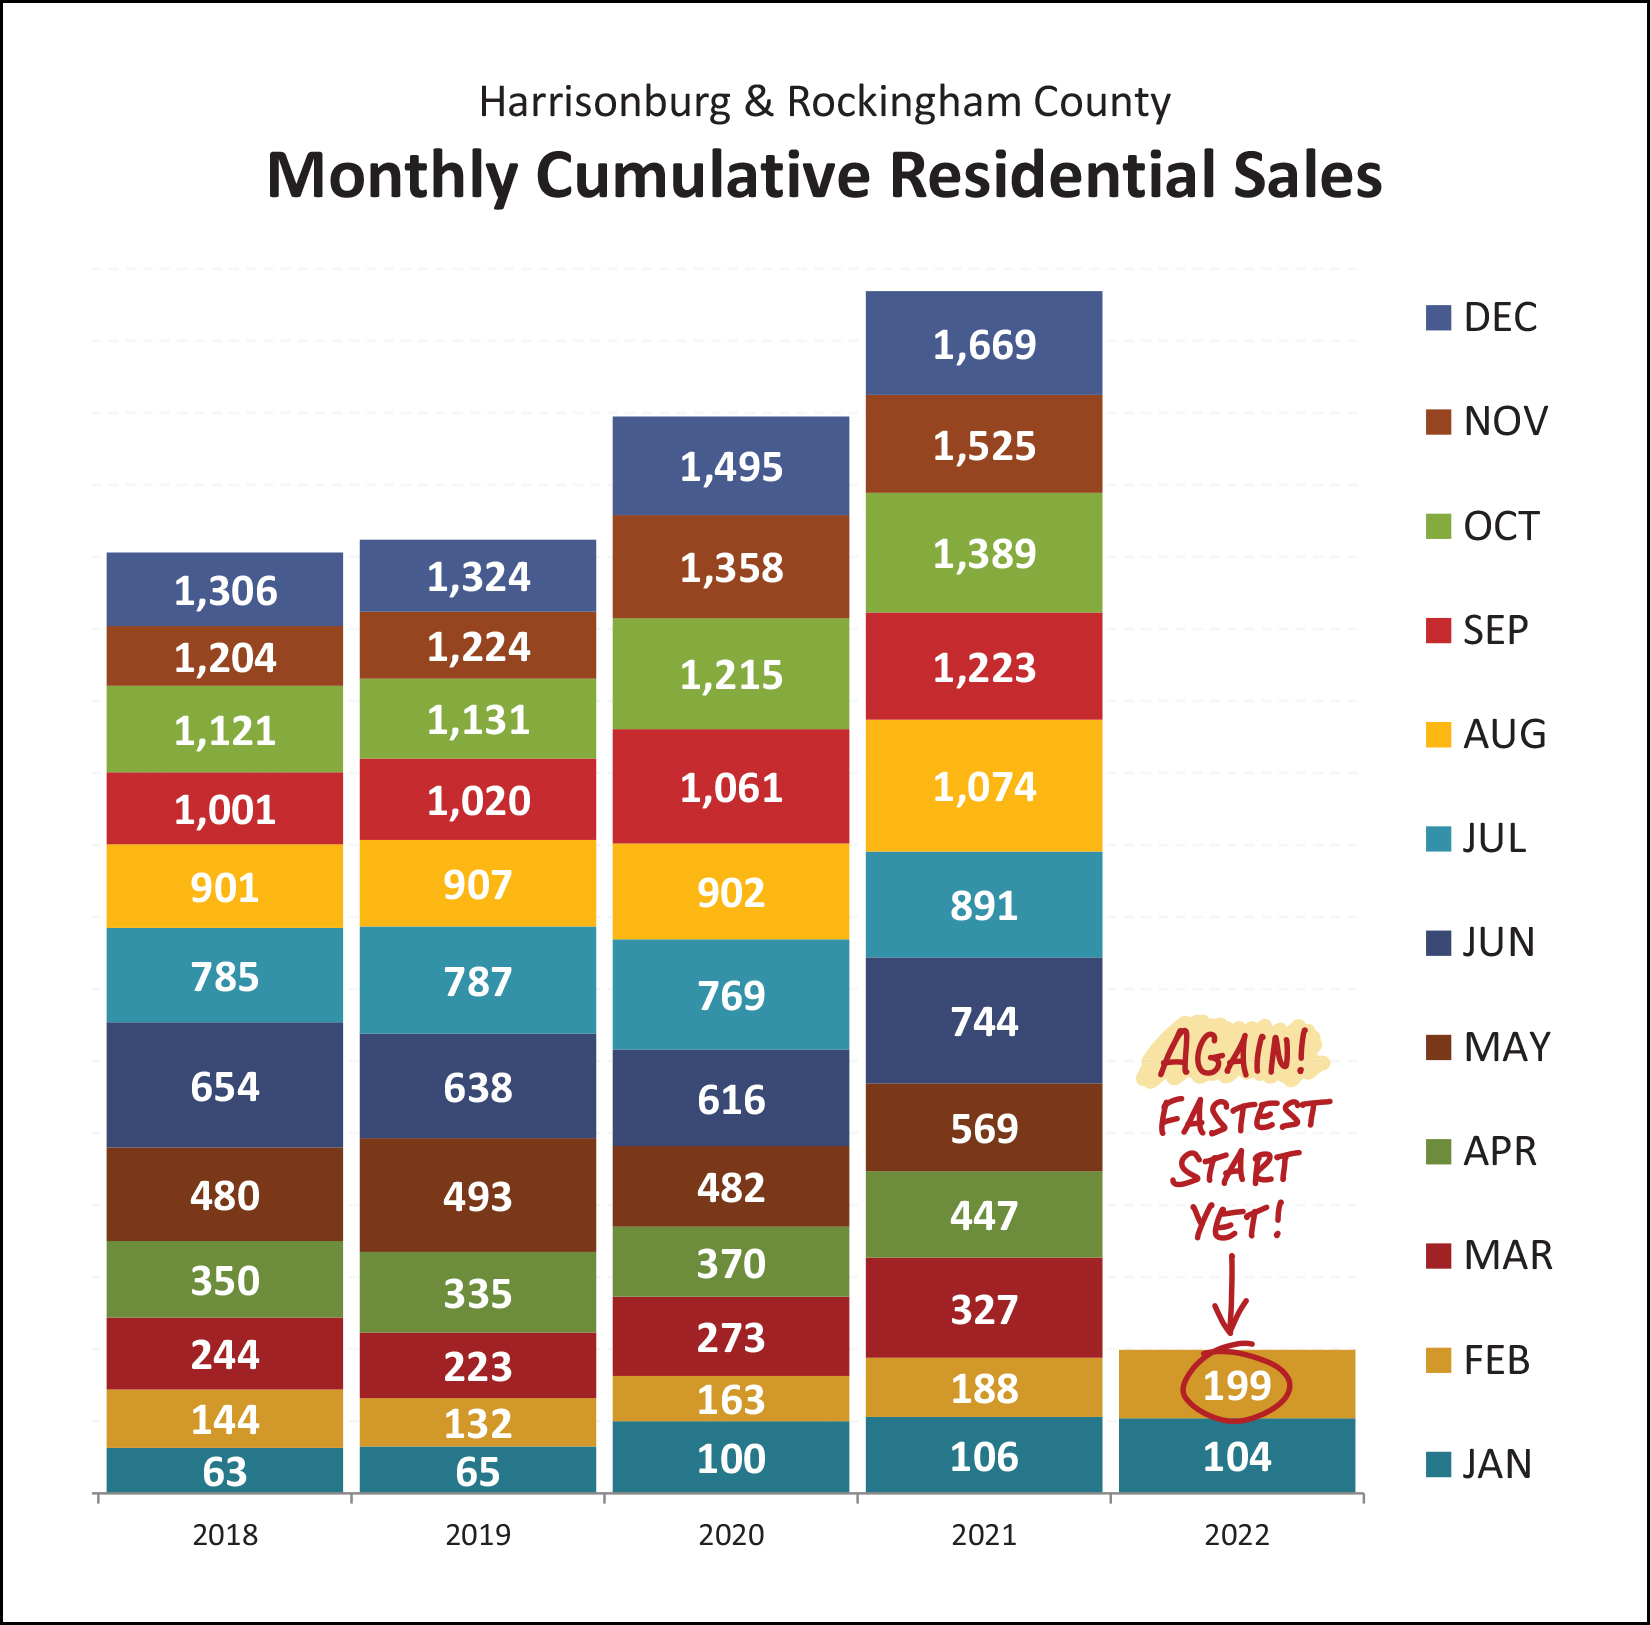 Yes, again, we are setting new records. In 2020, the 163 home sales see in January and February was the fastest start in many years. Then in 2021, I said the same about January and February with 188 home sales. And yet, here we are again, with 199 home sales in the first two months of the year, we seem poised to see another fast paced and highly active year in our local real estate market! Someone asked me recently if Covid had been a real drag on the local housing market. Yes, I said, for a few months... 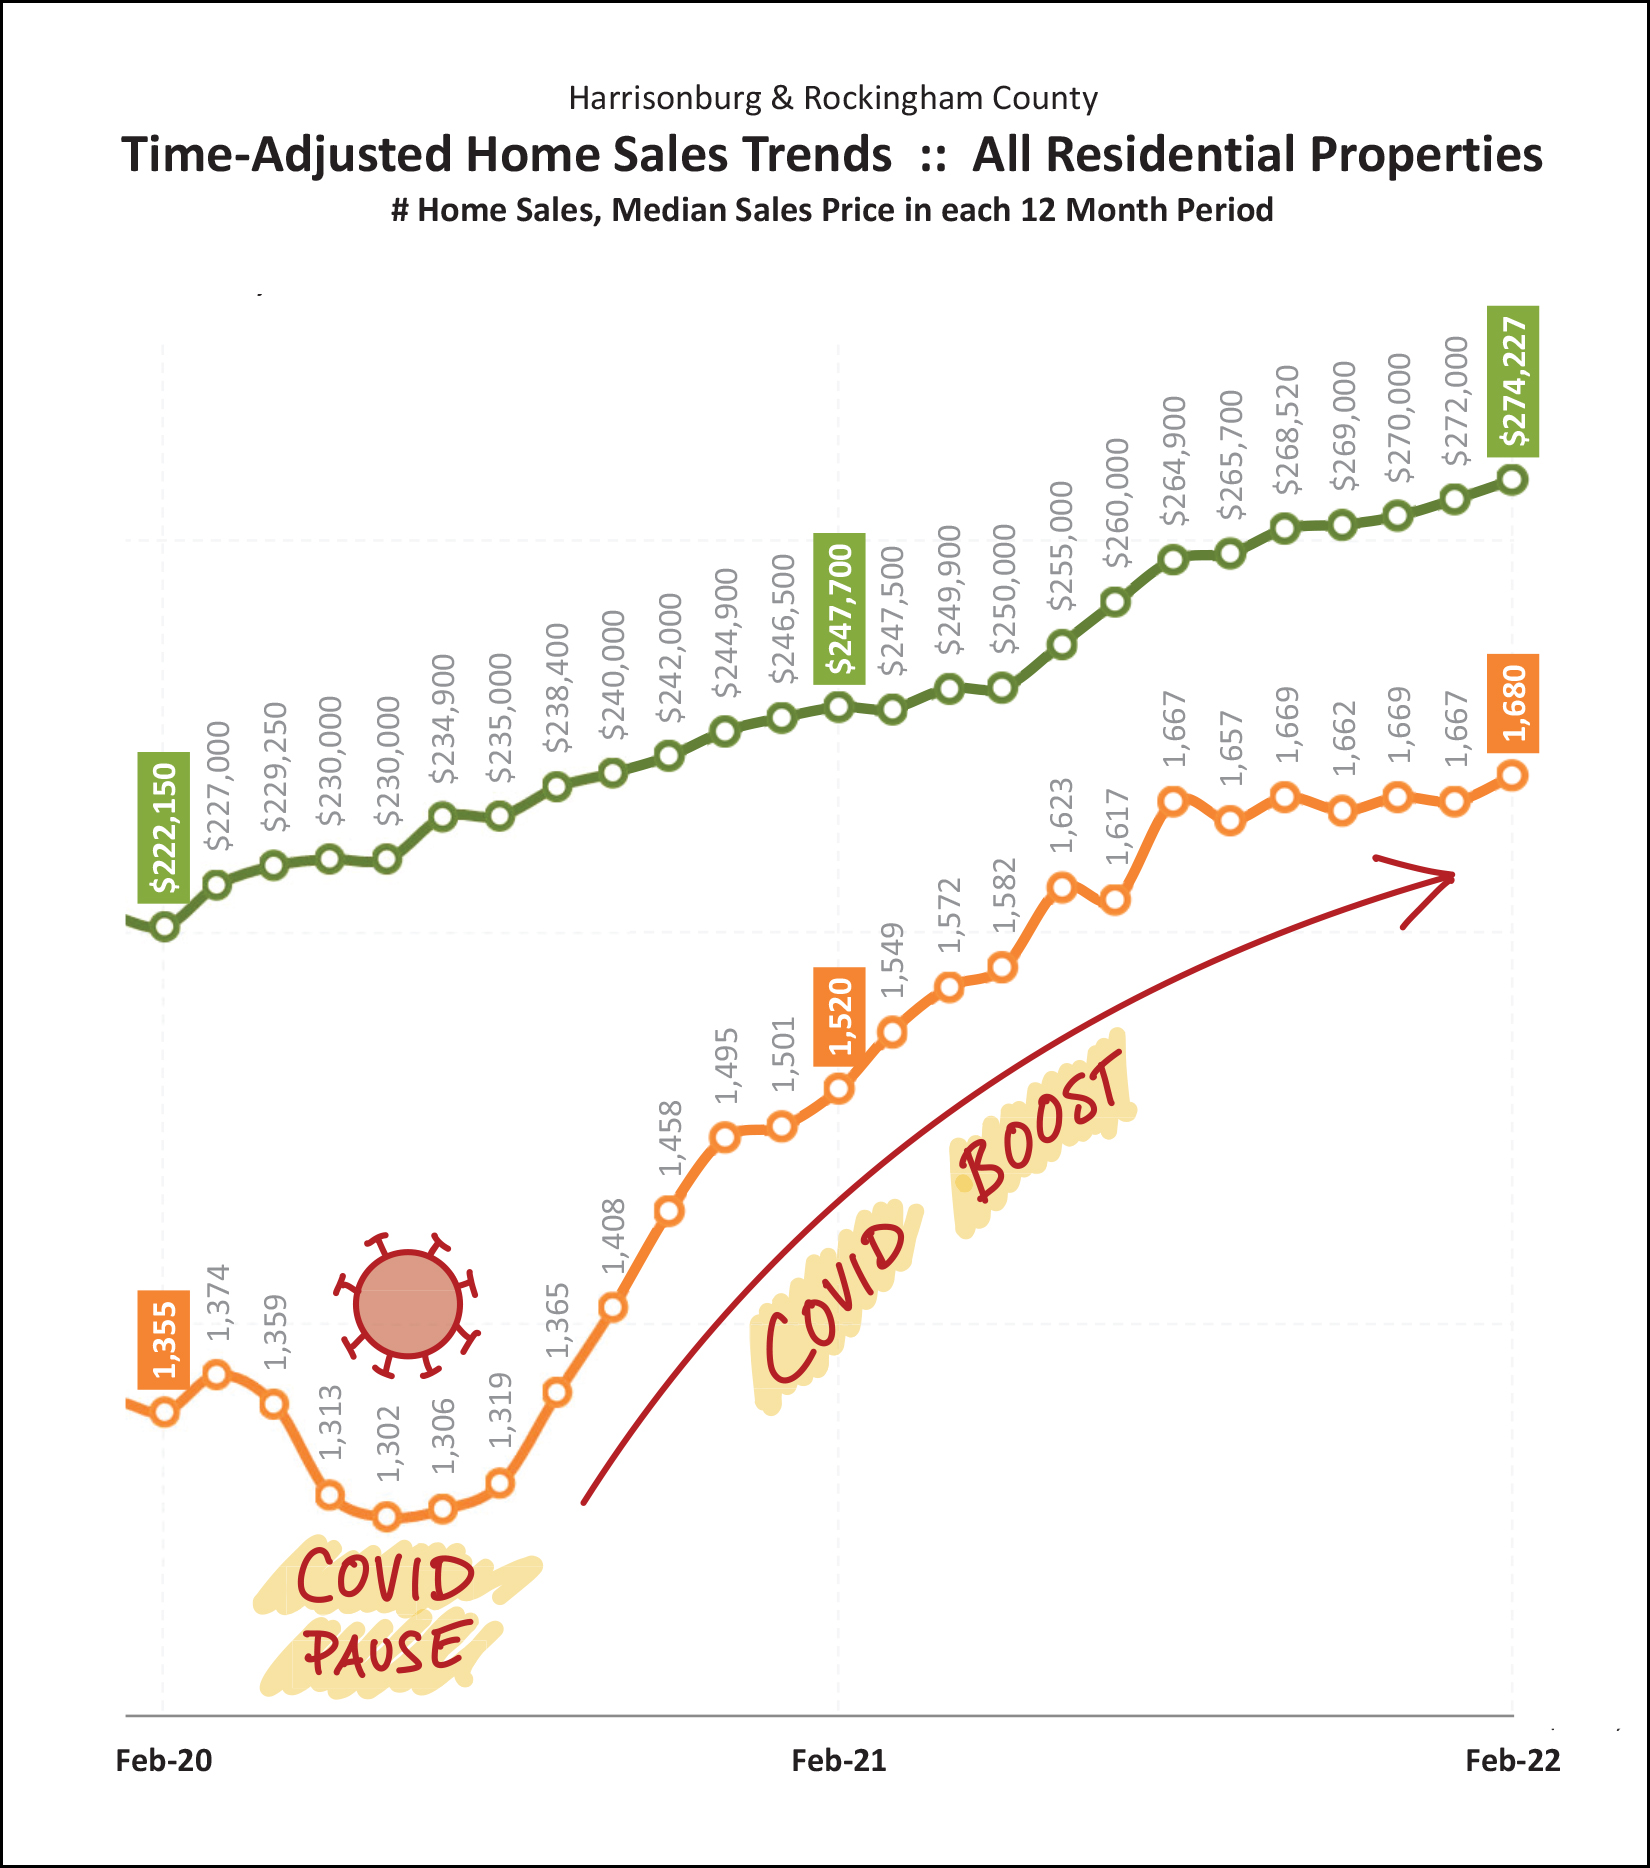 You'll notice on the graph above that Covid did seem to drag down the annual pace of home sales in early 2020... between April 2020 and September 2020. But then as we kept moving through fall 2020, and then into and through 2021, things just wouldn't let up. We saw month after month (with only a few exceptions) of stronger and stronger home sales. What caused this? At least some of it was, really, Covid. The place and space we call home became even more critical during the pandemic, and many folks found themselves living in homes that didn't work that well when all of a sudden they were working from home or had kids learning from home. So, "home" became even more important than ever -- causing plenty of homeowners to move to a new home. That, plus super low interest rates (to try to stabilize the economy), plus less discretionary spending, plus stimulus funds, all put more money in the bank accounts of would-be buyers, allowing many of them to jump on into the real estate market. Finally, an increasing number of people found themselves able to work from home... causing some folks to relocate to the Shenandoah Valley to work from a much more beautiful and relaxing place than they may have lived previously. As we continue to work our way through this pandemic that might eventually be considered an endemic, will we eventually see a flattening out or a decline in the pace of home sales in Harrisonburg and Rockingham County? I'm not convinced that we will. Alongside all of the factors referenced above, the overall population growth in this area persists based on employers expanding, local college graduates staying in the area, parents of local college graduates retiring to the area, and much more. I think it is relatively likely we will continue to see a similarly active local housing market over the next few years. OK... tangent over... back to the numbers. ;-) 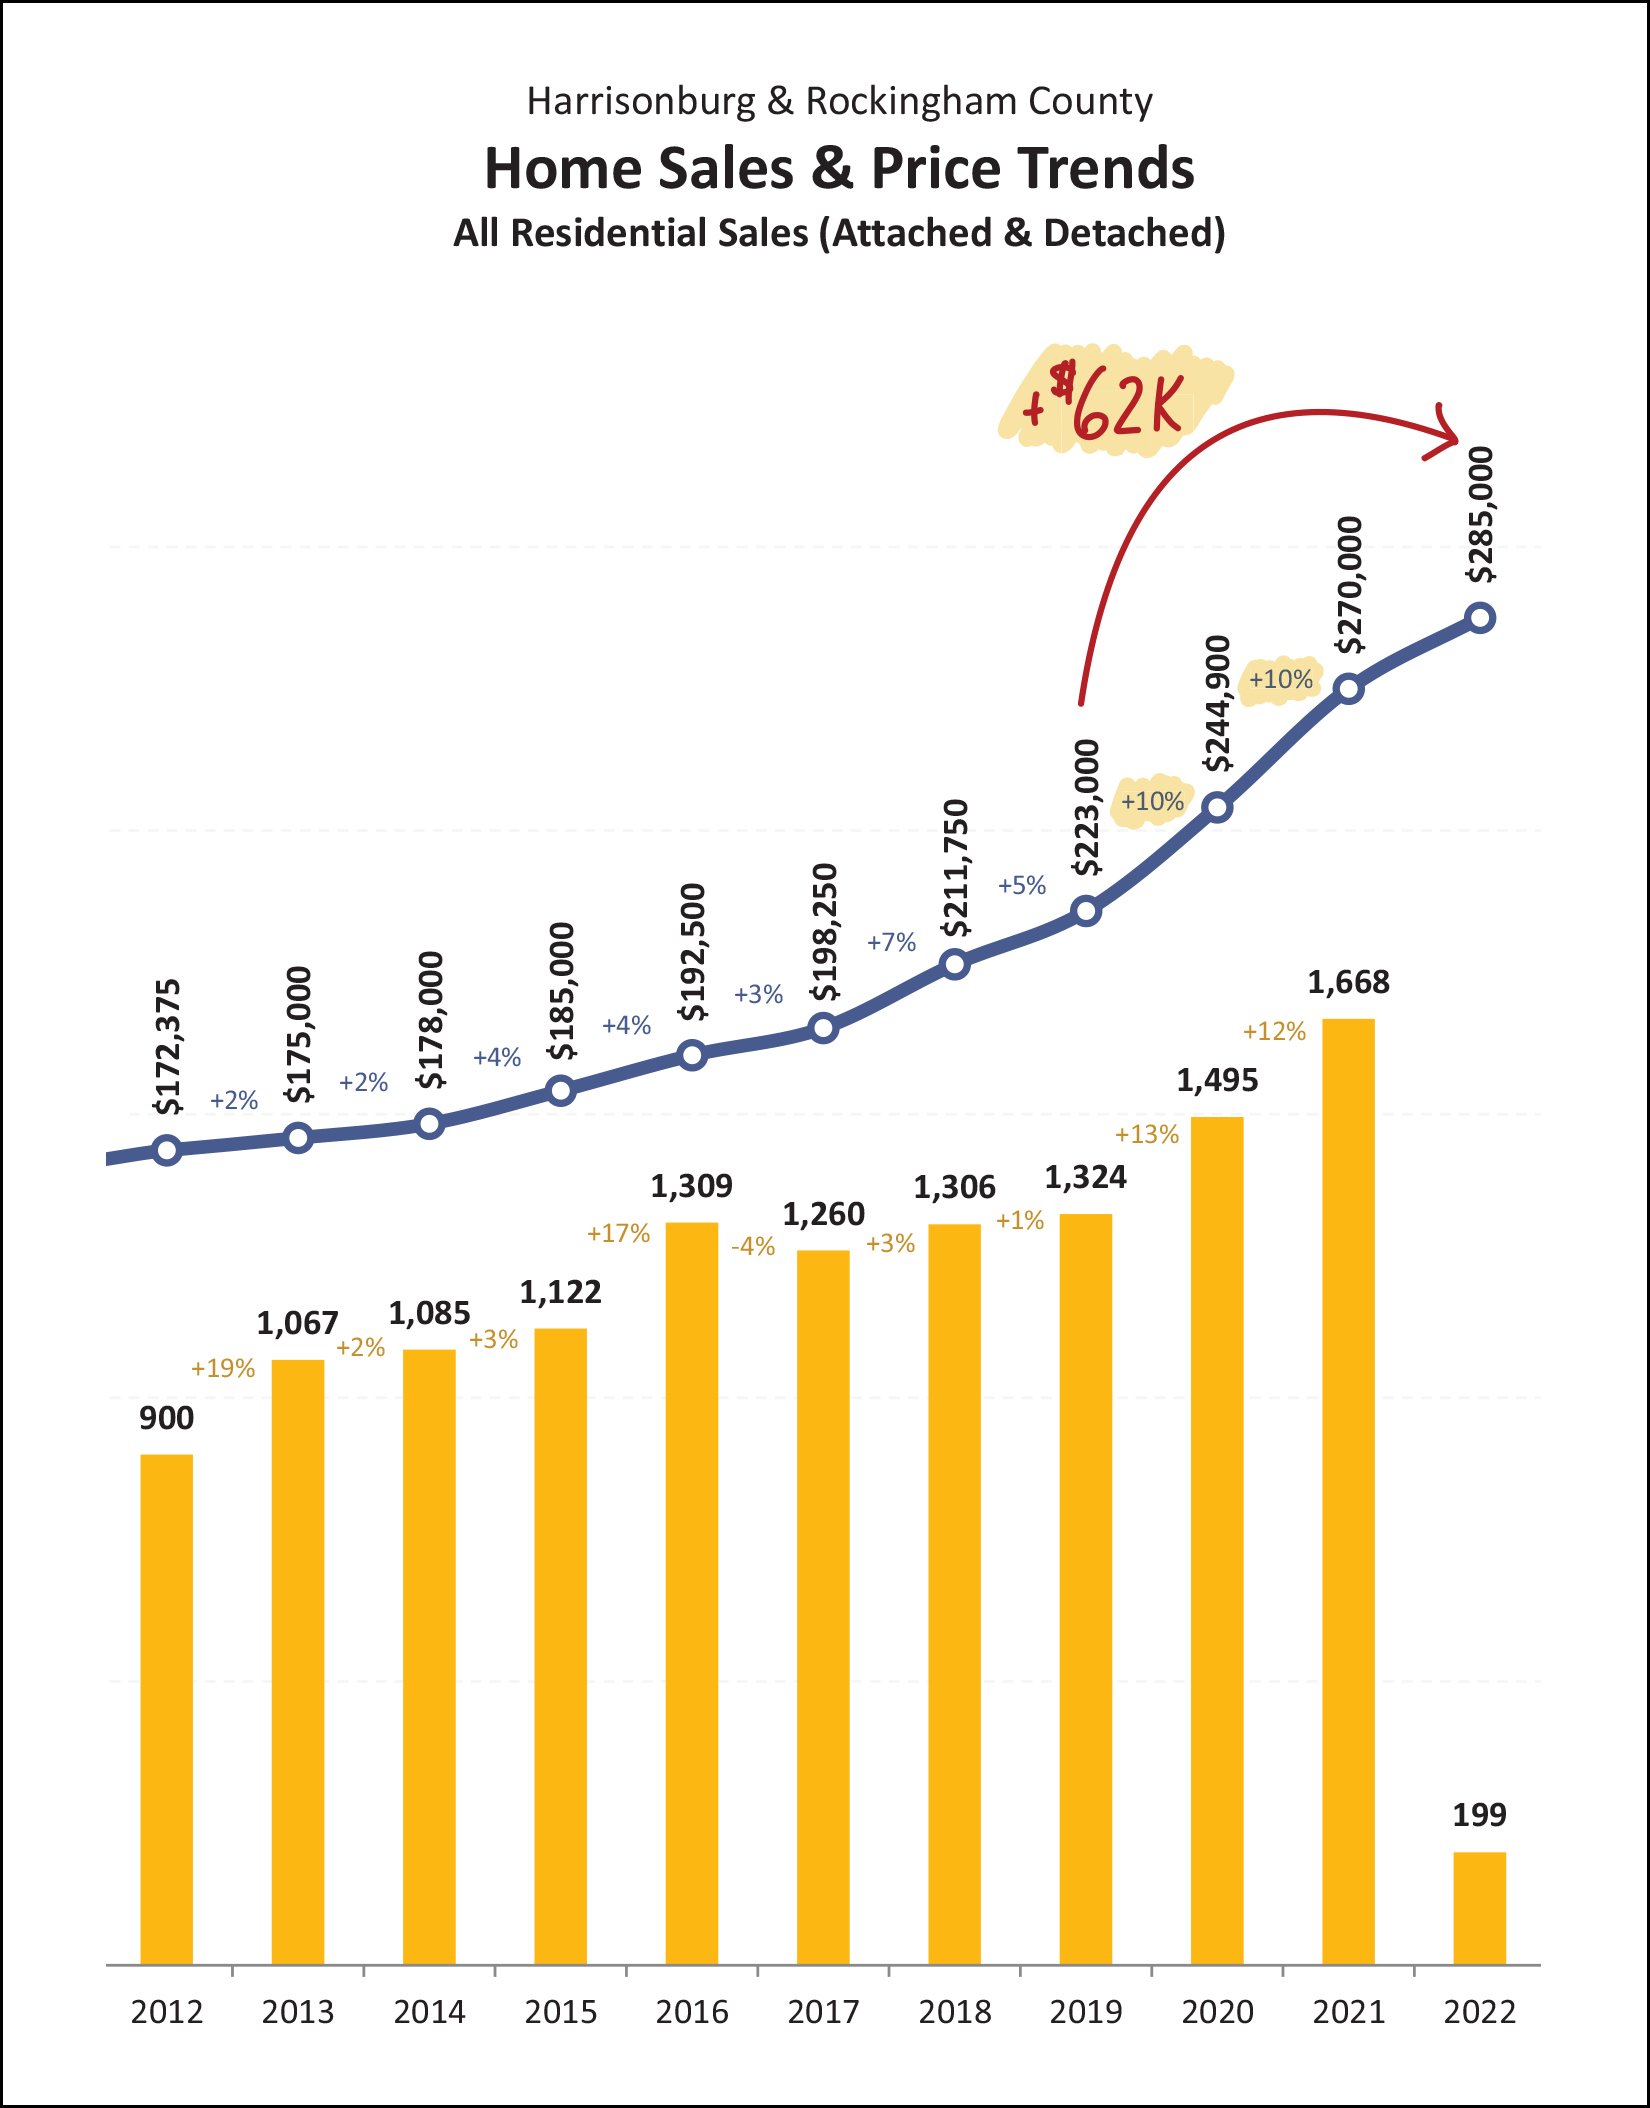 This graph is showing the overall trends in home sales (quantity) and median prices over the past few years. I included it this month to draw out the magnitude of the raw data... we have seen the median sales price increase $62,000 over the past three years! That's great news for sellers, and for homeowners, but certainly is not very welcomed news for home buyers who have not yet bought a home. We saw a 10% increase in the median sales price in 2020 and 2021. I'm not thinking the increase will be as large in 2022, but I do think the median sales price will increase yet again this year. 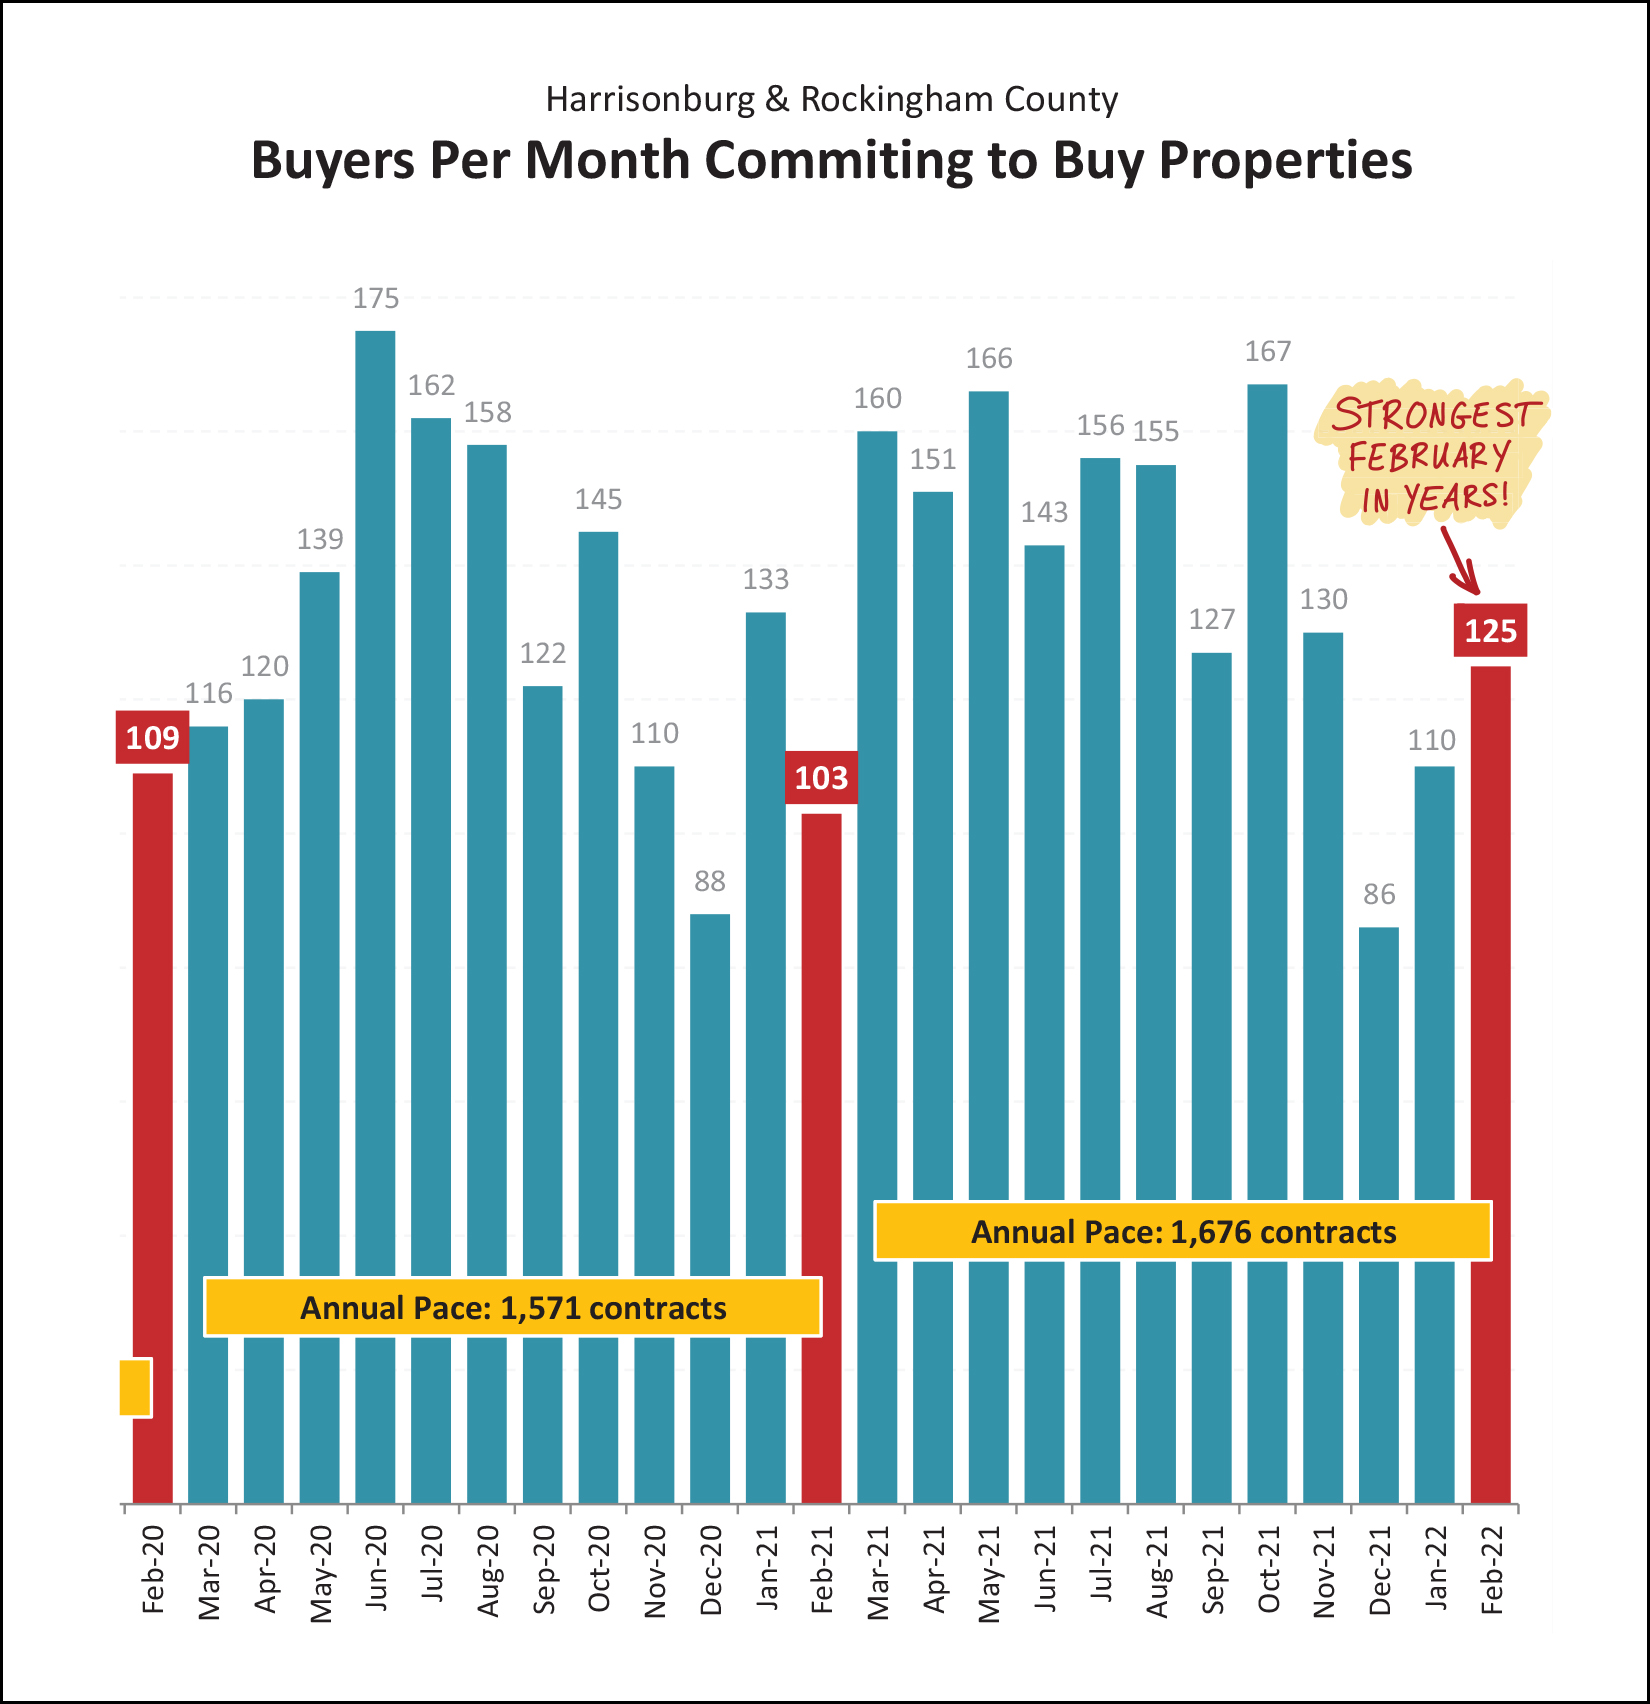 And where might the market be going from here, you might ask? Well... with a very strong month of contract activity in February (see above) it seems very likely that we'll see a strong month of closed sales in March. So, yes, we're about to enter the busiest time of the year... between March and August. Get ready! 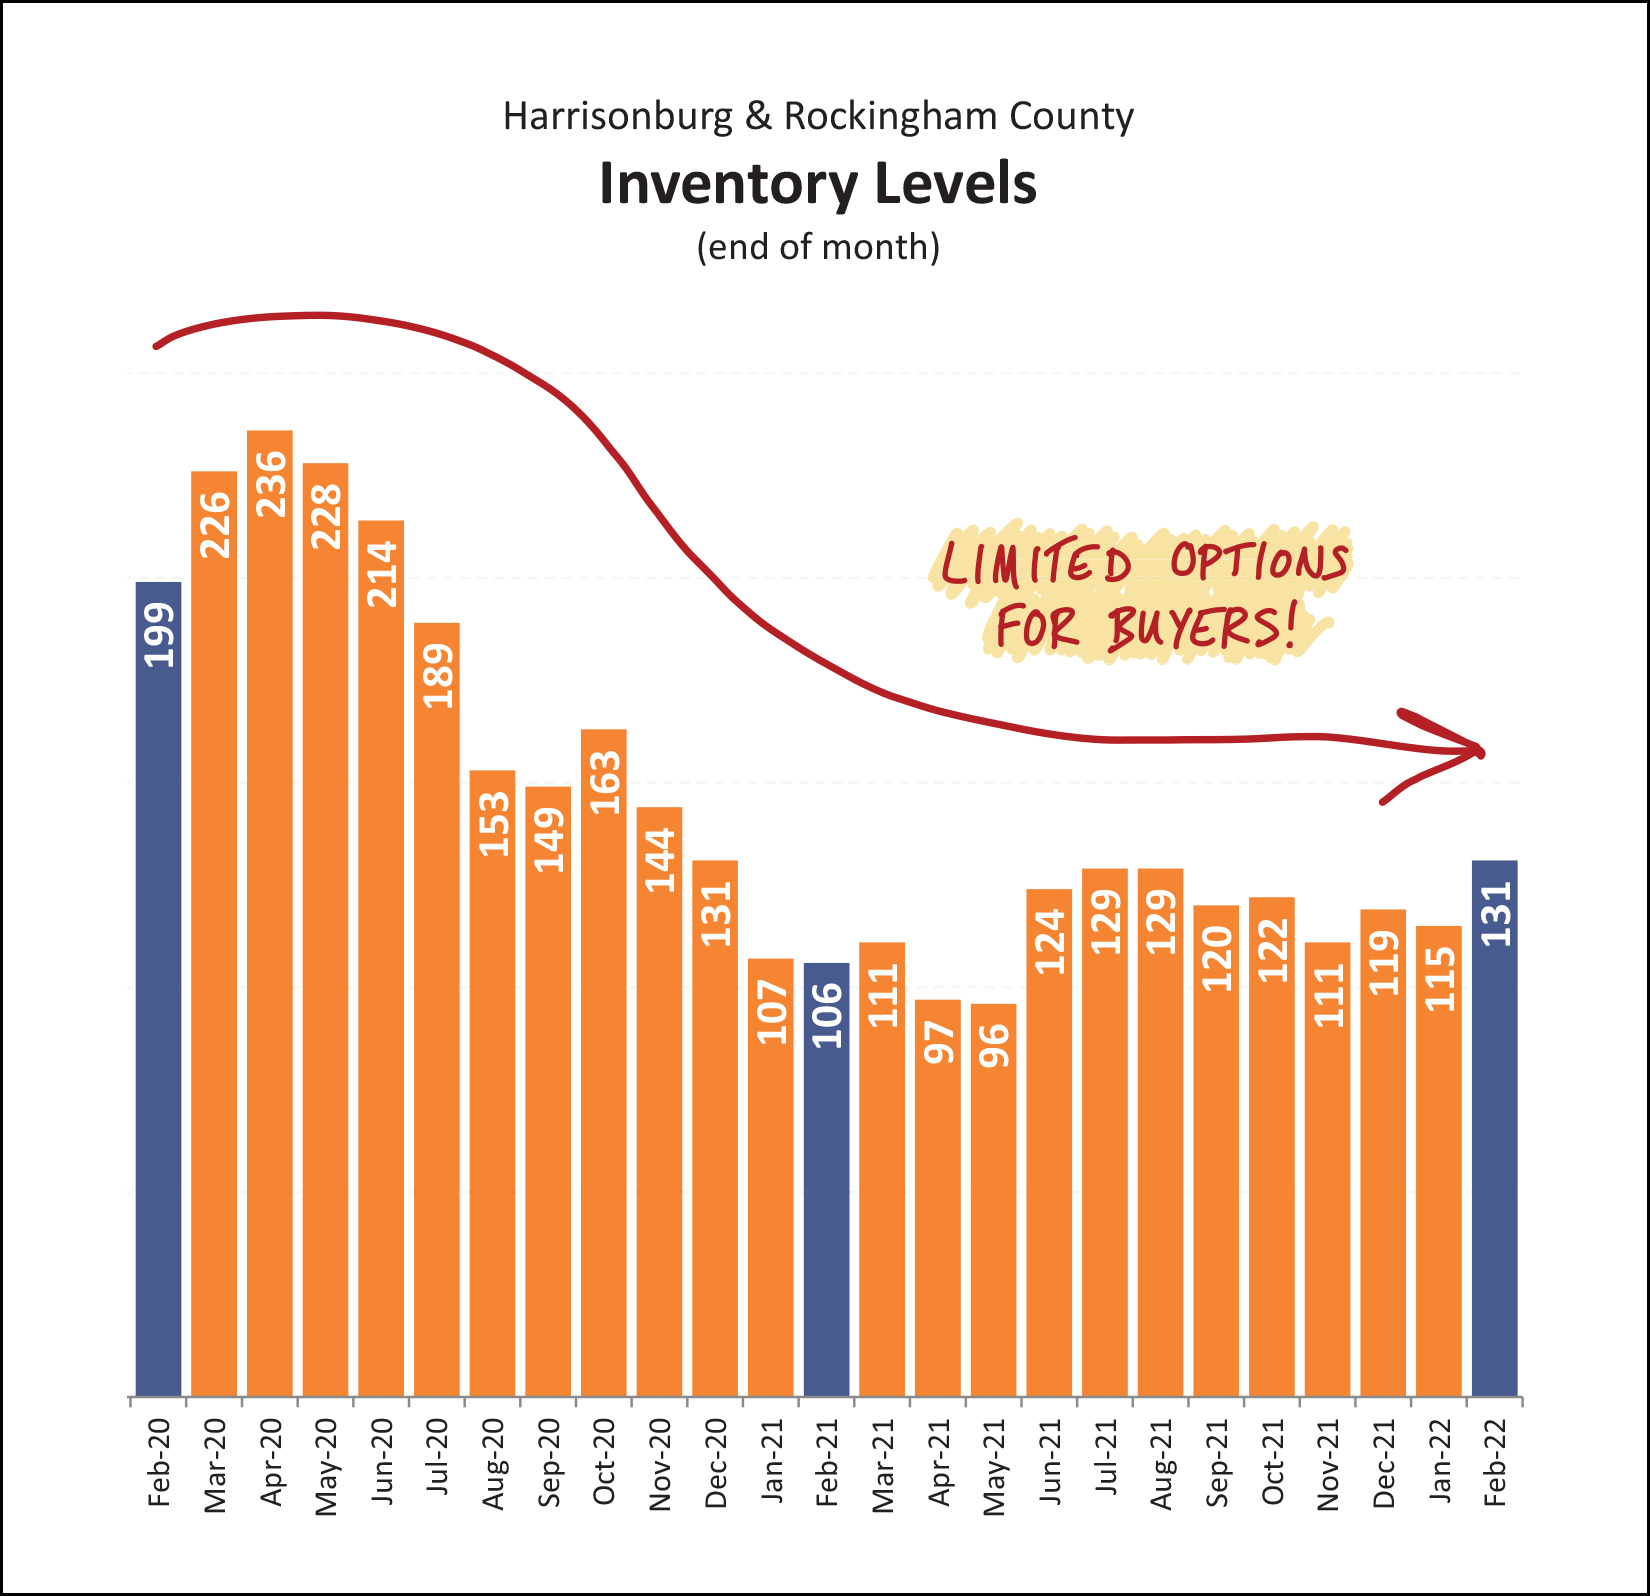 If you are hoping to buy a home soon, you might look at the graph above and get depressed by the low inventory levels. But... scroll back up to the previous graph for a moment and look at all of the contracts we usually see signed between March and August. Those buyers signing contracts (one could be you!) are almost all buyers signing contracts on homes that are listed for sale between March and August. So, while inventory levels at any given moment are not likely to increase over the next six months... there are almost positively going to be lots (and lots) of options of houses for you to buy over the next six months... or at least options of houses for which you can compete against lots of other eager home buyers. :-/ 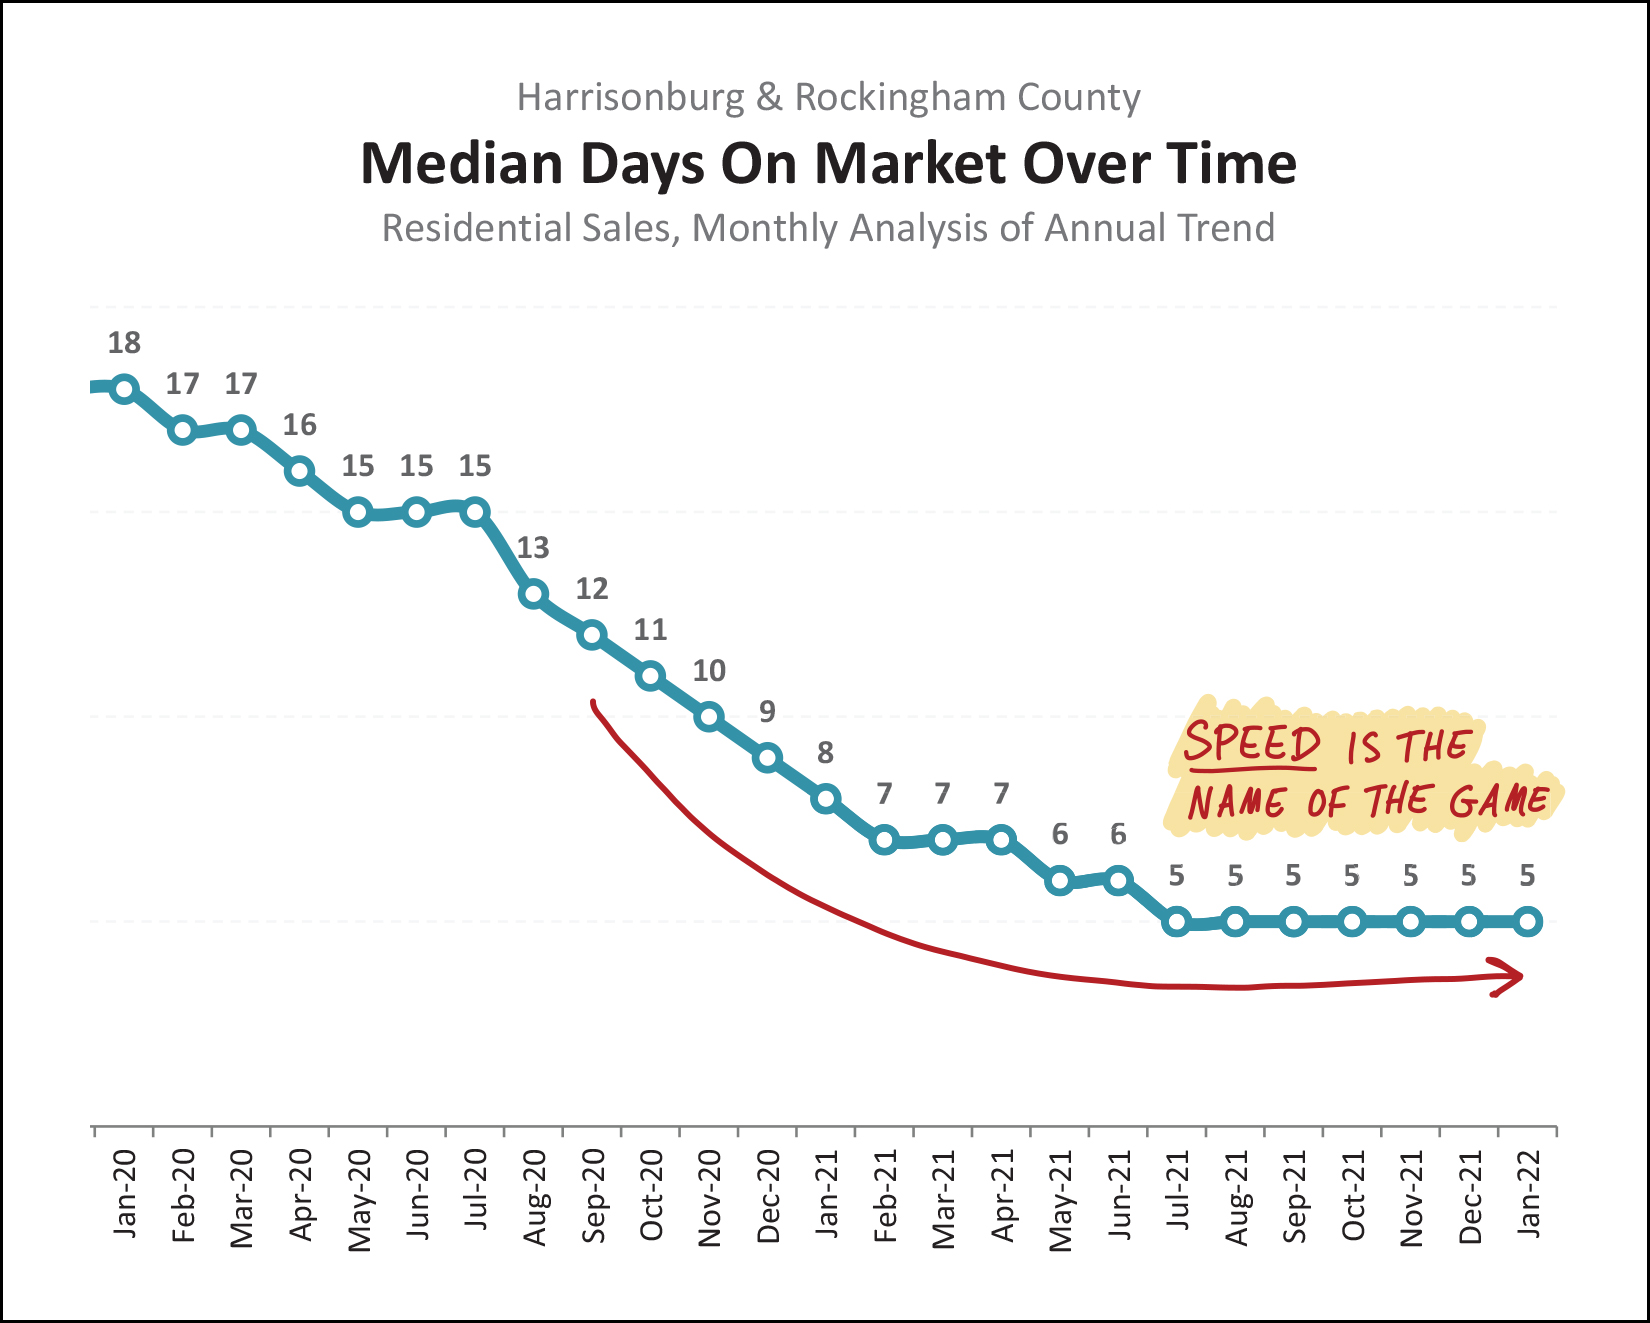 Indeed, the competition is fierce... and the market is moving quickly! The median "days on market" is five days right now... which means you need to go try to see any new listing of interest within the first day or two of when it hits the market for sale -- and you need to be ready to make an offer shortly thereafter if you are interested in buying that exciting new listing. Eventually we might (should?) see this metric start to increase a bit as the market slows... but we are definitely and assuredly not there yet. 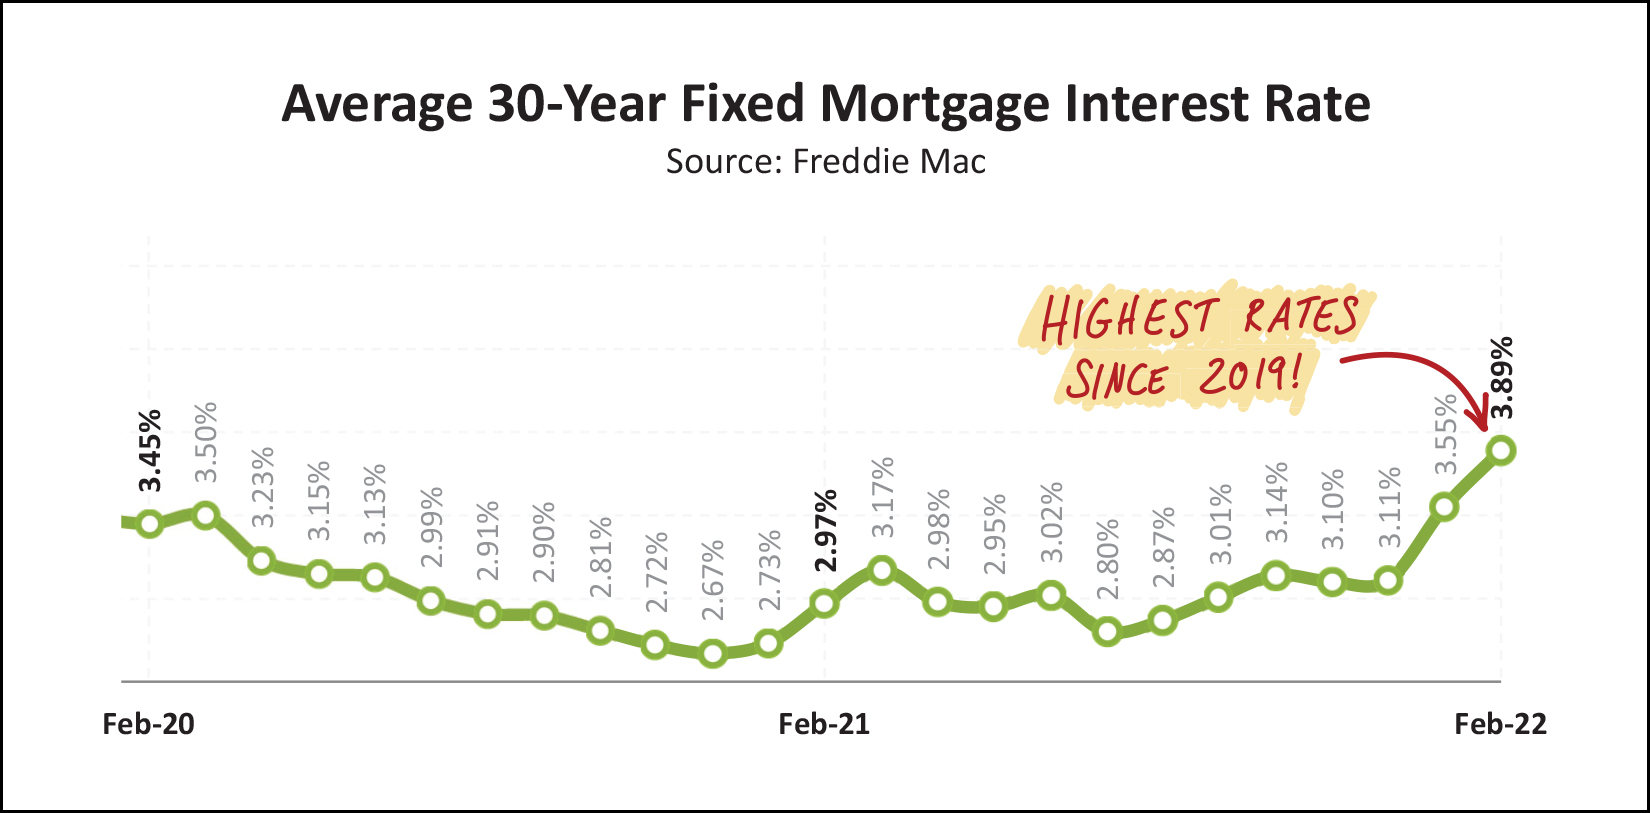 Lastly, how about those interest rates? If there is one external factor that has the highest likelihood of affecting home buying activity in 2022... it is rising mortgage interest rates. Just six months ago, the average mortgage interest rate on a 30 year mortgage was 2.87%... and it has risen more than a full percentage point in the past six months to 3.89% at the end of March. As such, not only are today's home buyers paying a higher purchase price for nearly any home that they might purchase -- but their monthly mortgage payment will also be higher now (than it has been in recent months and years) because of rising interest rates. It seems likely that these rates will either level out near 4% or continue to rise even a bit above 4% as we continue through 2022. OK! That makes it to the end of this month's recap of our local housing market. A few reminders for you... [1] Go eat at Magpie Diner. You're certain to love it! :-) [2] Looking to buy soon? Email me so we can chat about what you'd like to buy, and talk to a lender ASAP. Let me know if you'd like some recommendations. [3] Planning to sell soon? Let's meet to talk about your house, any needed improvements or preparations, pricing, timing, the market and more. Email me to set up a time to meet to talk. That's all for now. Be in touch anytime (email me or call/text 540-578-0102) if I can be of help to you or your family, friends, neighbors or colleagues. Hope to talk to you soon! | |
Lots Of Home Buyers Are Still Competing For New Listings |
|
 For many new listings, the competition is still quite fierce in Harrisonburg and Rockingham County. Here are three recent examples I've been involved with or heard of in the past 10 days... [1] A townhouse in the City of Harrisonburg under $200K received 12 offers within three days. [2] A duplex in the County in the $300K's received 7 offers within three days. [3] A detached home in the City of Harrisonburg in the $300K's received 16 offers within four days. Wow! Now, this won't be the case for every new listing, in every price range, in every location... there are more buyers in some price ranges and for some locations than others. This also won't hold true independent of how a seller prices their home. A home that ends up selling for $200K will likely have a different number of offers based on whether they priced the property at $195K, $199K, $205K or $225K. But... yes... the market is still quite active, with plenty of buyers ready to buy, and many (to most) new listings being scooped up quite quickly. If you're getting ready to sell this spring, we should talk sooner rather than later about timing, preparations, pricing and more. | |
Home Buyers Just Entering The Market Should Despair, Then Rejoice |
|
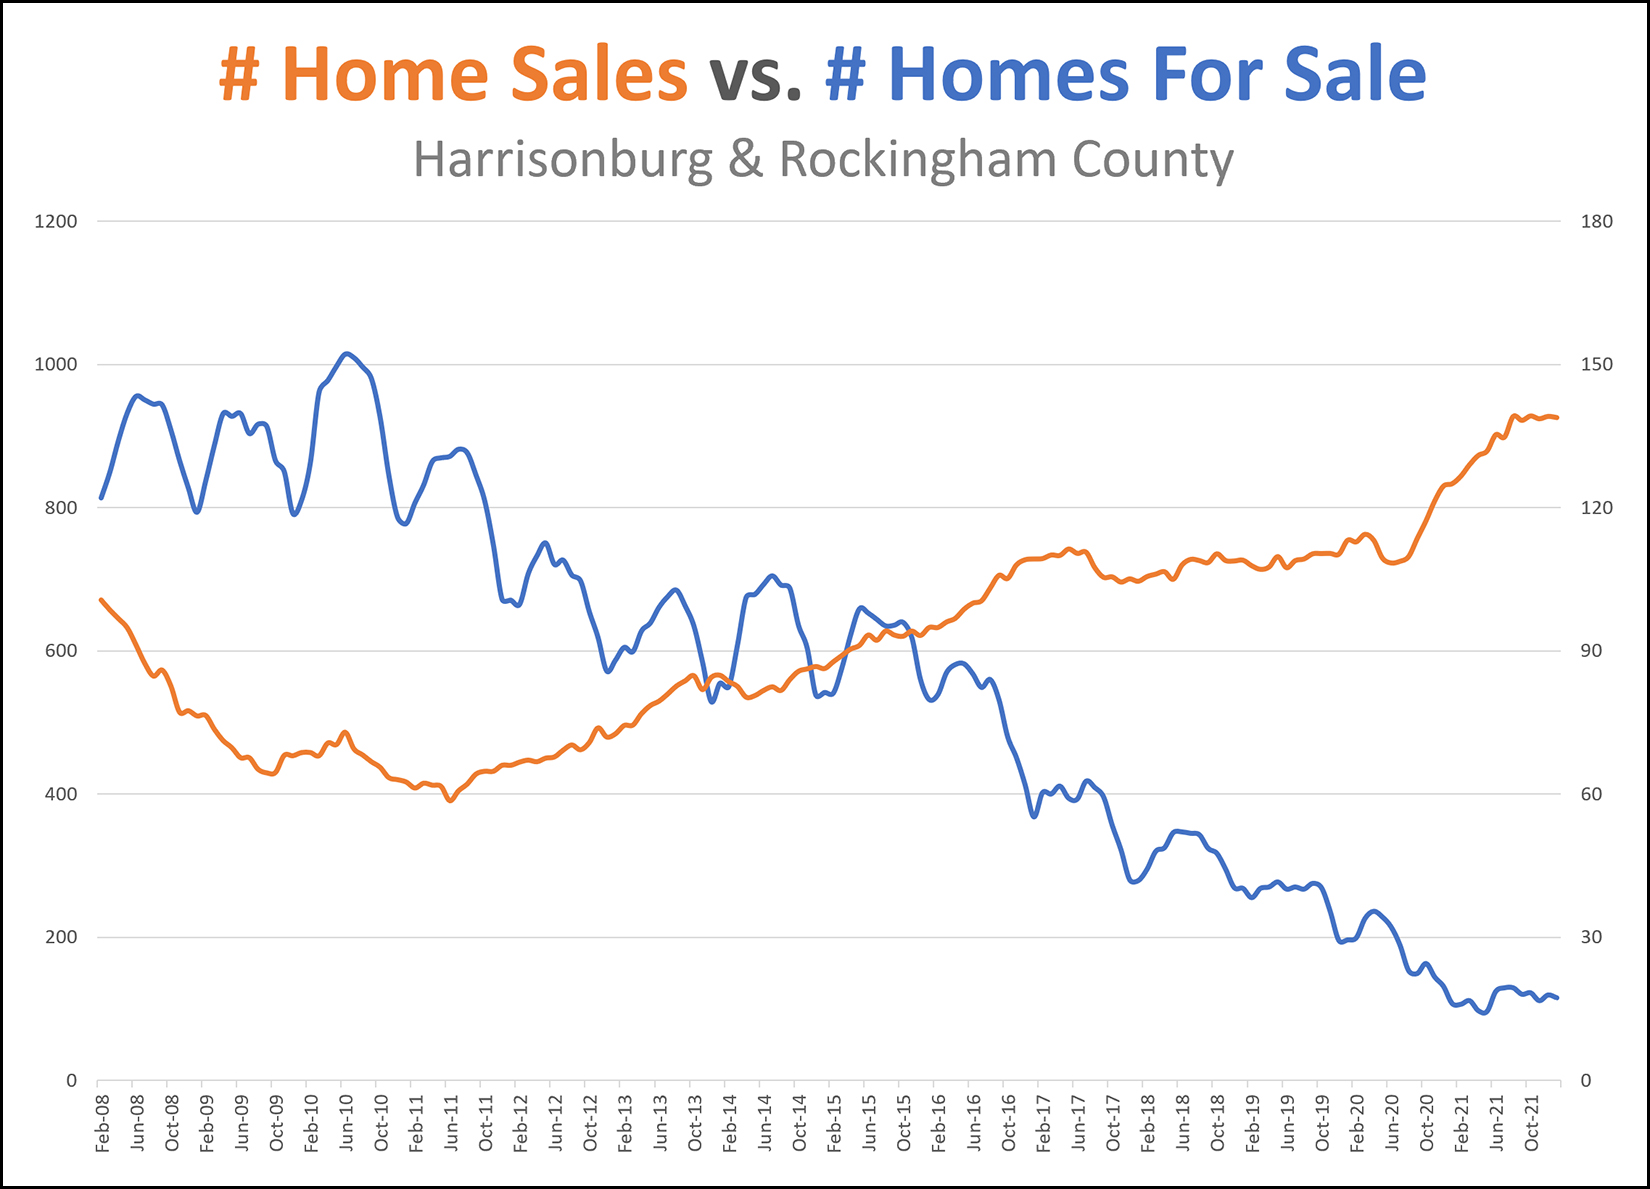 Blue Line = Despair Orange Line = Rejoice As any buyer in today's market will tell you... there is very little on the market to buy right now. That's the blue line. Over the past 13 years there have been fewer, and fewer, and fewer homes for sale at any given time. But... more homes than ever before (in the past 13 years) sold in the past year, so there are very likely to be plenty of options of houses to buy coming on the market in future weeks and months. That said, they will likely go under contract - quickly - leaving us with low inventory levels all over again. So... would be home buyers... despair only for a moment about the lack of current inventory, and then rejoice that spring is coming and there will likely be plenty of homes to consider purchasing! | |
Each Year, 10% - 15% Of Home Buyers Pay Cash In Harrisonburg, Rockingham County |
|
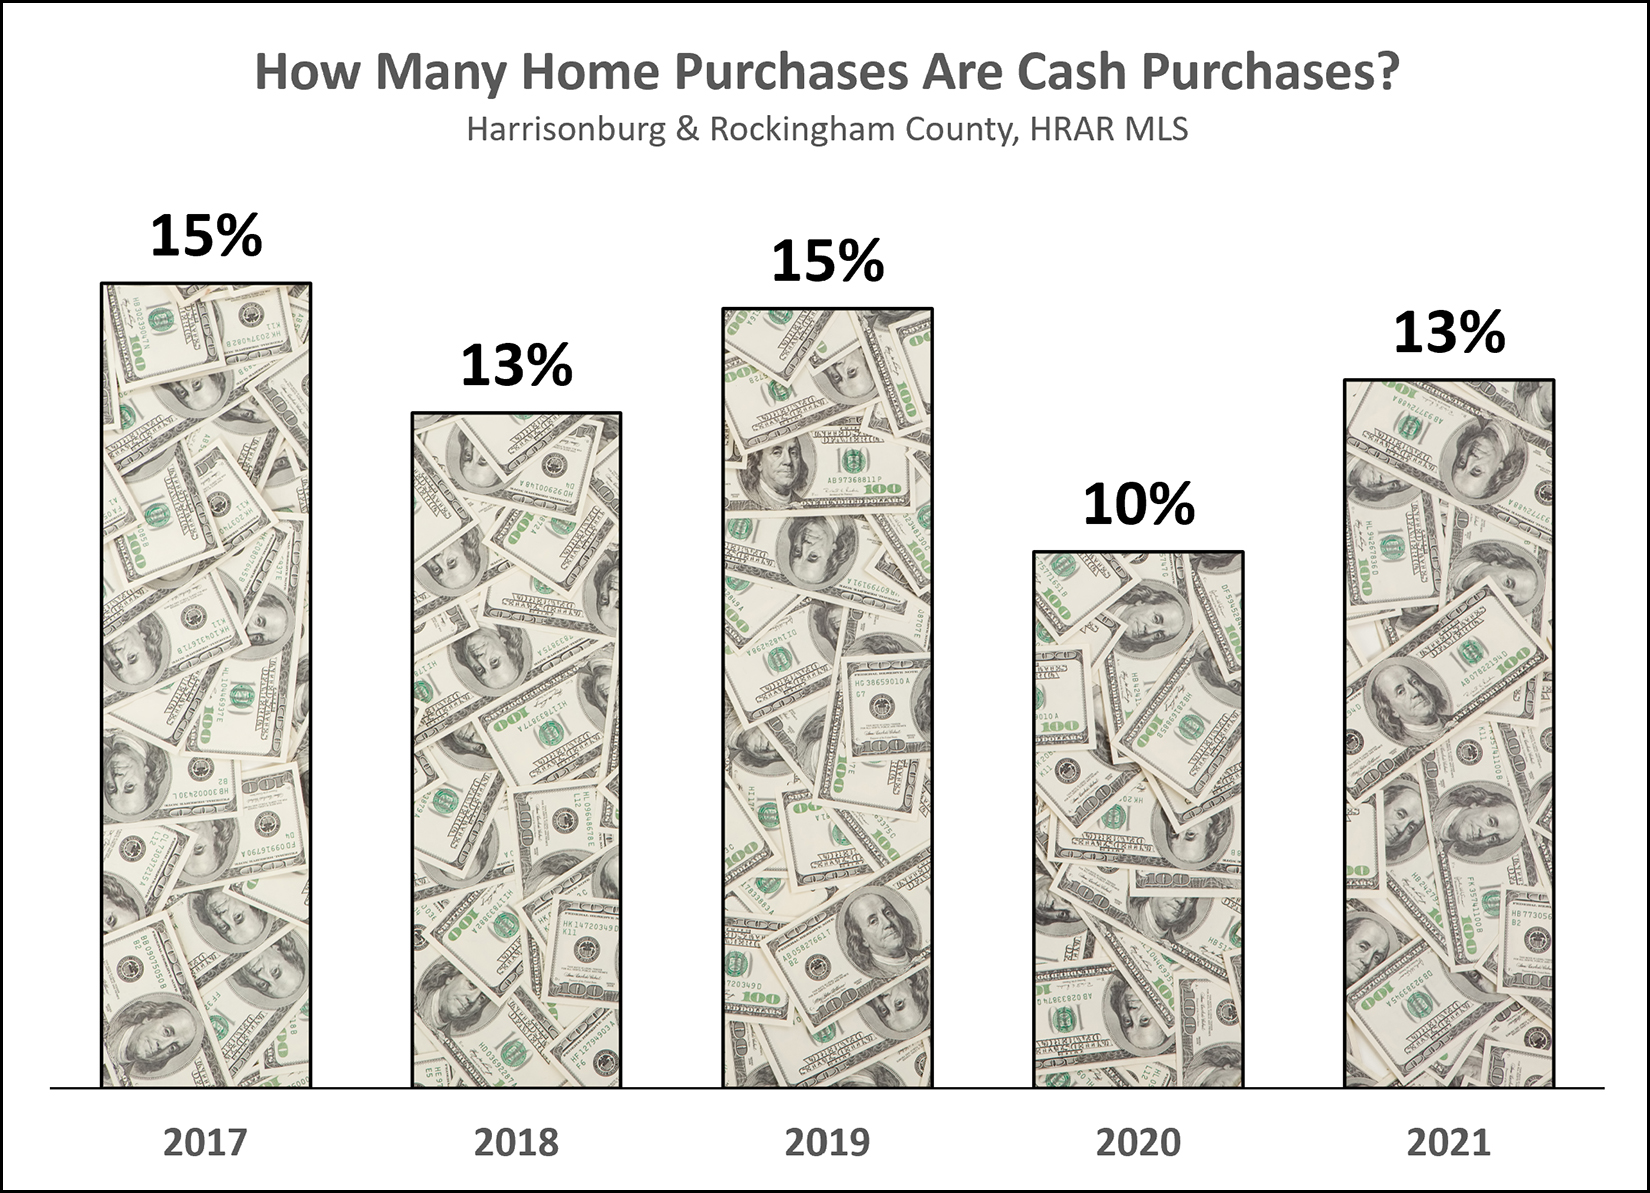 How often are home buyers paying cash for their homes in this area? It seems between 10% and 15% of home buyers are doing so each year according to data from the HRAR MLS. When a home sale is reported to the MLS, one of the required details is whether the purchase was made with cash or with financing. As shown above, 2021 feel right in the middle of the pack as far as the portion of home buyers who paid cash for their homes. So, what do you say, will you pay cash for your next home purchase? ð | |
New Homes are an Increasing Share of Total Home Sales in the Harrisonburg Area |
|
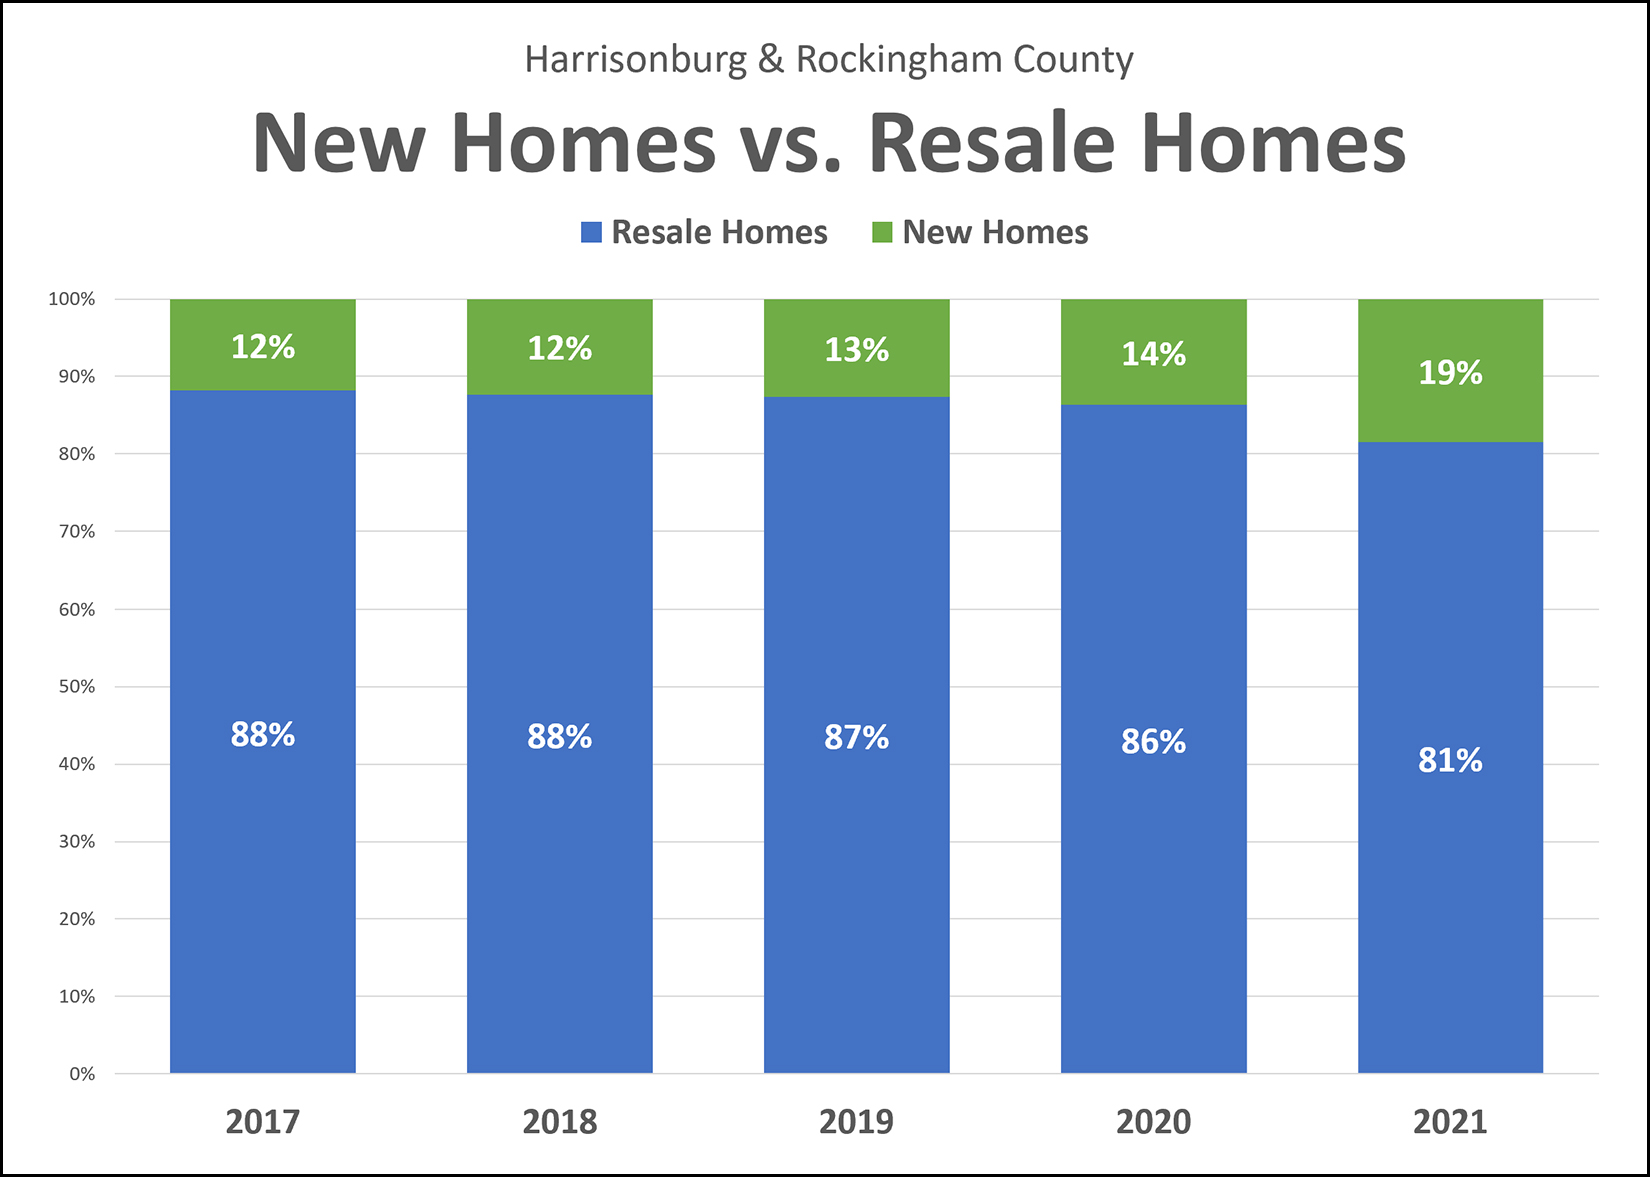 First, some raw data... Resale Home Sales:
So, there have been more and more resale homes selling over the past five years. New Home Sales:
There have also been more and more new homes selling over the past five years. The graph at the top, though, tells a third story -- an increasing portion of home sales are new home sales. Between 2017 and 2020 new home sales comprised 12% - 14% of all home sales. Then, in 2021, that jumped up to 19% new home sales. Thus, last year, approximately one in every five homes sold was a new home. This would seem to be good news, generally, as there is an ever increasing number of people who want to buy homes and make Harrisonburg their home -- so we'll need to see more new homes to help provide that housing. | |
| Newer Posts | Older Posts |
Scott Rogers
Funkhouser Real
Estate Group
540-578-0102
scott@funkhousergroup.com
Licensed in the
Commonwealth of Virginia
Home Search
Housing Market Report
Harrisonburg Townhouses
Walk Through This Home
Investment Properties
Harrisonburg Foreclosures
Property Transfers
New Listings

