Analysis
| Newer Posts | Older Posts |
November 19 Meeting To Discuss Harrisonburg Comprehensive Housing Assessment and Market Study |
|
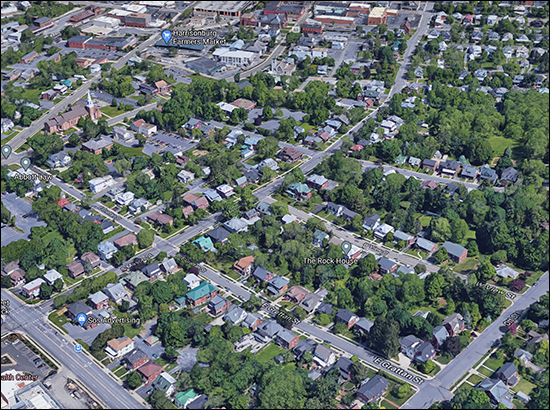 Mark your calendars for Thursday, November 19th at 6:00 PM to tune in to hear a presentation of the findings of the initial draft of the City's Comprehensive Housing Assessment and Market Study! From the press release from the City...
Here's how to tune in to this meeting... Watching on a computer or mobile device via GoToWebinar. Register in advance here - Webinar ID: 281-556-371. Calling in to listen by phone at +1 (951) 384-3421, Access Code 484-931-436. Watching the meeting live on Public Education Government Channel 3 | |
Buyers Kept Showing Up In October 2020 |
|
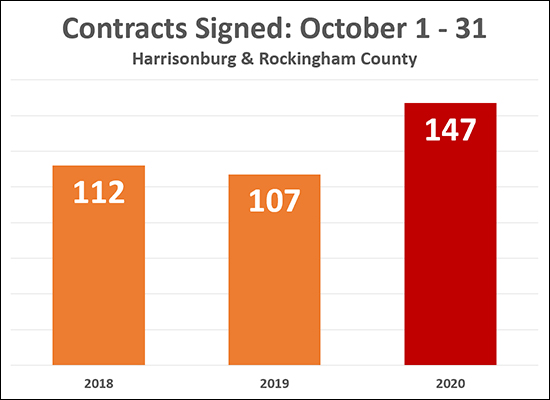 Who cares about normative seasonal changes in home buying activity... ...this is 2020! :-) Usually, buyer activity (contracts being signed) starts to slow down in October. We usually see around 110 contracts signed during the month of October. But not in October 2020. This year, there were 147 contracts signed! I'll take a full look at market activity in October in the next week or so, but until then, rest assured that buyers keep on buying, even as the weather gets colder and the leaves fall off the trees! | |
Harrisonburg Area Home Sales Over $500K Continue To Soar In 2020 |
|
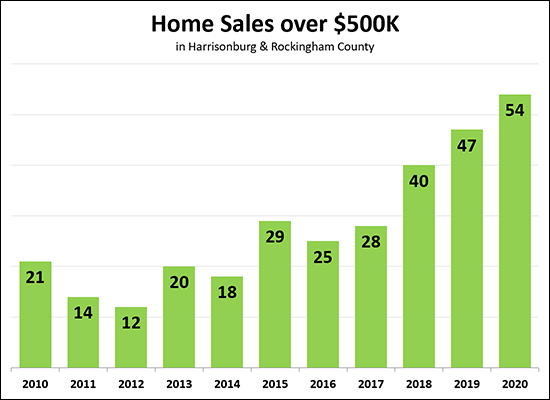 Only 5% of local home buyers spend $500K or more on their home purchase (per sales data over the past year) but this segment of the local housing market has been strong over the past few years. As shown above, there were 47 home sales over $500K last year - which was more than any time in the past decade. This year we have already exceeded that pace of $500K+ home sales even with just the first 9.5 months of the year. There have been 54 home sales over $500K up through October 19, 2020 and there is still time for a few more before the end of the year. Reigning in our enthusiasm a bit, though, this is a relatively small number of buyers. If you are selling a home over $500K, you need to keep in mind that only about 50 buyers per year (just over 4 per month) spend that much money on a home in ALL of Harrisonburg and Rockingham County! 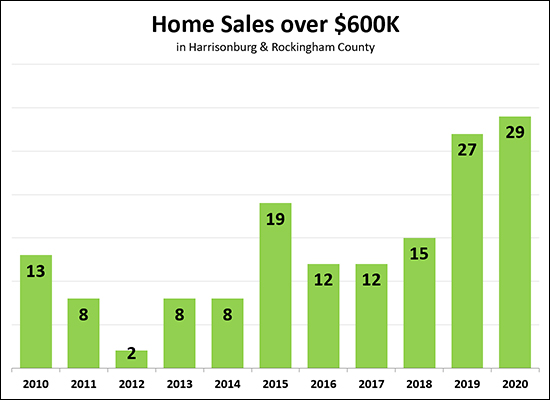 Last year was an extraordinarily strong year for home sales over $600K - with 27 such sales - well more than in any other year in the past decade. This year -- we're seeing even more $600K+ home sales, with 29 thus far and still two and a half months to go! And one more look at an even higher price point... 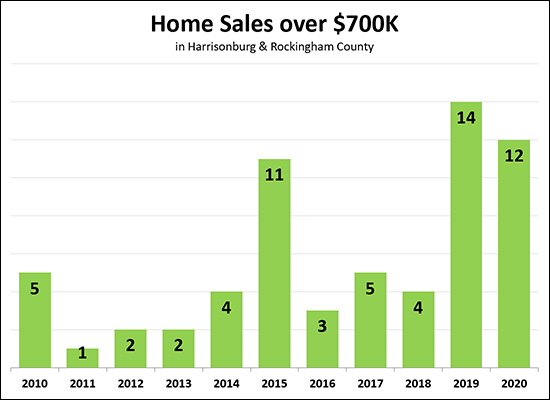 Above, you'll see that most years there are only 5 or fewer home sales over $700K. But back in 2015 there were 11 (which was more than double the norm) and last year there were 14 such sales. This year seems to also be a very strong year for these $700K+ home sales, with 12 thus far. So -- overall, the high end home sales market is doing well -- comparatively, but that is not to say that selling a home over $500K is an easy task - it's not. Home sellers over $500K are aiming for a tiny pool of potential buyers -- even if that pool of buyers might be stronger this year (and last year) than in most other recent years. | |
Contract Activity Continues Full Steam Ahead In October 2020 |
|
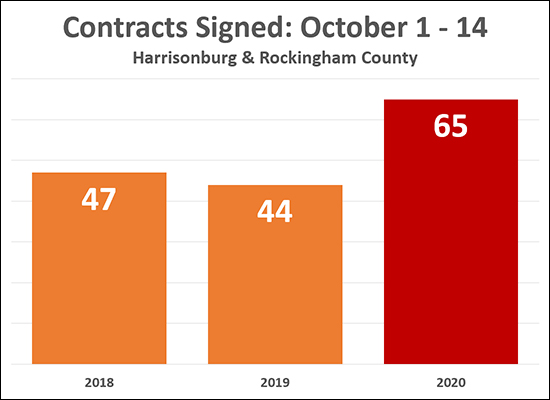 Home sales usually start slowing down in October - but not this year. In the first two weeks of October we usually see forty-something contract signed by buyers and sellers in Harrisonburg and Rockingham County. This year -- 65 contracts were signed during that timeframe! I assume at some point things will start to slow down, somewhat, but it isn't happening as quick as you might think it would given the time of the year. So, if you're thinking of selling your home but are wondering whether you should wait until the spring market - you might not need to wait after all! | |
Harrisonburg Area Home Sales and Prices Soar In September 2020! |
|
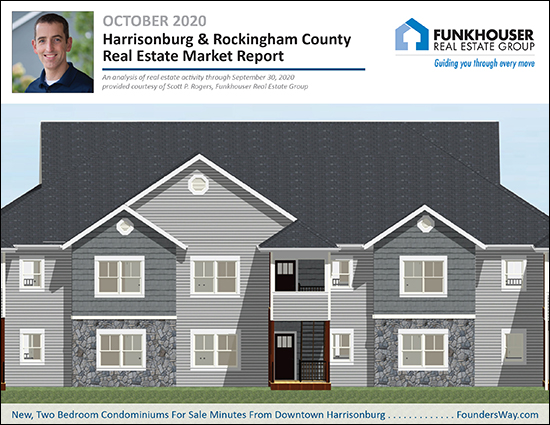 Happy Monday Morning! What a wild year this has been - and it is now, already, more than three quarters of the way to the end. Many things have been turned upside down in our daily lives, but as this year has continued to progress, one thing that has not been affected as much as you might expect has been our local real estate market. We're seeing more home sales this year than last, at higher prices, taking place at record speeds. Before we dig into the data, be sure to check out Founders Way, a condo development currently under construction just minutes from downtown Harrisonburg. Find out more about these new two bedroom condos starting in the $170K's by visiting FoundersWay.com. Now, feel free to download a PDF of my entire monthly report, or read on for some juicy tidbits to start your week off right... 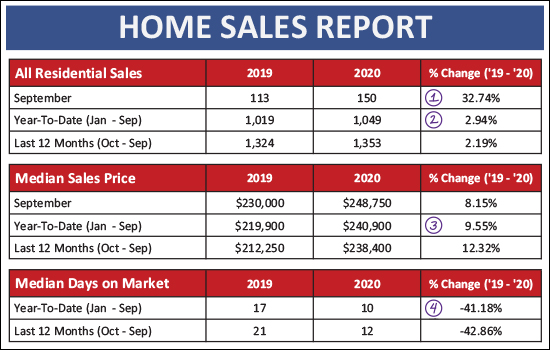 First, from a big picture perspective, referencing the chart above...
So, again, repeating the story from above - COVID has created plenty of train wrecks, but our local housing market has been able to keep on moving right along, full steam ahead. Now, looking for a moment at detached homes compared to attached homes... 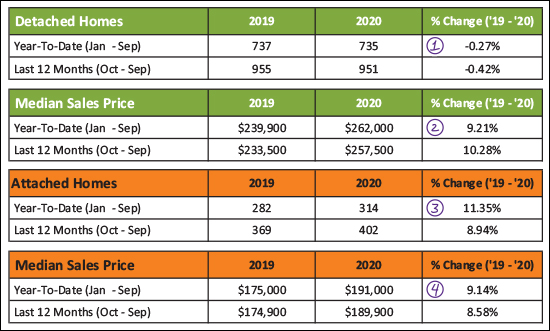 The green portions of the chart above show the trajectory of detached homes, and you might note that there have been slightly fewer (735 vs. 737) of these sales in 2020 when compared to 2019. Despite that ever-so-slight slow down, however, the median sales price of those homes has increased 9%! If detached home sales have slowed down, slightly, attached home sales have been running in the opposite direction, quickly. We have seen an 11% increase in the number of attached home sales in 2020 as compared to 2019 - and again - a 9% increase in the median sales price of these attached homes. Now, for the visual learners, let's take a look at September again... 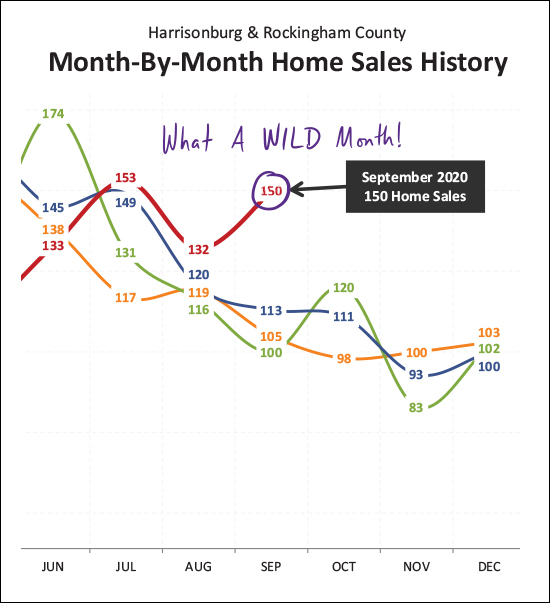 As shown above, September was a wild month for home sales. The (150) home sales seen in September 2020 make it the second highest month of home sales for the year - which is quite atypical for September! I assume that home sales will slow down quite a bit in October, and then much further in November and December -- but this year has been anything but predictable, so who knows!?! Oh, and did I mention that 2020 finally caught up with 2019? 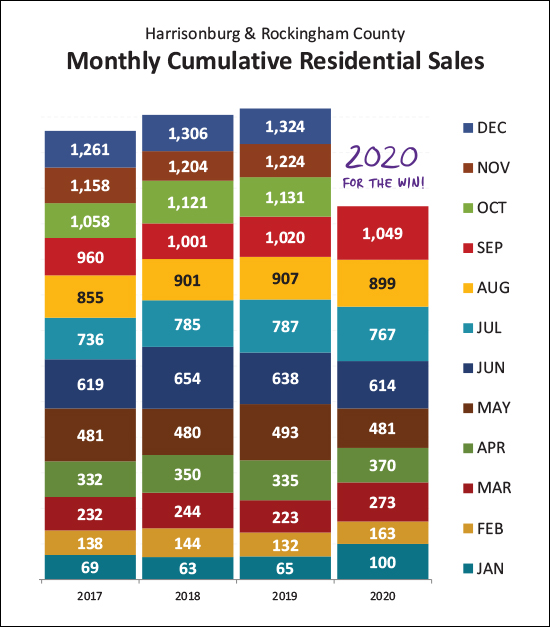 Back in March and April, I noted that 2020 was off to a STRONG start -- with more home sales in the first quarter of this year than in any recent year. But then, COVID. Many fewer sellers put their homes on the market in March, April and May, which resulted in fewer buyers being able to buy houses, which slowed down the annual pace of home sales quite a bit as we progressed through late spring and then through the summer. But then, September! The high sailing month of home sales in September caused our year to date trajectory to pop above all recent years again. So, 2020 is a great year - or at least for home sales in Harrisonburg and Rockingham County! Want another visual of the impact of COVID? 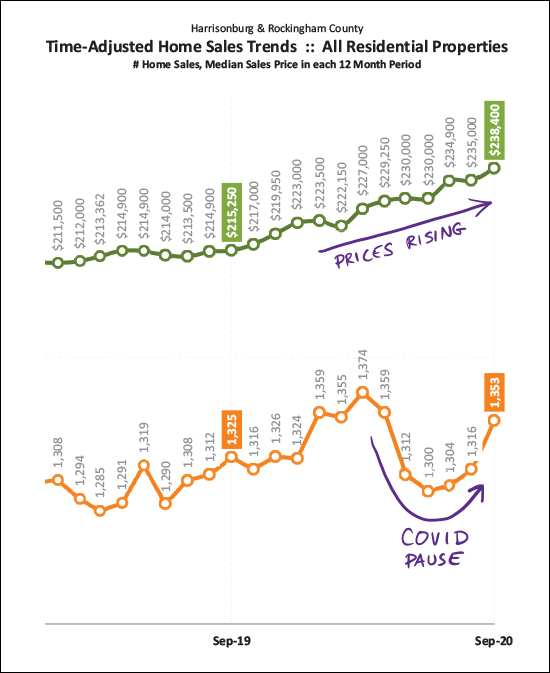 The weird dip in the orange line on the graph above is the impact of COVID. Our annual pace of home sales started dropping about five months ago, and we can only now confidently say that we're back on track to see the expected overall increase in that trajectory of home sales in this area. But that green line!?! Despite a slow down in home sales, we continued to see the median price rise, rise and rise some more. Maybe because COVID caused inventory levels to dip even lower, causing buyers to be willing to pay even more for a house? Maybe because the super low mortgage interest rates allow a buyer to be more flexible on price? Nobody knows for sure, but those prices, they keep on rising! Speaking of prices rising... 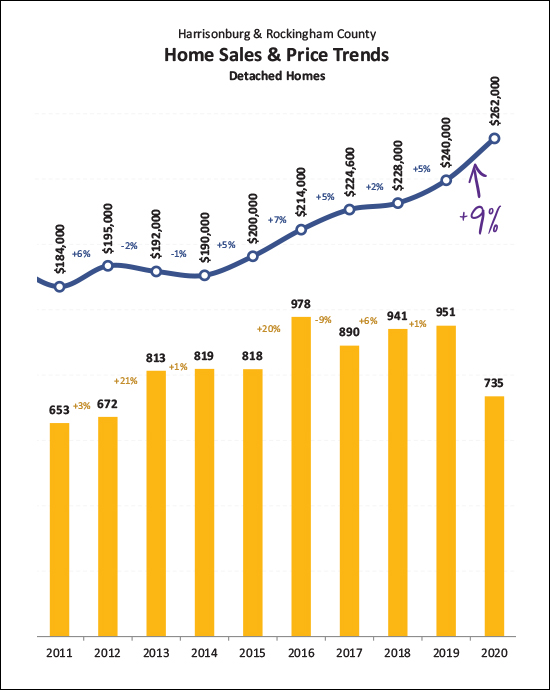 Over the past five years we have seen an average annual increase in the median sales price of 5% per year. This year, it is looking like it will be a 9% increase. This is not totally surprising -- more buyer interest, lower inventory levels, low interest rates, etc. -- but prices can't rise at 9% per year forever, so 2021 and 2022 will be interesting to watch to see how much further prices can or will increase. And now, looking back a bit to look forward... 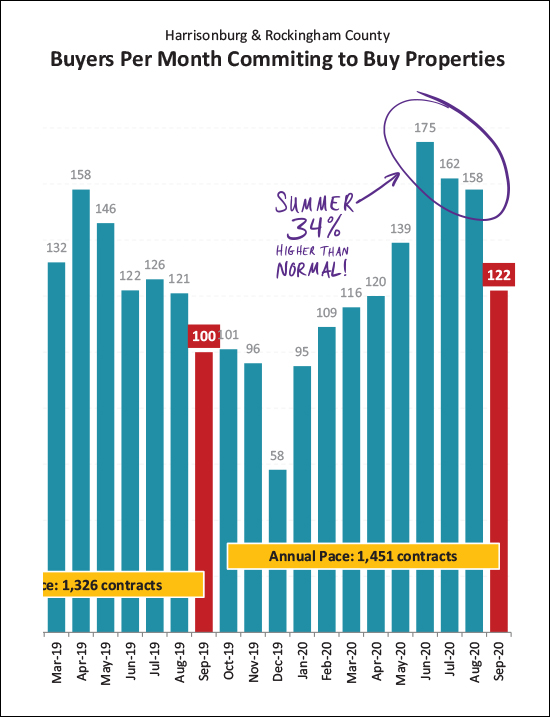 A few things to note here, on the graph above. First, it was a summer FULL of contracts. There were 34% more contracts signed this summer than last, and 32% more signed this September than last. Thus, it seems relatively likely that the strong home sales we have seen thus far in 2020 will continue on through at least October and likely into November. How many times have I said "low inventory levels now"? 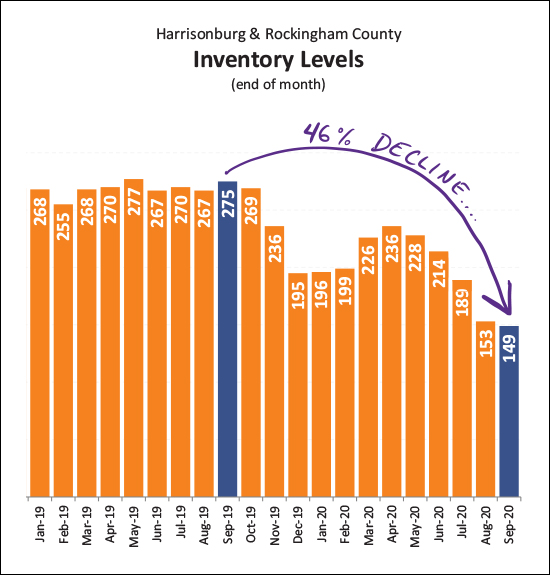 There it is, visualized, above -- the agony of buyers in our current local housing market. Inventory levels are at historic low levels. Never have there been fewer homes on the market, for sale, at a single point in time in Harrisonburg and Rockingham County. We have seen a 46% decline in active inventory over the past year. Now - keep in mind, we have seen a 2% - 3% increase in home sales, so these low inventory levels just mean that as quickly as new listings come on the market they are being scooped up by a buyer, preventing them from contributing to the "number of homes for sale" metric which we call "inventory". Unfortunately, I don't anticipate that these inventory levels will shift upwards anytime soon unless it is due to new construction at a large scale. Finally, a few times above I have noted that prices are rising - and this is perhaps one of the reasons why buyers can pay higher prices without blinking... 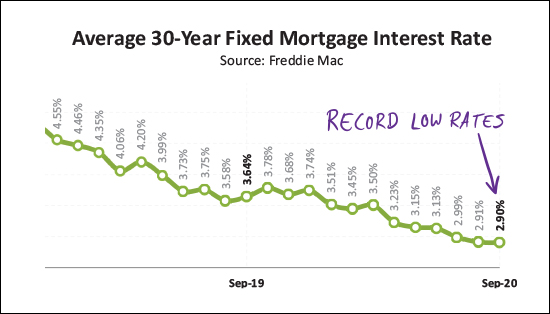 As shown above, the average mortgage interest rate keeps on falling. A year ago it was 3.64% and now it's down to 2.9%. These super low interest rates create a great opportunity for today's home buyers to lock in ridiculously low interest rates -- and they soften the impact of rising home prices. Alright, I'll pause here for now. If you've made it this far, thanks for taking the time to seek to better understand our local housing market. For more such joy, feel free to check out my blog or shoot me an email (scott@hhtdy.com) with any questions you have about our local housing market or about your house. Some key take aways... BUYERS
SELLERS
| |
Is October (Right Now) Too Late In The Year To List Your Home For Sale? |
|
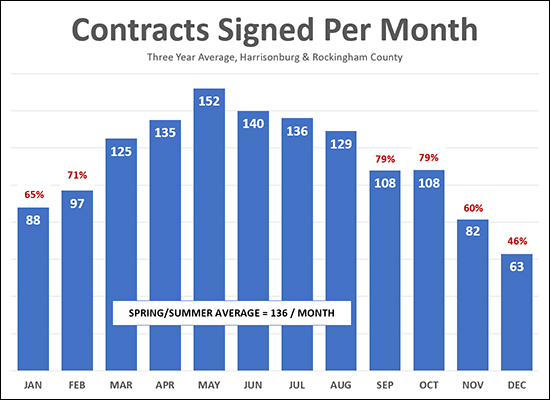 I believe this question is best answered by evaluating when buyers make an actual buying decision -- which is when they sign a contract. The data above shows when buyers sign contracts -- calculated by averaging data from the three most recent years. As can be seen, the busiest buying season is March through August when an average of 136 buyers per month make a buying decision. The remaining six months of the year (September through February) show anywhere between 46% and 79% as many buyers as the average of 136 per month seen in the busiest six months of the year. So -- listing your home in October is not at all a bad idea based on this data! As shown above, it's likely the highest month of buyer activity that we'll see between now and next March. Even late October can work, as we're likely to see 60% as many buyers signing contracts in November as compared to the average busy month. That said, in the following month (December) we're likely to only see about half as many buyers as compared to the average month. | |
Lots of Homes Selling (Going Under Contract) in September 2020 |
|
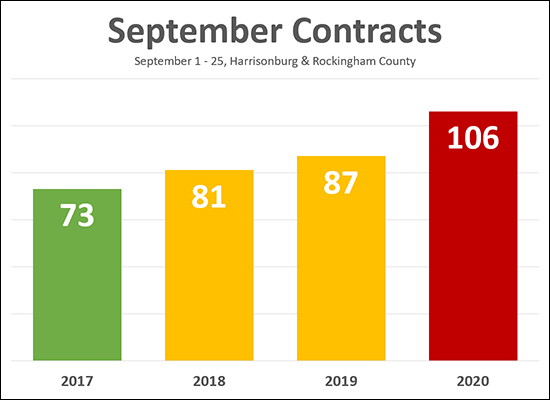 Buyer activity usually starts slowing down in September. After all -- spring is usually the busiest season for buying, followed by summer. But this September, buyer activity has been STRONG! As you can see, above, we have seen 73 to 87 contracts signed in the first 25 days of September during each of the past three Septembers. But this September -- there have been 106 contracts signed in the first 25 days of the month! Nothing has been normal this year, and September is proving to be no different. Home sales don't show any signs of slowing down yet this year! | |
Analyzing the Accuracy of Zillow Zestimates In Harrisonburg and Rockingham County |
|
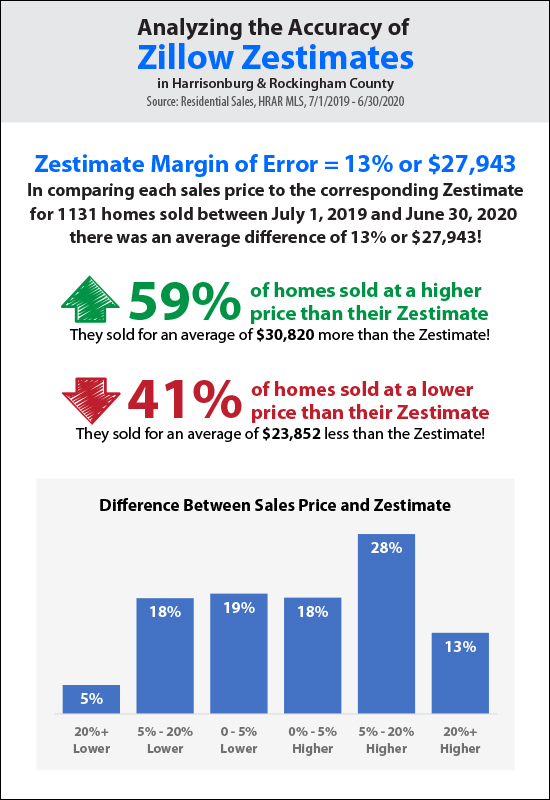 download the infographic above as a PDF Do homeowners enjoy checking out the Zillow Zestimate for their home? Yes Are Zestimates accurate indicators of market value of homes in some real estate markets? Yes, probably. Are Zillow Zestimates for properties in Harrisonburg and Rockingham County a good indicator of the price for which a home will sell? No, not at all. This used to just be a hunch, but now I can back it up with data. To answer this question...
As shown above...
So, as a homeowner thinking of selling your home... the Zestimate for your home might happen be accurate - but that would be the exception, not the rule. Only 37% of pre-listing Zestimates were within 5% of the final sales price of the houses. And as a home buyer thinking of buying a house... you shouldn't necessarily expect to only have to pay the Zestimate for a house, because those values are often too low... and yet you also shouldn't necessarily be willing to pay as much as the Zestimate for a house, because those values are often too high. In the end, just understand that the Zestimate for your home (in Harrisonburg and Rockingham County) is much more likely to be inaccurate than accurate. Presumably, you wouldn't want to make a decision about the asking price for your home with a value indicator that is on average 13% different than market value. That is an average of $27,943 -- and most sellers don't want to under-price or over-price their home by that much! | |
Which Rockingham County Zip Codes Have The Highest Home Prices? |
|
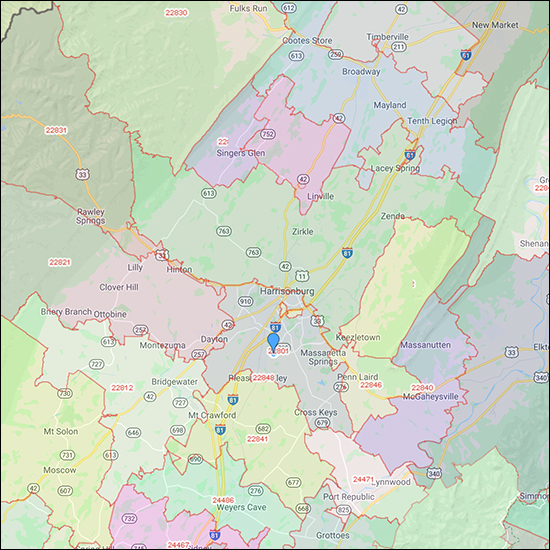 I took a look at single family home sales, on less than an acre, over the past 12 months (9/1/2019 - 8/31/2020) and looked for zip codes with 20+ home sales. Here's what I found as far as median sales prices... 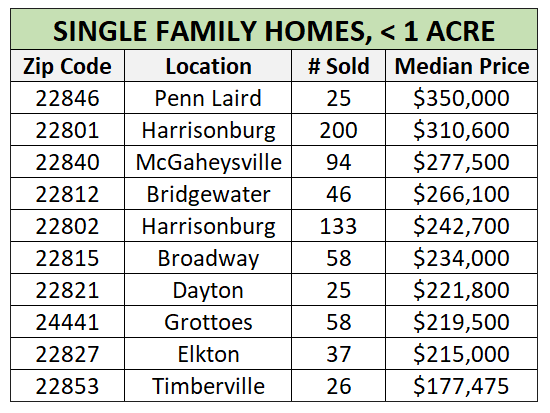 As you can see, areas east (Penn Laird, McGaheysville) and south (Bridgewater) as well as Harrisonburg itself have higher sales prices -- whereas Dayton, Grottoes, Elkton and Timberville round out the bottom of the list. Some of the differences in prices between zip codes noted above can easily be understood once realizing that different sized homes are built in different areas. I thought that evaluating price per square foot might, thus, be a good way to compare the zip codes -- but I actually came to a different conclusion after I ran the numbers... 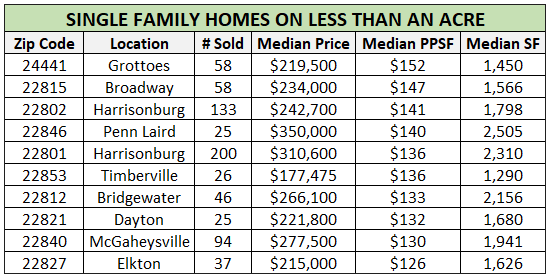 As you can see above, some of the localities with the highest median price per square foot (Grottoes = $152/SF, Broadway = $147/SF) have the lowest median sales price. How could this be!? Well, basically, smaller homes tend to have higher a higher price per square foot than larger homes. Thus, I added in one more column, above, to show the median size of the homes sold in each zip code. There, you can see that the reason why some of the lower priced zip codes are higher on the list (above) are a result of the smaller size of the homes in that zip code. Re-sorting, then, you can also get an interesting view on where larger homes and smaller homes tend to be located on a zip code level... 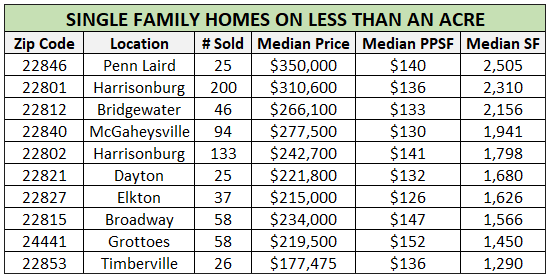 All this, by the way, is thanks to a few questions from Howie - curious blog reader. Thanks Howie! Good questions, and interesting (I think) data/results! | |
Spring and Summer Looked A Bit Different This Year In Our Local Housing Market |
|
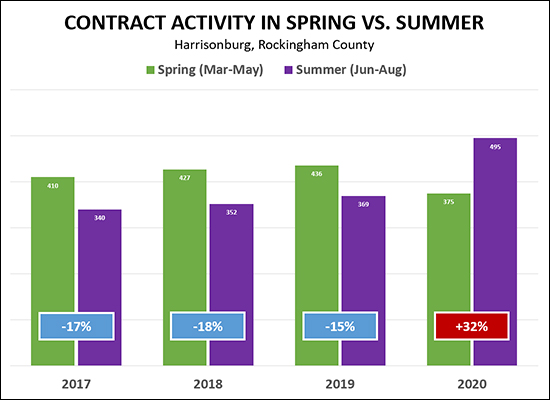 We always (I mean, always!) see more contract activity in the spring than the summer. More buyers contract to buy homes between March and May than between June and August. Always. For sure. Definitely. But not in 2020. Over the past three years we have seen a 15% - 18% decline in contract activity when comparing summer to spring - but this year contract activity INCREASED 32% when comparing summer to spring! This certainly had a lot to do with COVID-19. Plenty of buyers and sellers were feeling a bit uncertain this spring, which slowed down the pace of sales in our real estate market. But -- everything came roaring back this summer! Who knows what fall will look like this year in our local real estate market, but summer was certainly unusual! Yes, and I suppose spring was as well. :-) | |
Local Home Sales, Contracts, Prices Surge In Summer 2020 |
|
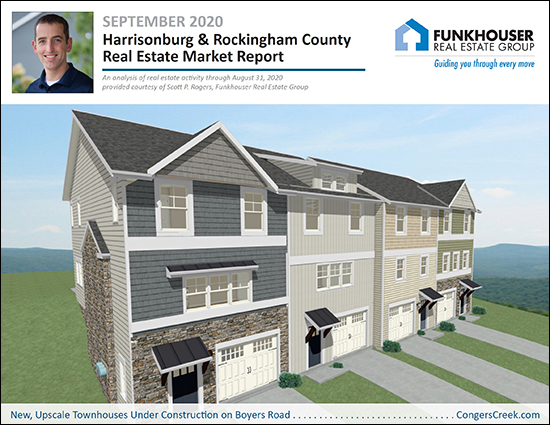 Happy Monday Morning! Temperatures are cooling, and fall will soon be upon us! It looks like the high temps will be in the 70's all week - except Friday when we're expected to have a high of only 67 degrees! I love fall and am looking forward to the slightly cooler weather. But even if the temperatures are cooling off, local home sales are not necessarily doing the same! Before we dig into the data this month, be sure to check out Congers Creek, the new townhouse neighborhood being built on Boyers Road near Sentara RMH Medical Center by visiting CongersCreek.com. Now, feel free to download a PDF of my entire report, or read on for highlights... 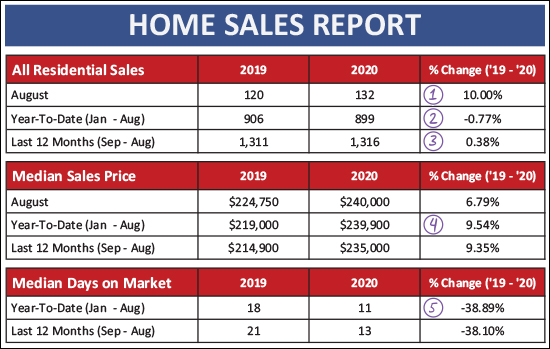 Quite a few items to note above...
Now, let's take a look at how the past few months have fallen into the context of previous years... 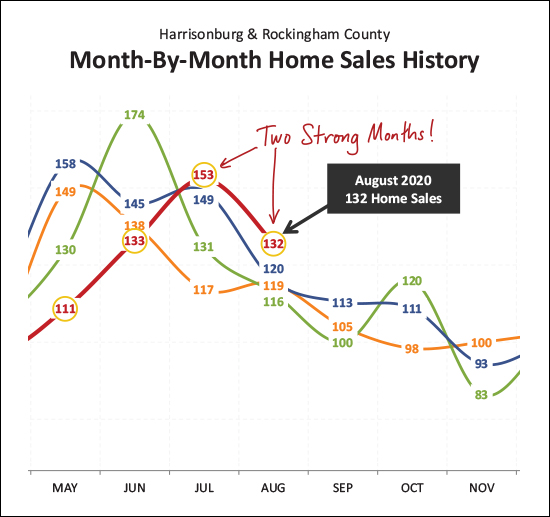 As you can see above, May and June were remarkably SLOW months for home sales - well below the normal pace for those months. But then, July and August came storming in -- with higher numbers of home sales than we would have or could have expected. So it seems that home sales may have just shifted this year to be later in the year than most years. Who could even guess what might happen in September and October at this point!?! And here is how the year is stacking up with the past two years thus far in 2020... 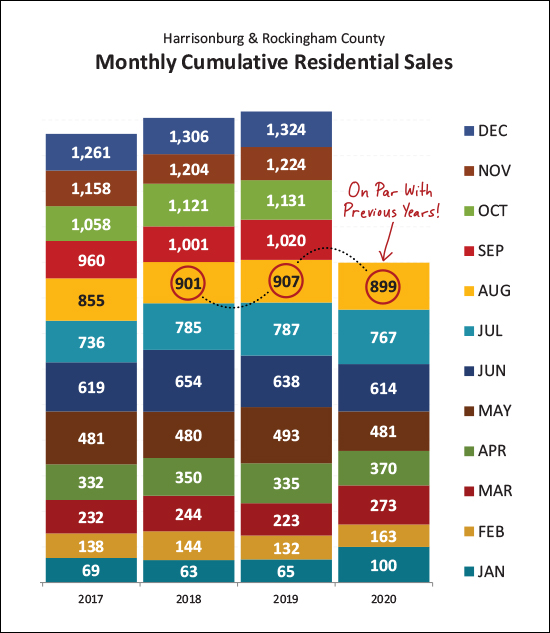 For all the things one might say about 2020, it seems we won't be able to say that home sales stunk. A busy late-summer has caused this year to catch right back up (almost) to where we have been for the past two years -- and based on contract activity (keep reading) I think we might surpass last year's sales trajectory as we close out 2020. That's not to say, of course, that home sales didn't take a temporary dip as a result of COVID... 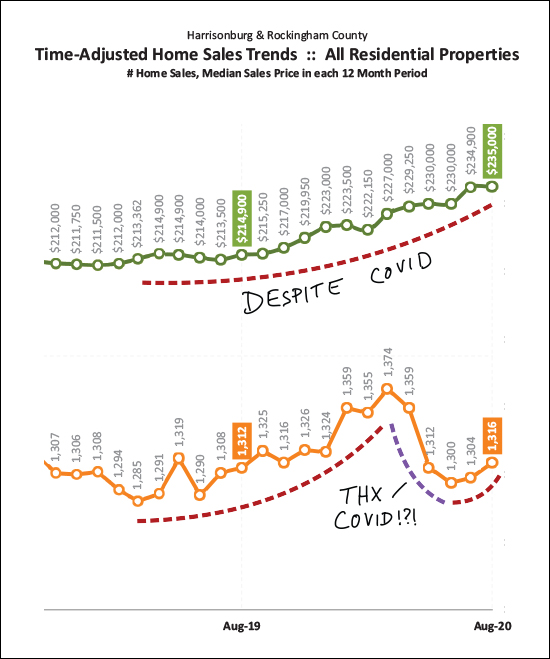 Indeed, the annual pace of home sales took a nose dive in the spring -- OK, that might be an exaggeration, but they did slow down. Despite that temporary slow down, though, home prices kept right on climbing!?! That disconnect likely means the slow down was largely a result of sellers not wanting to sell -- not a result of buyers not wanting to buy. Now about those rising prices - how fast are they actual increasing? 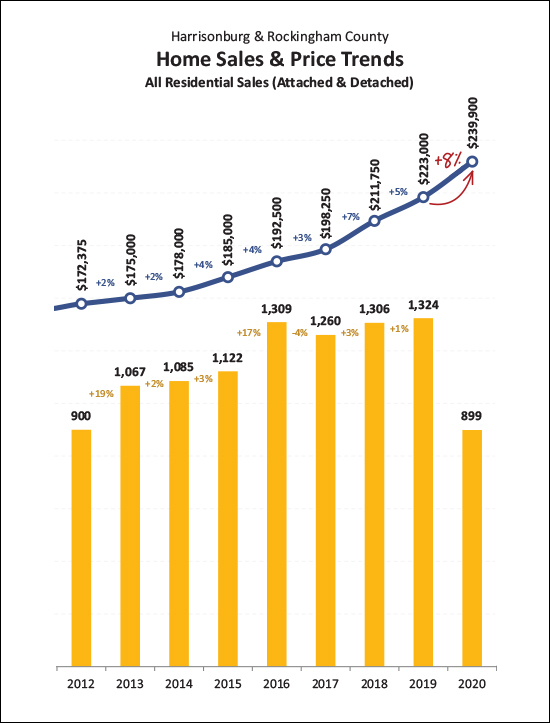 Faster than anytime recently - though barely. We've seen an 8% increase in the median sales price between 2019 and 2020. To try to put that in context...
So - I guess prices are rising somewhat faster than in recent years, but not absurdly faster. Now, let's look back in order to look forward... 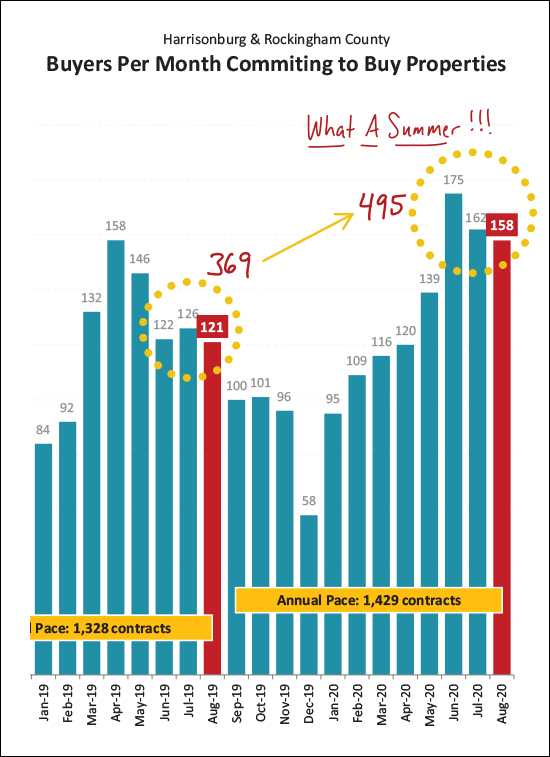 The graph above is showing us contract activity -- when buyers (and sellers) are signing contracts, not when they are closing on their purchase/sale. As you can see, this was a blockbuster of a summer for contract activity! Only 369 contracts were signed last June through August, and that increased to 495 contracts this June through August. That's a 34% increase in summer contracts! This all means we are likely to see a high number of home sales continue take place as we move into the fall. I expect that we'll see an abnormally high number of home sales in both September and October. Perhaps it is no surprise that all of these buyers signing contracts is keeping/driving inventory levels low, so very, very low... 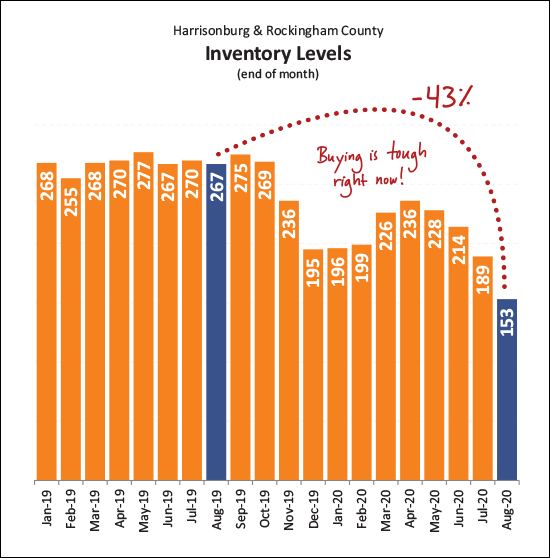 There have been fewer, and fewer, and fewer homes on the market at any given time as we have moved through this year. It is a tough time to be a buyer as there are not many choices for you at any given time, and you will likely have competition from other buyers if you are pursuing a new listing. Those buyers who are able to secure a contract on a house are financing their purchases at some rather extraordinary rates... 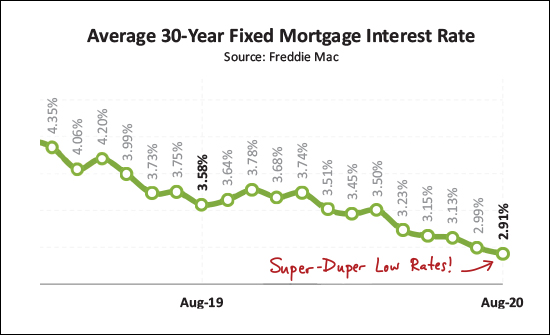 The mortgage interest rates they just keep on falling The average rate fell to 2.91% by the end of August, and I have seen my clients locking in as low as 2.85% and even 2.75% on a 30 year fixed rate mortgage! OK - that brings our monthly jaunt through the local homes sales data to a close, for now. You can read more about our local real estate market on my blog, and of course you can email me (scott@hhtdy.com) with any questions about the market or about your particular situation. Some key take aways... BUYERS
SELLERS
OK, that's all folks! I hope that you have a wonderful balance of September, and that you and your family are healthy and well and are finding ways to manage the many changing dynamics in our daily lives! Reach out anytime (540-578-0102 or scott@hhtdy.com) if I can be of any help to you! | |
Only 1 in 10 Home Buyers Spends More Than $400K |
|
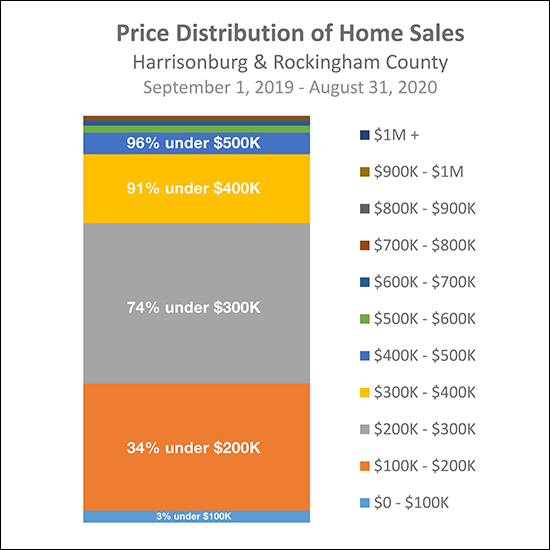 Lots to observe / conclude here...
| |
Home Buyers Went Bananas In August 2020 |
|
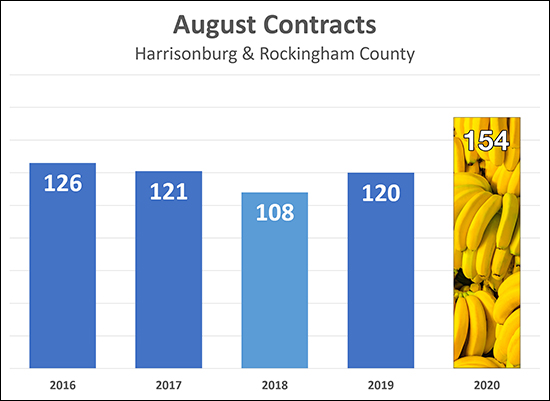 A little later this month I'll take a thorough look at all of the home buying (and selling) activity in Harrisonburg and Rockingham County. But before we get there - I thought I'd take a quick peek at how many buyers (and thus, sellers) signed contracts in August 2020. I was surprised to see a BIG increase in August contract activity as compared to the month of August in each of the past four years! Buyers still seem to be out in full force, ready to pursue houses as they hit the market for sale. It seems this fall might be busier than usual in our local housing market! | |
So You Are Saying You Are Having A Hard Time Finding A Home To Buy? |
|
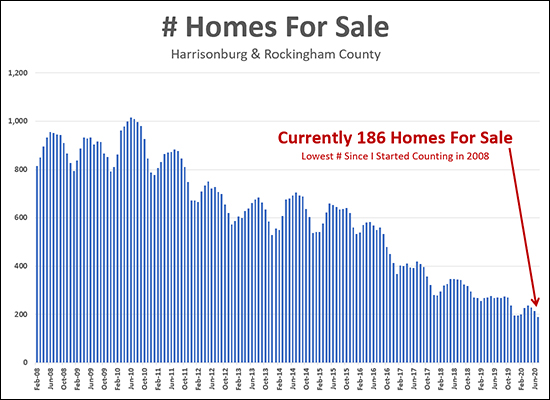 So - there are only 186 homes for sale in all of Harrisonburg and Rockingham County. Which, as you can see above, is much lower than the number of homes for sale for most of the past 12 years. Breaking it down a bit further by location...
...and by property type...
...and by price...
Regardless of how you break it down, there are fewer options for buyers today than there have ever been at any other point in the past 12 (plus) years. One important caveat is that the lack of inventory at any given point does not mean that there aren't as many houses selling. There have been 1300-ish home sales per year for the past few years, despite continually declining inventory levels. So, basically, homes are coming on the market - but they are going under contract VERY QUICKLY - so inventory levels have been staying low or getting lower! What does this mean for buyers?
It's not necessarily a totally fun time to buy a home right now because of these low (low!!!) inventory levels -- but it is possible to buy a home. Let me know if you'd like to chat about inventory levels in your particular segment of the local housing market. | |
Should You Be Surprised If Your Home Sells At Or Above List Price? |
|
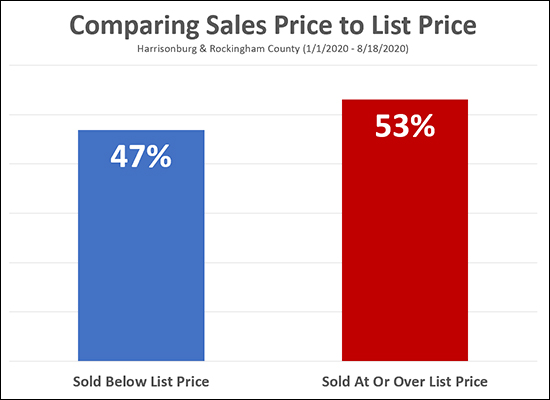 No. You should not be surprised if your home sells at or above the list price. As shown above, 53% of homes that have sold thus far in 2020 have sold at or over their list price. It's a sign of the times, I suppose. There are LOTS of buyers fighting over very few homes for sale and this often leads to...
Just to put this in context, let's see how things looked three short years ago... 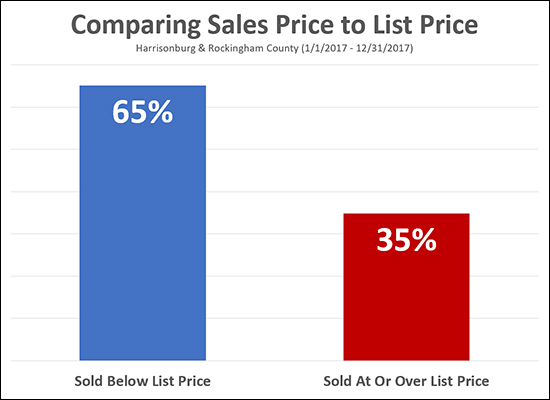 Things were quite a bit different in 2017, it seems! Way back in 2017 only about a third of homes sold at or above their list price! As with many other recent market indicators, this is great news for sellers and rather unexciting news for buyers. | |
Home Buyers And Sellers Made Up For Lost Time In June, July |
|
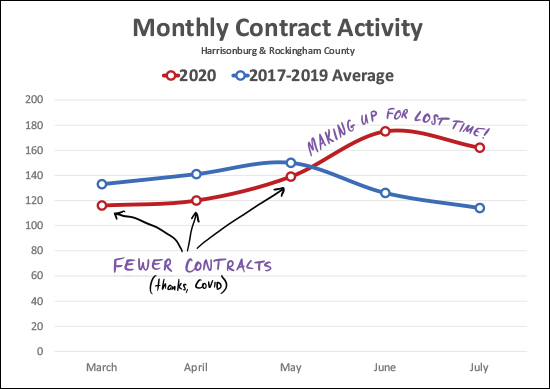 Well - hello June and July! The red line above shows the number of contracts signed for each of the past five months. The blue line shows the average number of contract signed in that same month during 2017, 2018 and 2019. Basically, comparing the monthly pace and pattern of 2020's contract activity to the three most recent years to see if this is what we should have expected. It's not what we should have expected. Typically, contract activity peaks in May and then slowly declines in June and July. But not this year. During 2020, contract activity was lower than would have been expected in March, April and May -- but then -- wow! Thinks really started to move in June and July. All in all, I think this is the impact of COVID. It slowed the local housing market down for a few months, but things are speeding right back up to likely eventually catch up to where we were last year. Stay tuned to see what happens come August... | |
Local Home Sales Slow Slightly But Prices Are Up 10% in 2020! |
|
 Happy Tuesday Morning! Summer is winding down, and it's been a bit of an unusual one...
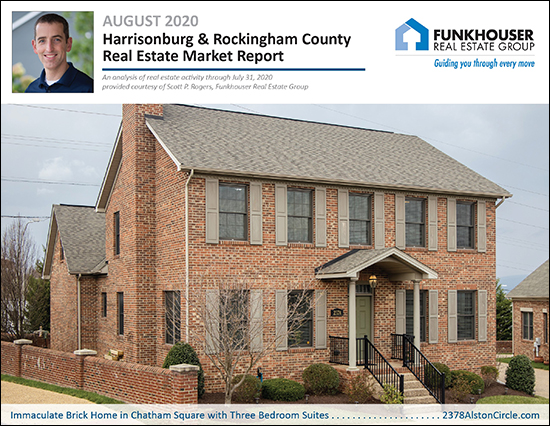
As your summer comes to a close, I hope you have found some ways to relax and take a break, despite everything going on right now. Go for a run! Head out on a bike ride! Plan a day hike! In the latest adventures of the Rogers family, I took Emily zip lining and Luke water skiing this past weekend. :-) Whatever your version of fun and relaxation, I hope you can find some of it in these last weeks of summer. And now, if you have been looking for a distraction from the craziness in your everyday life, read on for some crazy news about our local housing market. :-) But first -- check out this beautiful home (shown above) in Chatham Square by visiting 2378AlstonCircle.com. Also, feel free to download a full PDF of my market report here. OK, OK, now, on to the data... 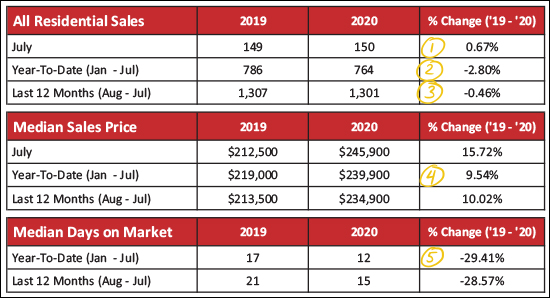 Quite a bit to note above...
To pick up on a few nuances, let's break things down by detached homes (single family homes - shown in green below) as compared to attached homes (townhomes, duplexes, condos - shown in orange below)... 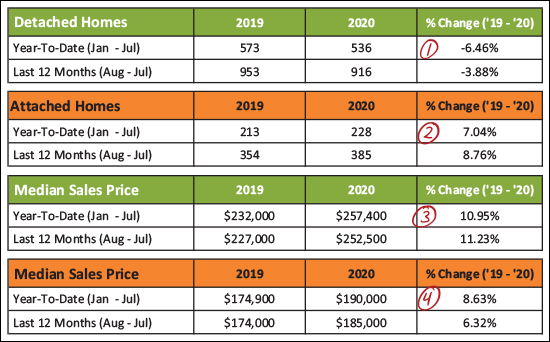 We start to see some differences when breaking things down by property type...
Now, let's contextualize those 150 home sales we saw in July... 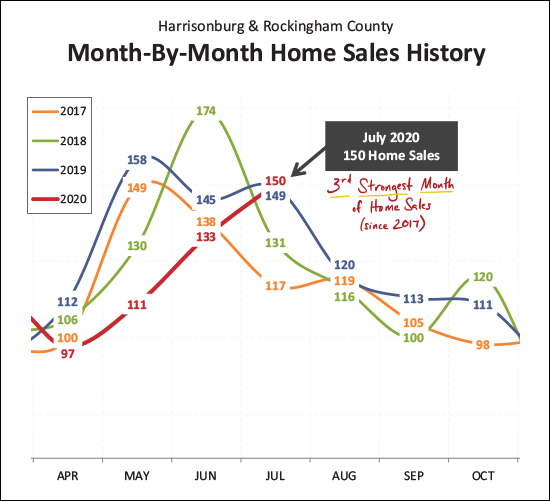 As shown above, home sales often or usually peak in May or June with sales then slowing down as we roll into July. But not this year! Home sales seem to be accelerating month by month as we have seen steady increases between April, May, June and July. In fact, the 150 home sales see in July was the third strongest month of home sales we have seen since at least 2017! This next graph might be a bit confusing, but let's see if we can make sense of it... 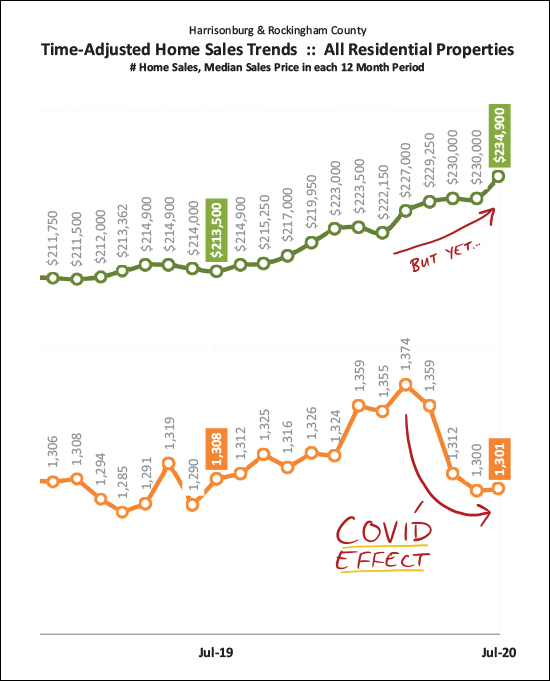 OK - starting with the orange line at the bottom of the graph... The annual pace of home sales had risen all the way up to 1,374 home sales per year by the end of March 2020. This was a slow and steady increase over several years -- but that all started to shift downward once we started incorporating April and May data into the mix. Home sales did decidedly slow down for several months, causing the annual pace of home sales to slide. It seems we may now be seeing that trend line stabilize in July as the annual pace of sales is no longer declining. But yet -- as noted next to the green line -- home prices have continued to go up, up, up. Back in March and April I wondered whether we'd see a slow down in sales and whether we would see a slight downward shift in home prices. It seems I was half right. Sales slowed, but prices have continued to rise! These two contradictory trends may best be understood by realizing that sellers drive trends during a seller's market. Fewer sellers wanted to list their homes for sale during the "time of COVID" and thus fewer sales happened in April and May (if the houses aren't listed for sale, they surely won't sell) but there were seemingly just as many (or more) buyers ready to buy. An unusual (and temporary) decline in sellers combined with just as many (or more) buyers caused home prices to continue to climb, perhaps even higher and faster than they would have otherwise! OK - thanks for sticking with me on that one. Now, let's predict the future by looking at contract activity... 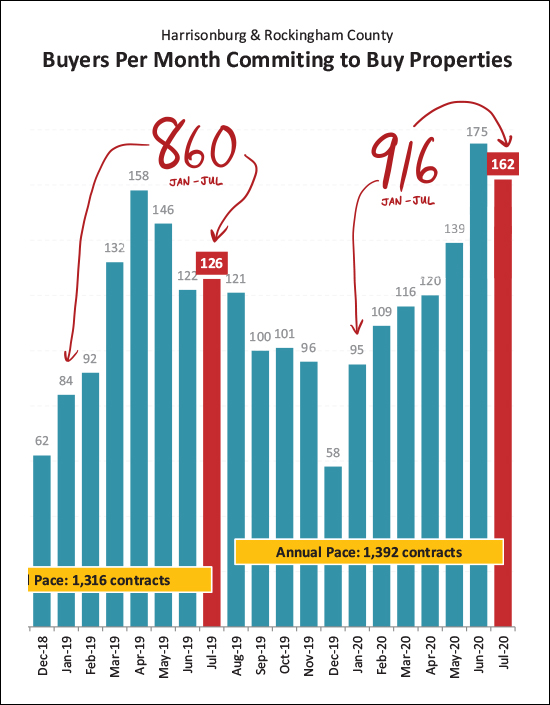 First, the big, red, handwritten numbers will quickly show you that the pace of contract signing this year (916 between Jan and Jul) is quite a bit higher than last year (860 between Jan and Jul), but there's more! Last year in June and July we saw 247 buyers (and sellers) sign contracts to buy and sell homes. This year there were 337 contracts signed during that same timeframe! It is almost as if buyers (and sellers) are trying to make up for lost time -- as contract activity has been ramping up for the past few months after a slower than expected spring market. OK, I told you I'd circle back to it... 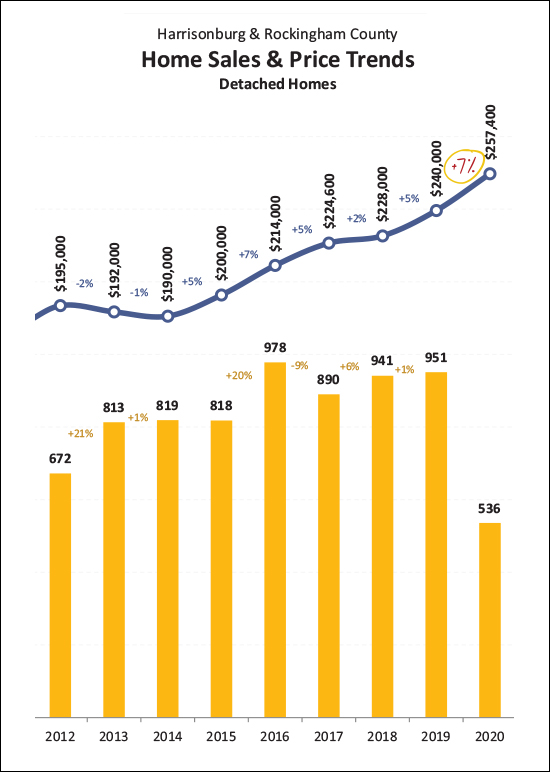 OK - so - about those home prices. As shown above, you'll note that the median sales price of detached homes (not townhouses, duplexes or condos) has increased 7% between 2019 and 2020. That's more than the 4.8% average over the past five years -- though we did also see a 7% increase between 2015 and 2016. So, should we be concerned about prices increasing this much? After all, didn't prices skyrocket back in 2004 and 2005 leading to eventual declines in housing prices? Why yes, you are correct - we did see significant increases in the median sales price in 2004 (+16%) and 2005 (+24%) and those increases were unsustainable -- prices eventually came back down, slowly, between 2006 and 2011. But this time, perhaps it's different? It's hard to say for sure whether the price increases we are seeing are "too fast" or "too much" to be sustainable. We'll only really know a year or two from now, looking backward. I suppose it is important to note that while a 7% increase is much higher than any long term average, it is also not as crazy as we were seeing back in 2004 and 2005. One of the things that is driving these prices up is the vast number of would-be buyers competing over an ever-shrinking number of homes for sale... 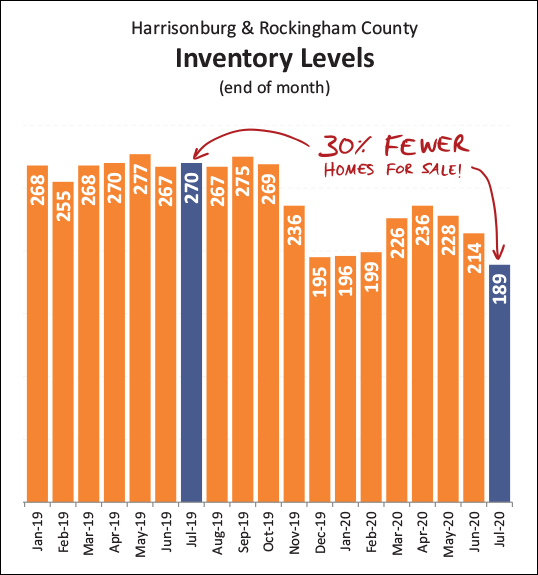 Yes -- you're reading that correctly -- there are currently 30% fewer homes for sale now as compared to a year ago. Further -- the current inventory level (189 homes for sale) is actually lower than this past winter, which is rather unusual for July/August! There are many things causing so many buyers to want to buy, and buy now, which is driving down the inventory levels, but one of those motivators for buyers is... 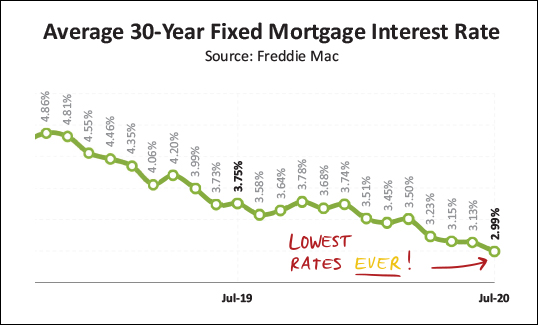 ...super low interest rates! Mortgage interest rates have been below 3% for the past few weeks -- yes, the 30 year fixed mortgage interest rate -- below 3%! I have had a few clients lock in at 2.65% and 2.75% which is rather hard to fathom. So, not to encourage you to jump on the bandwagon if you're not ready to do so, but if you're thinking about buying soon, these interest rates sure do make it compelling to try to buy sooner rather than later. OK - that wraps it up for now. A few closing notes... SELLERS - Even though it is a seller's market, it is still essential that we prepare, price and market your home well! Read more about that here and shoot me an email if you want to meet to start talking about getting your house on the market in the coming weeks or months. BUYERS - Be prepared to be patient, as you'll likely be competing with plenty of other buyers. Make sure to talk to a lender ASAP (ask me if you need a recommendation) so that we have a pre-qualification letter in hand when making an offer. HOMEOWNERS - Yes, certainly the vast majority of those who receive this market report won't be buying or selling next month. So, for the rest of you, enjoy the fact that your home's value has likely increased over the past year! If that makes you want to think about selling - let's chat. Otherwise, just enjoy knowing that your home's value has likely increased. :-) That's all for now, folks. If there is any way that I can help you or your family with real estate, or otherwise, let me know. Otherwise, enjoy the balance of August and I'll be back to crunch the numbers all over again in mid-September. | |
Price Per Acre of Land Sold in Rockingham County |
|
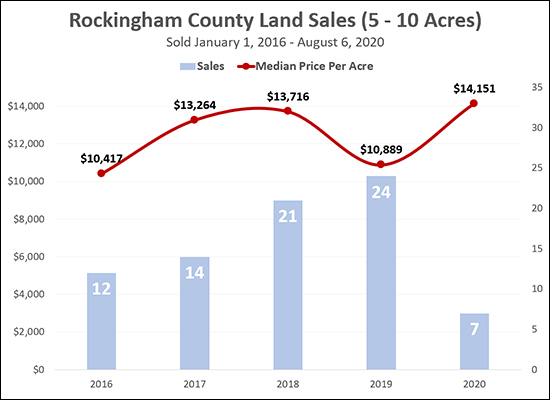 As shown above, the price per acre of 5 - 10 acre tracts has mostly stayed between $13K and $14K over the past four years, with the exception of last year (2019) when it dipped down to $11K. We have seen a steady increase in the number of 5 to 10 acre land sales over the past several years. 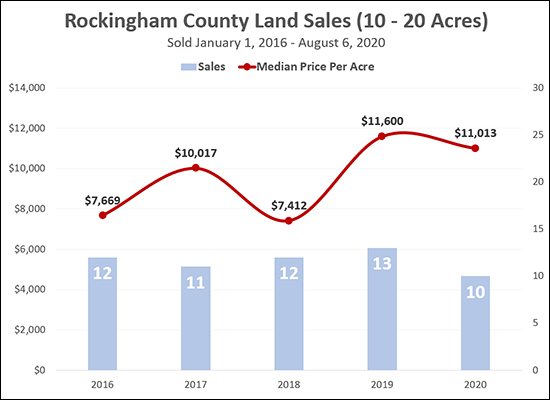 The number of 10 to 20 acre tracts selling per year has stayed much more consistent over the past four years (2016 - 2019) with 11, 12 or 13 parcels selling -- though there have already been 10 such sales in the first 7-ish months of 2020. The median price per acre has been generally trending up for this size of parcel, and seems poised to remain around $11K per acre this year. 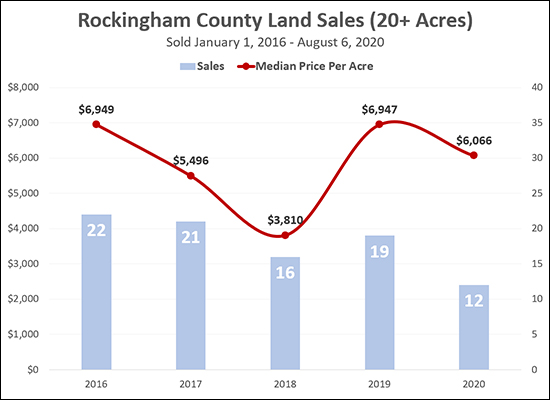 The median price per dipped down rather low ($4K/acre) in 2018 for parcels of 20+ acre but then rose quite significantly in 2019 to $7K per acre. We have seen around 15 to 20 such sales per year for the past several years but it seems we might surpass that in 2020. 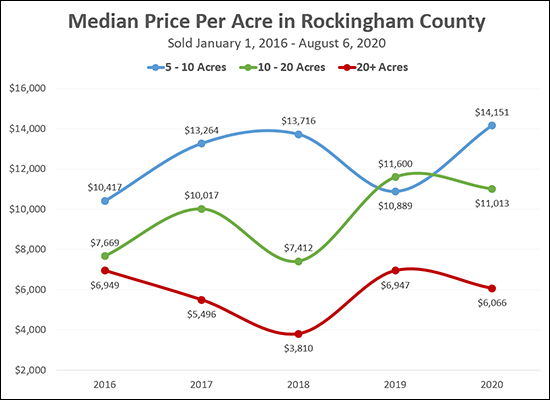 Finally, this (above) is a compilation of the price per acre for each parcel size. As you might expect, the larger the parcel, the lower the price per acre. | |
Cumulative Contract Activity Pulls Ahead In 2020 |
|
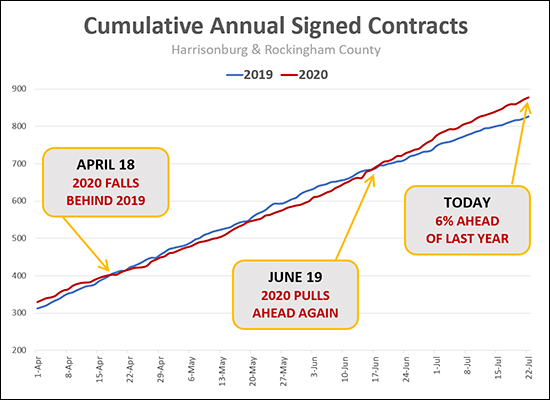 How did COVID-19 affect our local housing market? So far, this is what we're seeing...
Now, there have been 6% more contracts signed in 2020 than in 2019! There are still plenty of ways that COVID-19 could affect our local housing market, but we're not seeing any significantly harmful impacts to date. | |
Most Homes That Sell In The First Ten Weeks On The Market... Sell In The First Week |
|
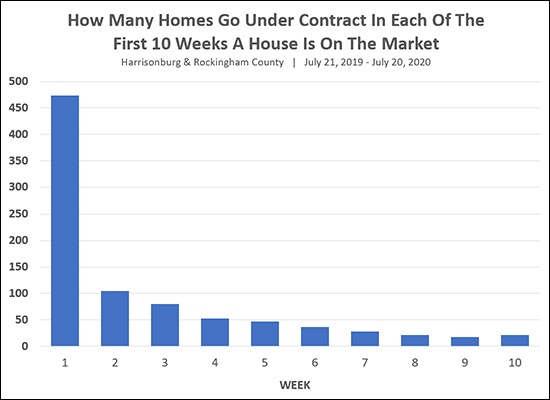 We know that homes are selling quickly. 62% of homes that sold in the past year were under contract within 30 days. 75% of homes that sold in the past year were under contract within 60 days. But was market activity spread out evenly over those first 4, 8 or 10 weeks? Not at all! As shown above, when we look at homes that went under contract within the first 10 weeks of being on the market -- a lot of them (most of them!) were under contract the very first week they were listed for sale! Perhaps this is also why we're seeing more than half of homes selling for more than their list price. | |
| Newer Posts | Older Posts |
Scott Rogers
Funkhouser Real
Estate Group
540-578-0102
scott@funkhousergroup.com
Licensed in the
Commonwealth of Virginia
Home Search
Housing Market Report
Harrisonburg Townhouses
Walk Through This Home
Investment Properties
Harrisonburg Foreclosures
Property Transfers
New Listings

