| Newer Posts | Older Posts |
Home Sales Increase (at least) 16% in 2016 |
|
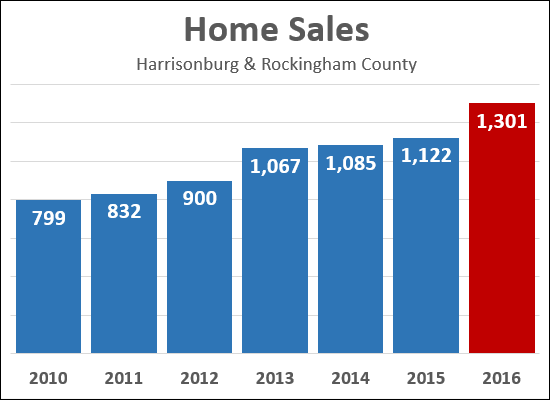 All home sales have not yet been reported but it is now clear that there were upwards of 1300 home sales in Harrisonburg and Rockingham County last year. We are likely to see that figure rise a bit more over the next few days as the last few sales are reported in our local MLS. This is a significant year-over-year increase in home sales as compared to previous years....
Stay tuned for my full market report in the next week or so, as well as predictions for the 2017 housing market. Oh, and HAPPY NEW YEAR! | |
How do higher mortgage interest rates affect monthly payments? |
|
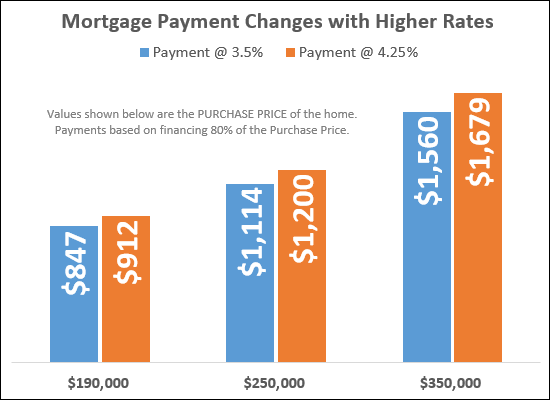 Just after the election, mortgage interest rates started rising. They started around 3.5%, and have since climbed to somewhere between 4.25% and 4.3%. It seems unlikely that they will come back own anytime soon -- if ever. So, what do these new mortgage interest rates mean for home buyers? Well, higher mortgage payments, naturally. The graph above shows the potential change in a monthly mortgage payment for a median priced home ($190K) as well as a home priced at $250K and $350K. The payment scenarios above assume that you are financing 80% of the purchase price -- and yes, I know, plenty of folks are really financing 90% or 95% of the purchase price. If you are financing a greater portion of the purchase price, the monthly payment will be higher, and the increase in the monthly payment will be greater. As you can see above.....
As always -- for actual payment scenarios, you'll need to consult a mortgage lender. Shoot me an email (scott@HarrisonburgHousingToday.com) and I can make some recommendations. | |
Just how crazy were November 2016 home sales? |
|
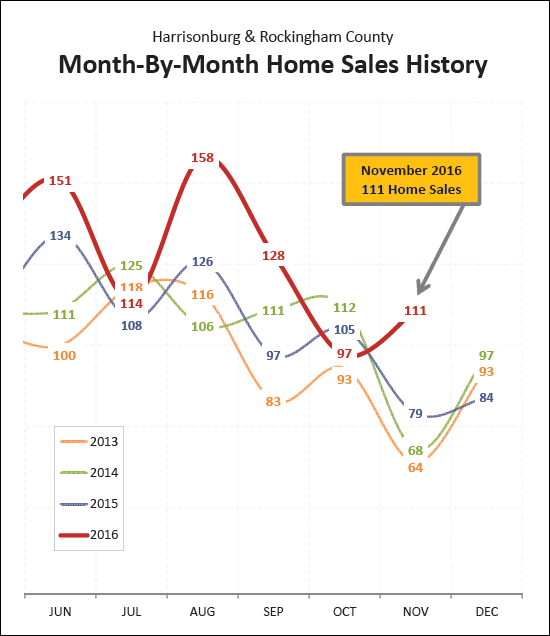
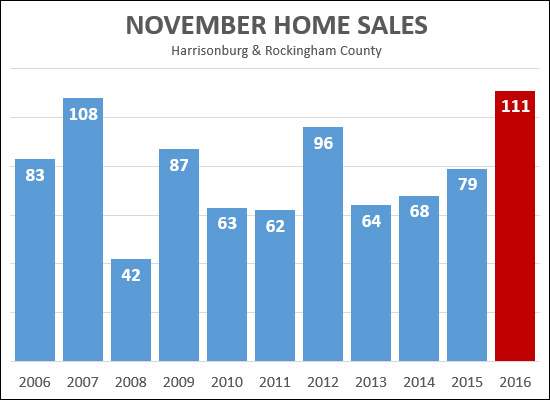 Let's go with "super-crazy" or "like-never-seen-before-in-the-past-10-years-crazy".... There were 111 home sales in November 2016. That is well more than seen in the three most recent months of November (2013, 2014, 2015) when we saw an average of 70 sales per month. In fact, if we look back over the past 10 (!!) years, there isn't even a month of November when there were 111 (or more) home sales in Harrisonburg and Rockingham County. The closest we came was in 2007 (real estate boom) when there were 108 home sales. In coming days, I'll take a look at why we should (or should not) be worried about another real estate "boom" locally. Until then, you can find out more about the Harrisonburg and Rockingham County real estate market by visiting....  | |
Home Sales Surge, Prices Rise, Inventory Drops in November 2016 |
|
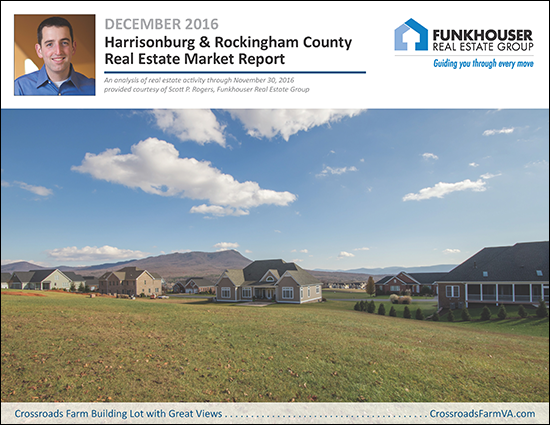 Learn more about this month's featured property: 130 Bedford Place I just published my monthly report on the Harrisonburg and Rockingham County real estate market. Jump to the full online market report, download the PDF, or read on for highlights.... First, let's take a look at the overall market performance in November.... 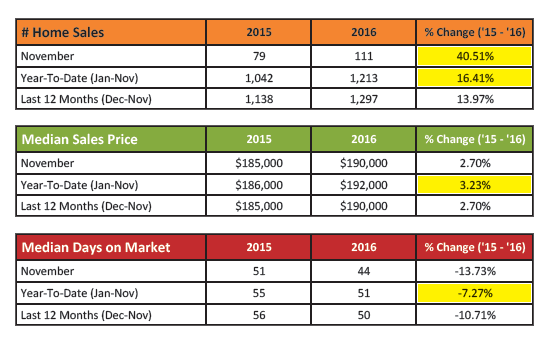 As shown above, it was a very strong month of sales performance in November. Here are a few highlights....
So, how is the overall year doing compared to previous years.... 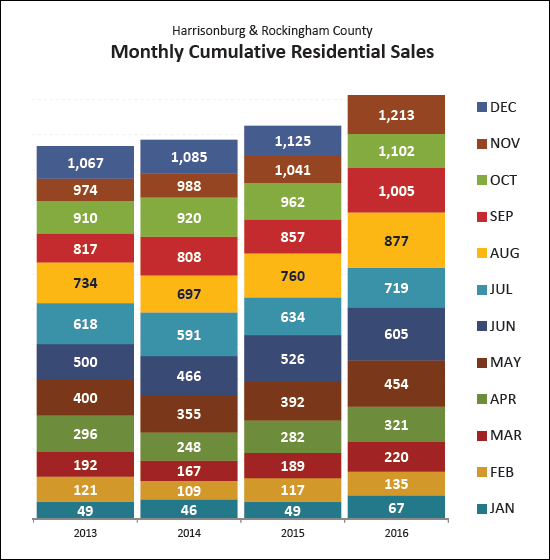 We have already seen more home sales in the first eleven months of 2016 than we saw in the full year of 2013, 2014 and 2015. At this point, we seem likely to finish out 2016 with more than 1,300 home sales! 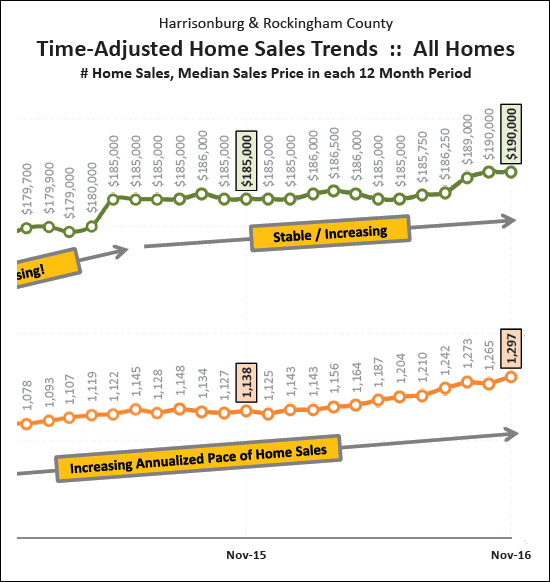 The graph above looks at a rolling 12-month window of sales data, showing the slow and steady progress we have made climbing to almost 1300 sales per year, and increasing (very recently) to a median sales price of $190,000. As demand increases (more buyers) prices start to increase if there is not more supply (more sellers) to meet that demand. Speaking of the supply of homes for sale.... 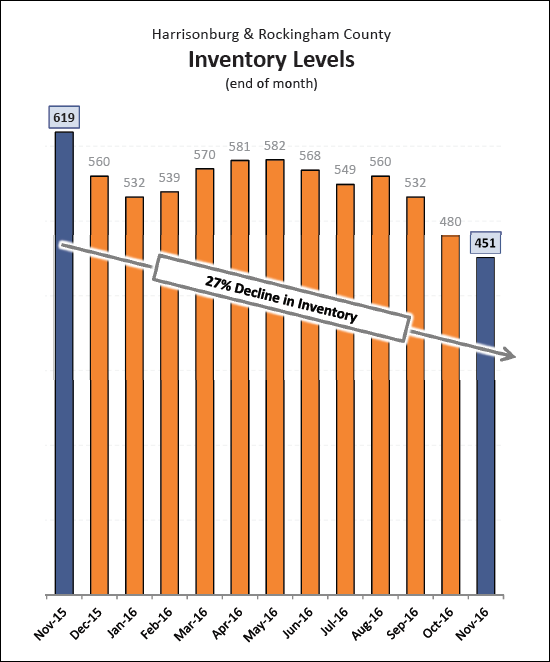 As mentioned above, increased demand (buyers) without increased supply (sellers) leads to increases in prices. Well, as shown directly above, we have certainly not been seeing an increasing supply of homes for sale -- in fact, we have seen a 27% decline in home sellers over the past year! To meet the increasing supply, we need more current homeowners to be selling, as well as more new construction to take place. 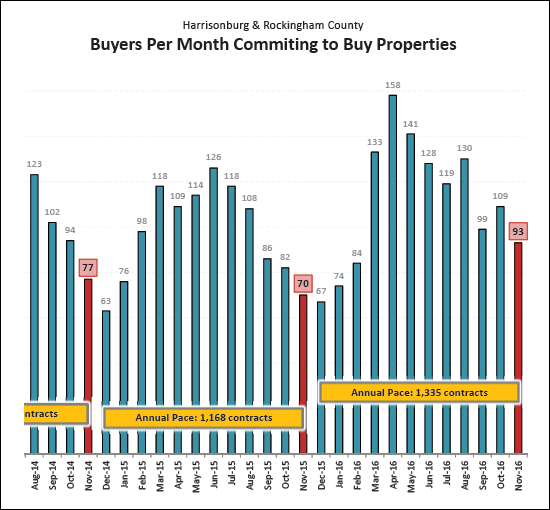 And -- guess what -- home sales are not likely to slow down much in December 2016, based on the 93 contracts signed during November 2016 -- which marks a 33% increase over the 70 contracts signed in November 2015. OK, there is plenty more to explore, such as....
But -- I'll let you read all about those tidbits via my full online market report, or by downloading the PDF, or by clicking here to sign up to receive my real estate blog by email. And -- as is always my encouragement -- if you will be buying or selling a home in the near future, start learning about our local housing market sooner rather than later! Being informed will allow you to make better real estate decisions. | |
Local Homes Sales Up 14% YTD Despite Slower Sales in October 2016 |
|
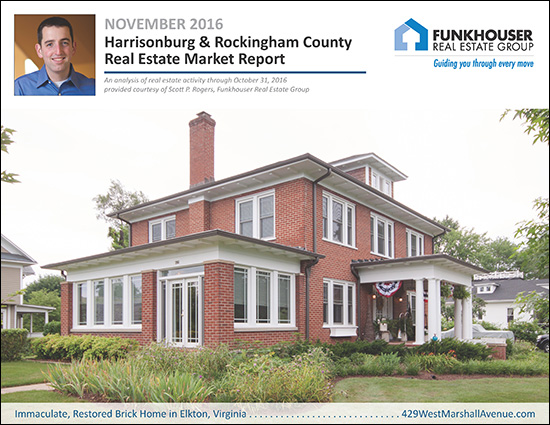 Learn more about this month's featured property: 429 West Marshall Avenue I just published my monthly report on the Harrisonburg and Rockingham County real estate market. Jump to the full online market report, download the PDF, or read on for highlights.... First, let's take a look at the overall market performance in October.... 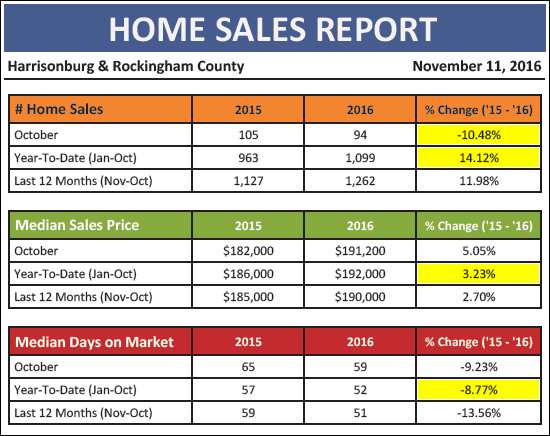 A few highlights from the quick snapshot above....
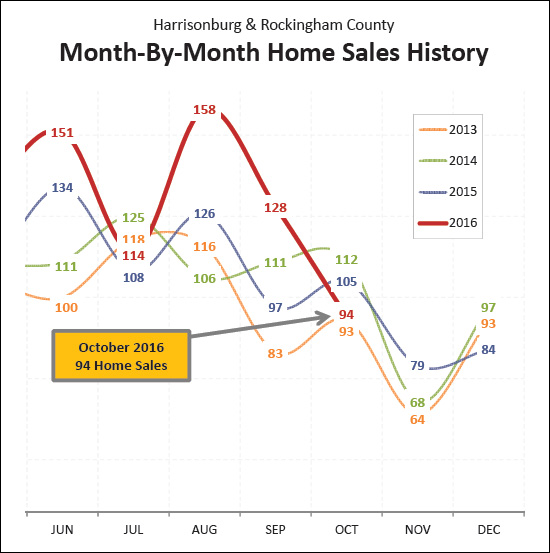
OK -- as noted above, the 94 homes sales seen in October 2016 mark a 10% decline as compared to the 105 home sales in October 2015, and that was even lower than the 112 home sales seen in October 2014. But before you get overly depressed about a slower October, remember....
So, it seems that the timing of home sales during the year can vary significantly from year to year. Looking at the past three months together can help put things in perspective in some ways....
There, not so bad now, right? That's a 16% improvement over last year when looking at these three months -- and as noted above, when looking at January through October, the pace of home sales in 2016 is 14% higher than it was last year. OK, on to some other items....
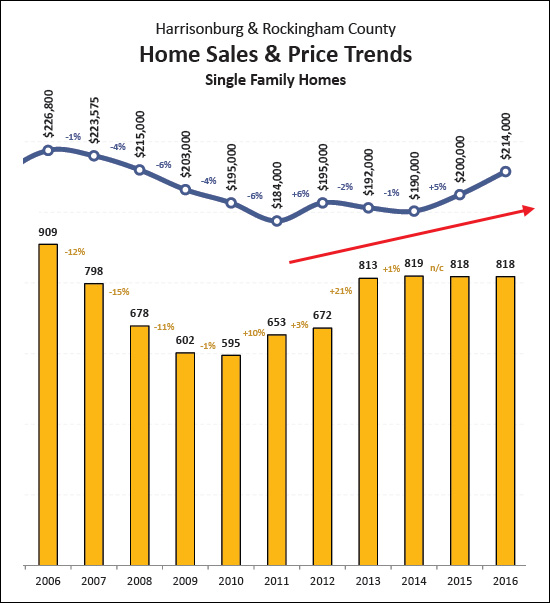
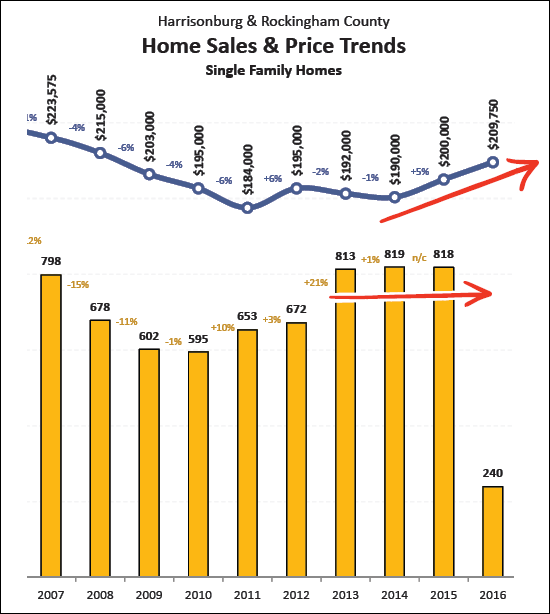
The median value of single family (detached) homes is often the best indicator of trends in home values in a local housing market. As shown above, we have been seeing those values increase over the past five years, most notably over the past two years. Also of note, as shown above, after hovering between 810 and 820 home sales per year for the past three years, it seems we are finally poised to break through that invisible barrier this year, as we are likely to see at least 900 and perhaps 950 single family home sales.
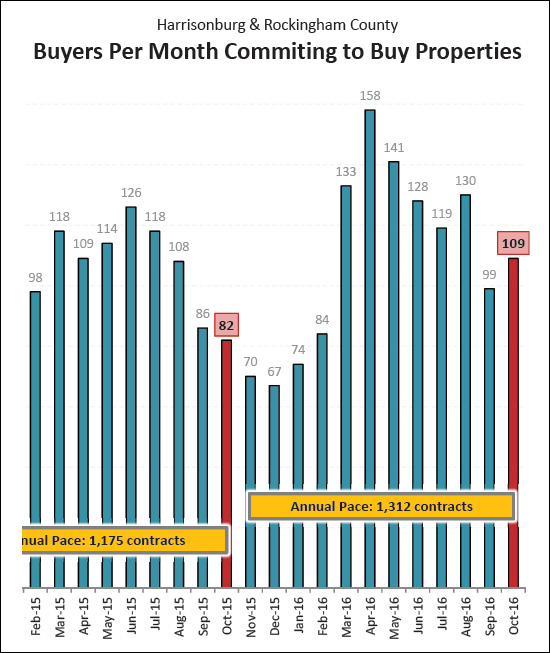
If my consoling notes above about why slower October home sales weren't so bad didn't help, then perhaps the graph above will help. Slower home sales in October 2016 does not mean that the fast and furious pace of 2016 home sales has come to an end. As shown above, buyers (and sellers) signed 109 home sales in October 2016 -- a 33% increase over the 82 contracts signed last October. So -- we might be in for another month of stronger sales in November.
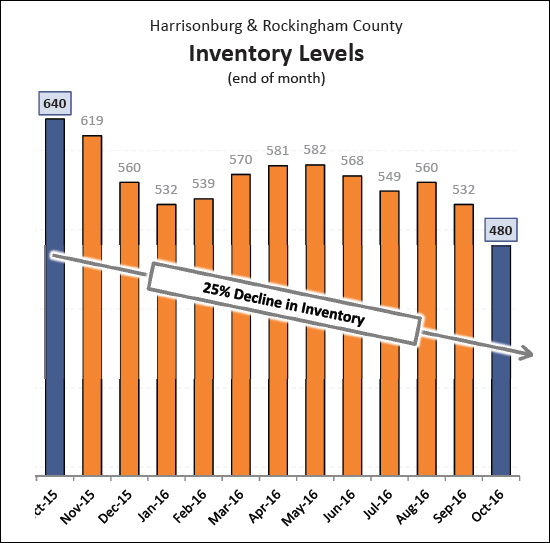
If you are trying to buy a home right now, it is quite possible that you are frustrated by not having many options to choose from. The graph above might explain why you are having this experience. Inventory levels continue to fall -- to where we now only have 480 homes on the market!?!?! This is as compared to a year ago when there were 640 homes on the market at this time -- showing a 25% year-over-year decline. This lack of inventory is slowly starting to tip the market in the favor of sellers, though not in all price ranges and not in all locations. OK, there is plenty more to say, such as....
But -- I'll let you read all about those tidbits via my full online market report, or by downloading the PDF, or by clicking here to sign up to receive my real estate blog by email. And -- as is always my encouragement -- if you will be buying or selling a home in the near future, start learning about our local housing market sooner rather than later! Being informed will allow you to make better real estate decisions. | |
Foreclosures Continue to Decline in Harrisonburg Area |
|
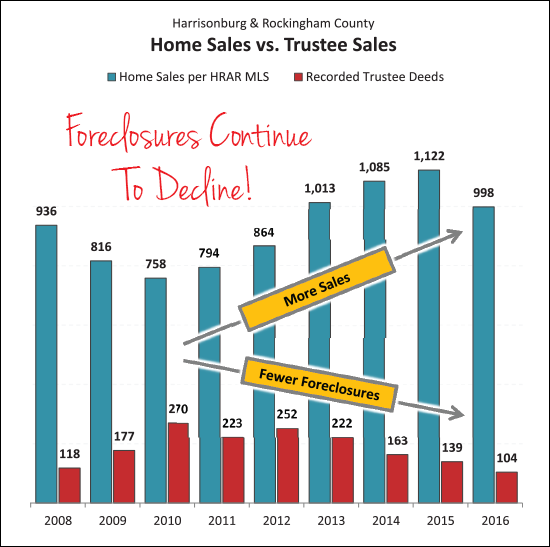 The graph above is a comparison of two imprecise measures -- but the comparison can still be helpful. The blue bars show the number of home sales recorded in the HRAR MLS -- this does not include private sales (without a Realtor), nor new home sales directly from a builder. The red bars show the number of recorded Trustee Deeds. Some foreclosed properties then show up again as REO properties. The foreclosure rate in our local market area is definitely trending downward, as there were 4.6 times as many home sales as foreclosures during 2013, 6.7 times as many home sales as foreclosures in 2014, and 8.1 times as many in 2015. Find out more about the Harrisonburg and Rockingham County real estate market by visiting....  | |
Astonishingly High Home Sales in September 2016 |
|
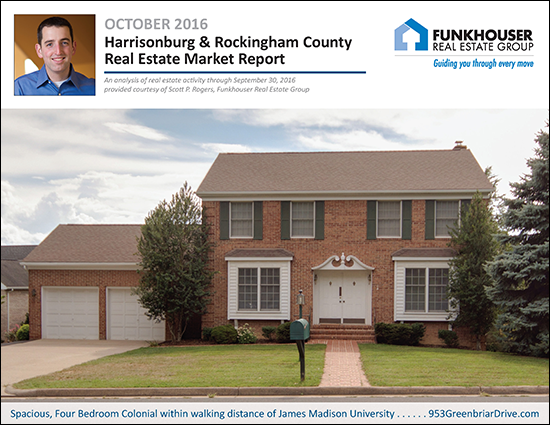 Learn more about this month's Featured Property: 953 Greenbriar Drive I just published my monthly report on the Harrisonburg and Rockingham County real estate market. Jump to the full online market report, download the PDF, or read on for highlights.... First, let's take a look at the overall market performance in September.... 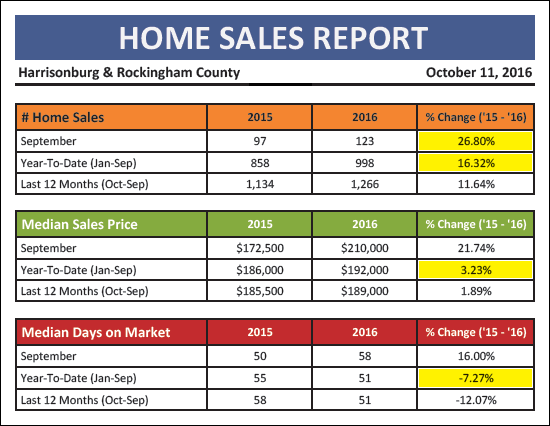 A few highlights from the basic data breakdown outlined above....
Now, let's contextualize those strong September sales.... 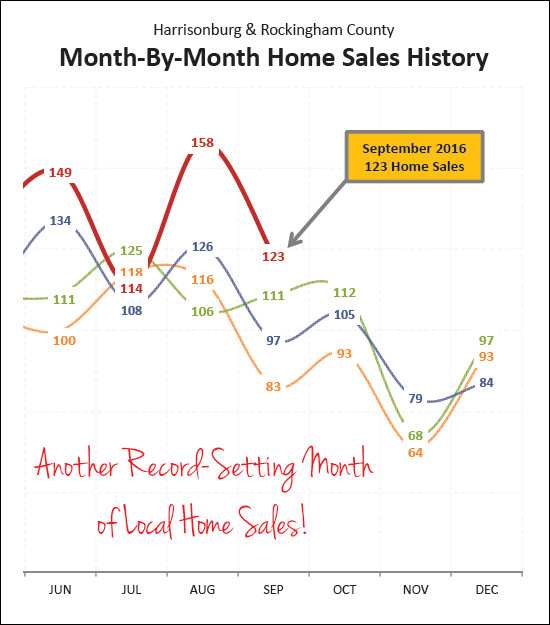 As stated above, there were a LOT of home sales in September 2016 -- a whopping 123 of them. When was the most recent time when we saw this many homes sales (or more) during the month of September? Waaaaaaay back in September 2005 when there were 136 home sales seems to be the only time we have ever seen more than 123 home sales. Wow! 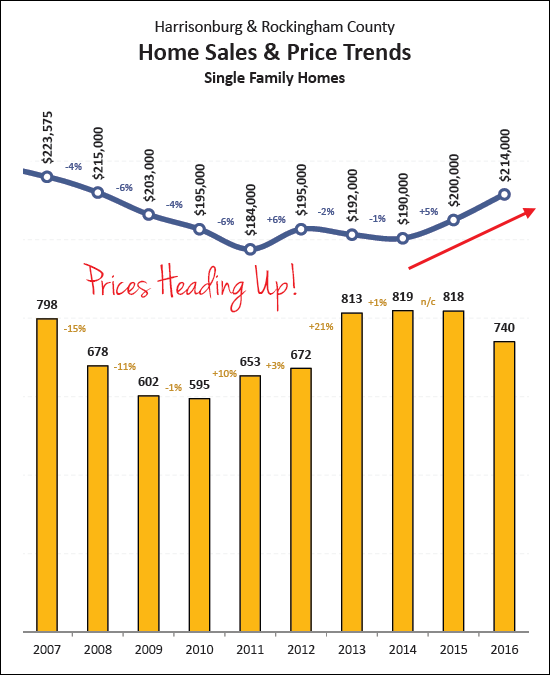 The median sales price of single family homes are often an excellent indicator of the price trends in a local real estate market, as they show a purer form of owner occupant supply and demand. When we examine townhouses as well, we are observing the buyer behavior of both owner occupants and investors -- and there can be much more short-term volatility in demand from investors. So, with the assumption that we'll get the clearest picture of price trends by looking at single family homes, it is striking to see a steady increase in median sales prices of these properties as shown in the graph above. 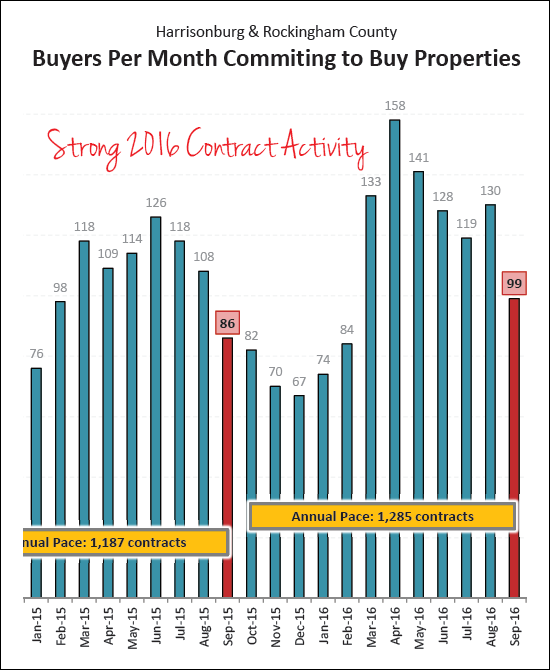 This graph clearly illustrates what a busy buying season it has been over the past seven months. We have seen an average of 130 contracts per month over the past seven months -- as compared to an average of only 96 contracts per month during the same timeframe in 2015. These strong contract numbers, clearly, are leading to the busy season of closings -- and we are likely to see yet another strong month of sales in October based on these contracts. 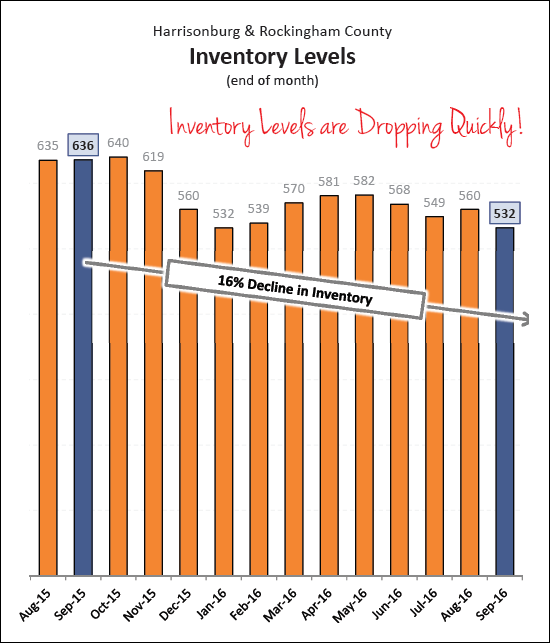 Finally -- buyers are finding fewer and fewer choices in the market -- as inventory levels (as shown above) have declined 16% over the past year. Looking back further (not shown above) there has been a 23% over the past two years! Well, there is much more to know, learn, read....but I'll pause here for now, and I'll let you explore that and read further on your own if you so choose. You can read my entire market report online....
| |
Campaign Launches to Build Park in Downtown Harrisonburg |
|
 The fundraising campaign for building a park in Downtown Harrisonburg kicked off last evening with an event at Pale Fire Brewing Co. with the exciting announcement that $500,000 has already been raised for the project! The park is estimated to cost $5.5 million to be built, and will be built on 4.2 acres of city-owned land including the municipal parking lot on South Liberty Street, the Harrisonburg Farmer's Market Turner Pavilion and the grassy lawn area next to the parking lot. Construction on the park is expected to start in 2017. View the layout of the park and learn about opportunities to support this effort by visiting BuildOurPark.org. Read today's Daily News Record article here. | |
Wild month of home sales in August 2016, contextualized |
|
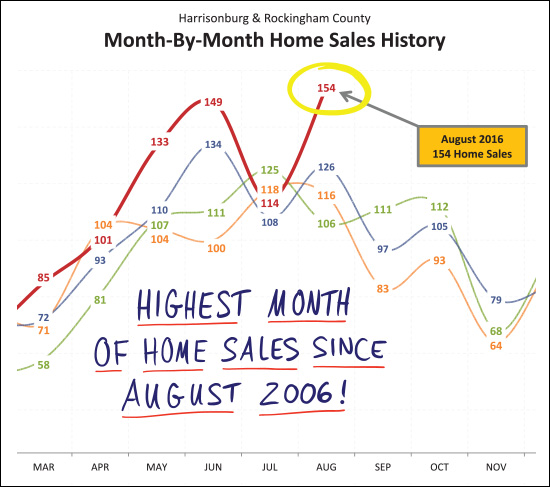
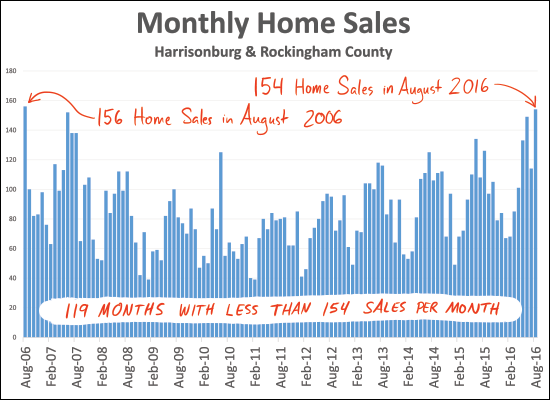 As reported yesterday, we had a RECORD NUMBER of home sales in August 2016. There were 154 home sales --and the most recent month when we saw more than 154 home sales was waaaaaay back in August 2006. With plenty of contracts in August 2016 as well, we are likely to see another strong month of sales in September --- though maybe not 154 of them. Read more about the local housing market here....  | |
Record Number of Home Sales in August 2016 |
|
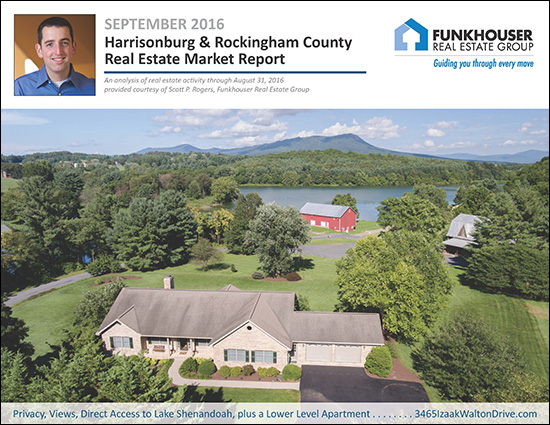 Learn more about this month's Featured Property: 3465 Izaak Walton Drive I just published my monthly report on the Harrisonburg and Rockingham County real estate market. Jump to the full online market report, download the PDF, or read on for highlights.... First, let's take a look at the overall market performance in August.... 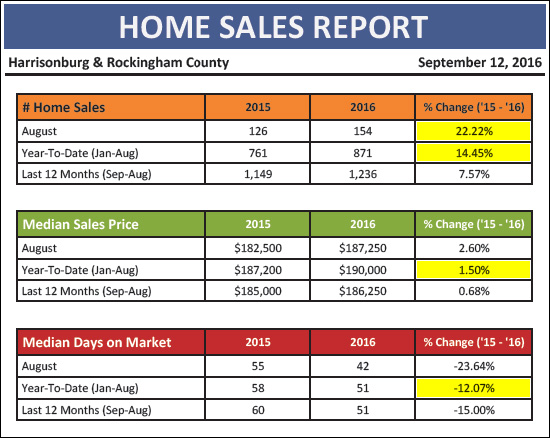 A few highlights from the basic data breakdown outlined above....
As promised, a bit more context. The 154 home sales in Harrisonburg and Rockingham County during August 2016 marked the HIGHEST number of home sales seen anytime in the previous 10 years. We'd have to stretch back 121 months to August 2006 to find the next highest month of home sales, when we saw 156 home sales.
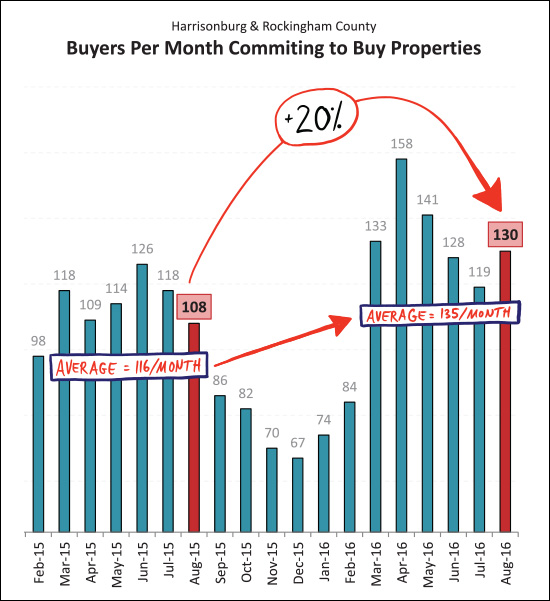
But wait, there's more. If you thought August home sales was the end of a series of strong months, you might be wrong. Take a look at the contract data (above) and you'll note that there were a whopping 130 contracts signed in August -- a 20% increase over last August. As such, we should expect to see strong September/October sales as well. Also of note, over the past six months we have seen an average of 135 contracts signed per months, as compared to only 116 per month a year prior.
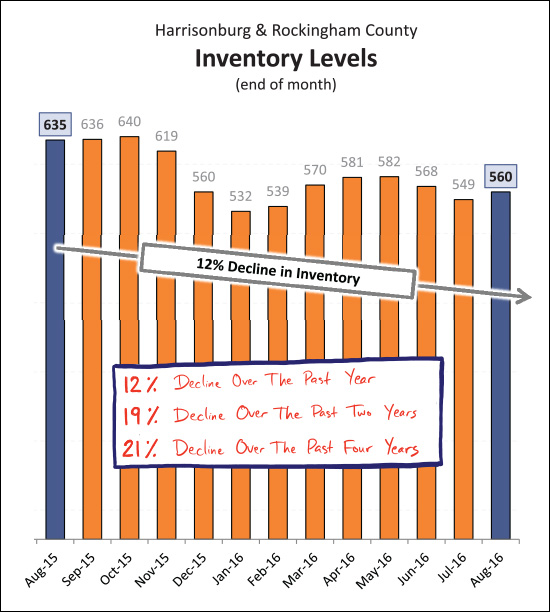
And the inventory levels keep on dropping. Buyers have fewer and fewer choices these days with current inventory levels hovering around 560 homes for sale in Harrisonburg and Rockingham County. This results in the best listings (price, condition, marketing) being sold quickly. There is much more to know, learn, read.... I'll pause here for now, but I'll let you explore that and read further on your own if you so choose. You can read my entire market report online....
| |
$60M MillerCoors Expansion in Elkton, VA |
|
 In local economic development news, the MillerCoors brewery in Elkton, Virginia has announced a $60 million expansion! This investment by Miller Coors will allow for the installation of new infrastructure to brew more beer brands and will result in 27 new jobs. Some fast facts about the Shenandoah Valley MillerCoors brewery....
| |
More Homes are Selling, Faster, at Higher Prices in Harrisonburg, Rockingham County |
|
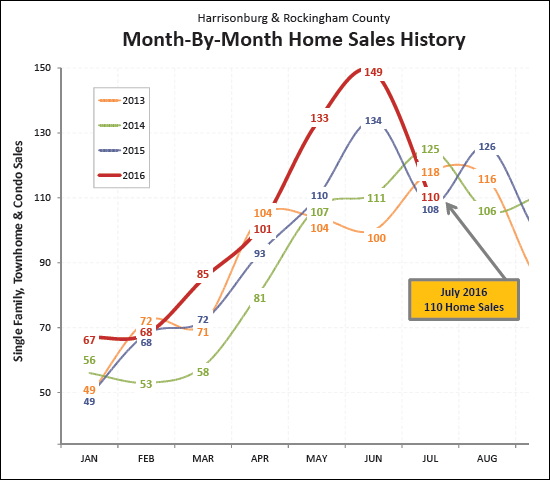
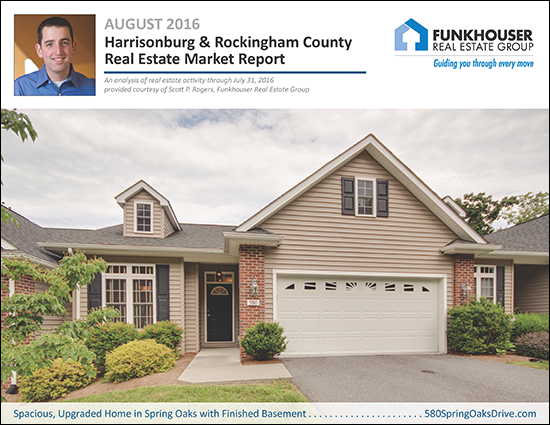 Learn more about this month's Featured Property: 580 Spring Oaks Drive I just published my monthly report on the Harrisonburg and Rockingham County real estate market. Jump to the full online market report, watch the video overview below, download the PDF, or read on for highlights.... First, a video overview....  Now, let's take a look at the overall market performance in July.... 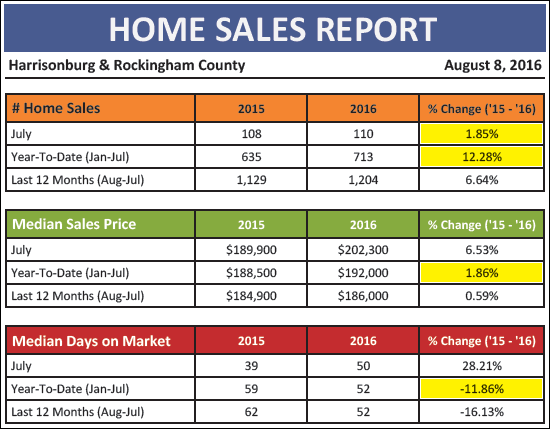 A few things jump out at me when looking at the chart above....
July could be seen as a disappointment in some ways. We didn't see sky high home sales, towering over all previous months of July. We only saw a tiny 1.85% increase in sales as compared to July 2015. But wait -- before we become too glum about the 110 home sales in July, let's not forget the record breaking months of sales that we saw in May and June! Just for fun, let's look at May through July home sales for the past few years....
So, yes, I think we can be satisfied with the 110 home sales we saw in July 2016 given the slightly larger context.
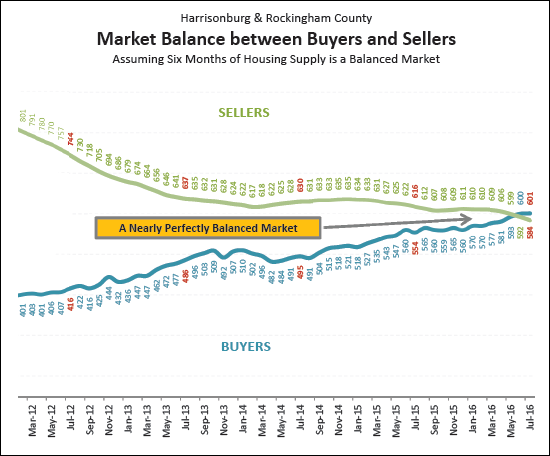
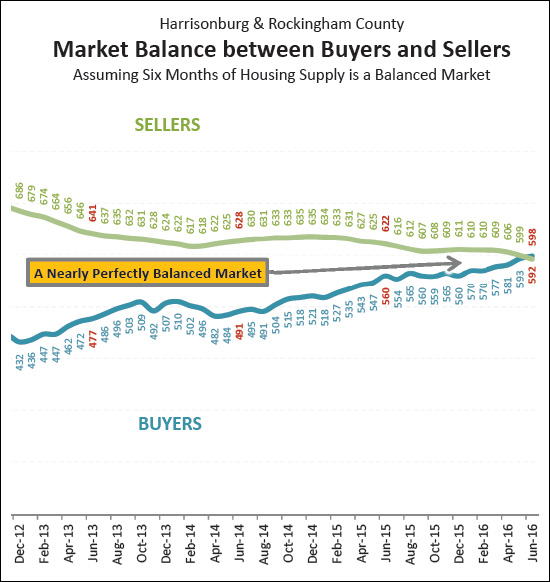
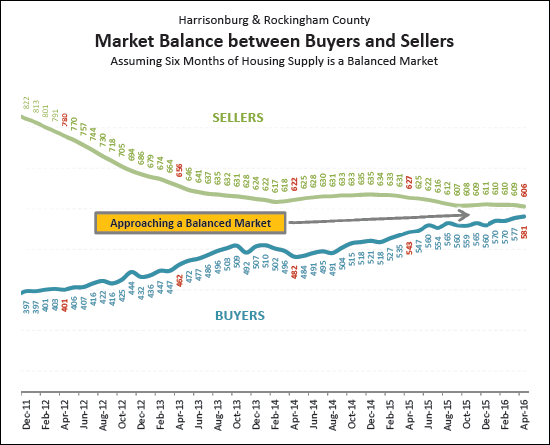
The graph above is somewhat complicated, but very important as to an understanding of our local housing market. The green "SELLERS" trajectory is showing the number of homeowners trying to sell their homes. The blue "BUYERS" trajectory shows the number of buyers closing on the purchase of homes in a six month period. This graph, therefor, is a good indication of overall market balance in our local housing market, as many housing market analysts consider a six month supply of homes for sale to be a sign of a market that is balanced between buyers and sellers. As shown above, after many years, we finally saw these trajectories cross last month. That is to say that there are now more buyers buying in a six month period than there are sellers selling. As such, if we've been approaching a balanced market for the past year, it is now definitely "in balance" -- even if that varies some from price range to price range.
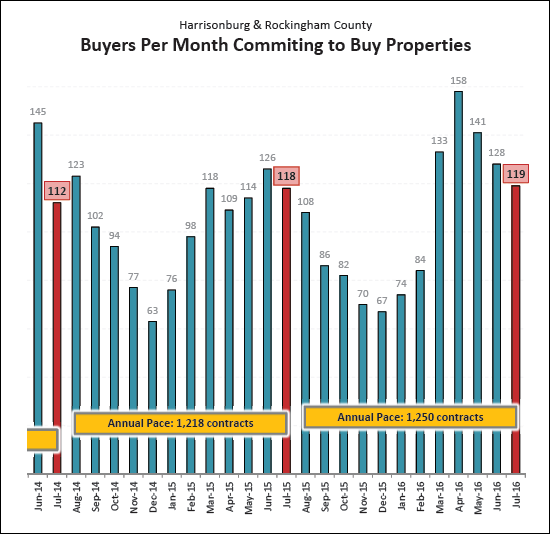
Taking a look at buyer activity in the form of signed contracts, we see that July was another relatively strong month with 119 contracts signed -- as compared to 118 last July. Put in a slightly larger context, we have seen an average of 136 contracts per month over the past five months -- as compared to an average of only 117 contracts per month during the same timeframe in 2015.
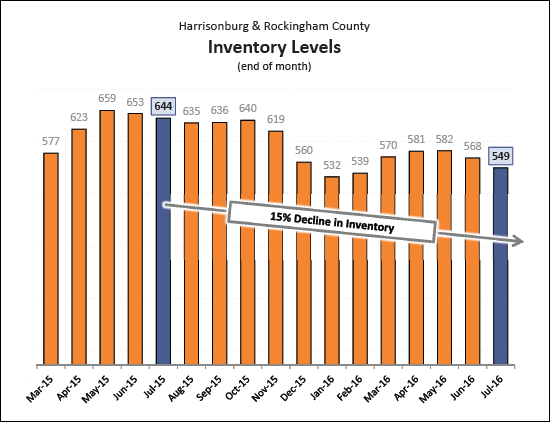
One of the ways that we have achieved the market balance illustrated above is by a reduction in the number of homes for sale. As the graph above indicates, we have seen a 15% decline in inventory levels over the past year. Thus, buyers a year ago had 644 homes to choose from -- and today can only choose from 549 properties. OK, let's cut off my ramblings about our local market there for now. There is a lot more more in my full real estate market report, but I'll let you explore that and read further on your own if you so choose. I'll continue to delve into the latest trends on HarrisonburgHousingToday.com over the next few days, but if you just can't wait, feel free to read the entire report online....
| |
Explore More Discovery Museum in downtown Harrisonburg expanding upwards! |
|
 Explore More Discovery Museum, in downtown Harrisonburg, is expanding upwards, onto the 2nd and 3rd floors. The future 2nd floor Arts & Innovation area will offer eight new, interactive exhibit galleries! Explore in the tree house,build in the construction zone, fly the airplane, create movies, music and art! The 3rd Floor Community Education Center will provide greatly needed multi-purpose space for educational programs and special events. Two new classrooms and a kitchen facility will offer unique opportunities to expand enrichment offerings. Construction is in progress! Read more about the expansion here and consider making a donation to support this effort. | |
Current mortgage rates still WELL below 12 month average |
|
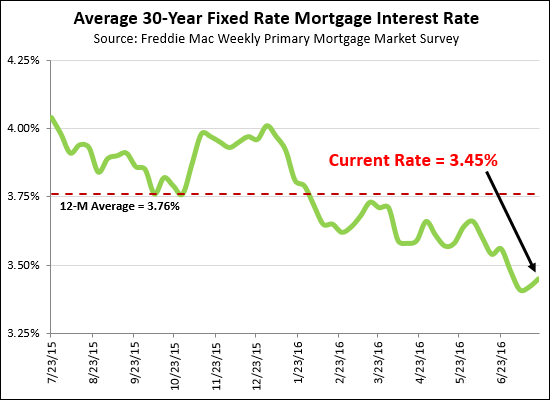 If I said, a year ago, that mortgage interest rates were going to rise soon --- I was WRONG!!! Current mortgage interest rates are just below 3.5%, and while I am still thinking that they could or will start to increase soon --- I would not be surprised if they are still below 4% a year from now. Buyer still have great buying power, and the opportunity to lock in super-low interest rates for the next 30 years. | |
Strong Home Sales in June 2016 Bring Further Balance to Local Market |
|
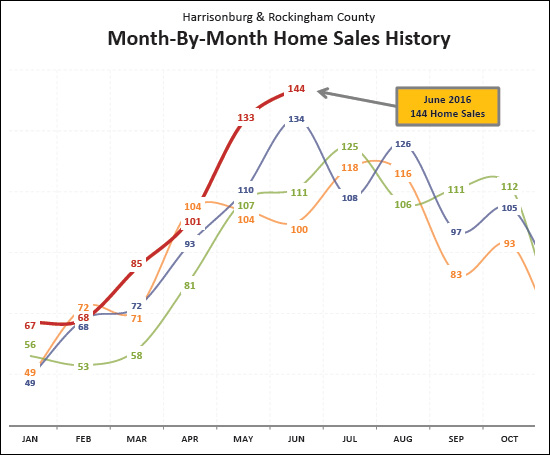
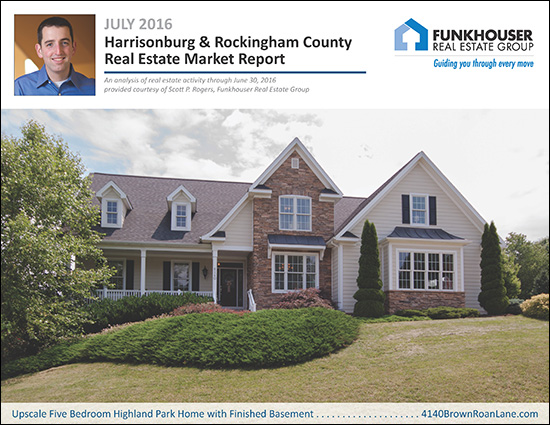 Learn more about this month's Featured Property: 4140 Brown Roan Lane I just published my monthly report on the Harrisonburg and Rockingham County real estate market. Jump to the full online market report, watch the video overview below, download the PDF, or read on for highlights.... First, a video overview....  Now, let's take a look at the overall market performance in June.... 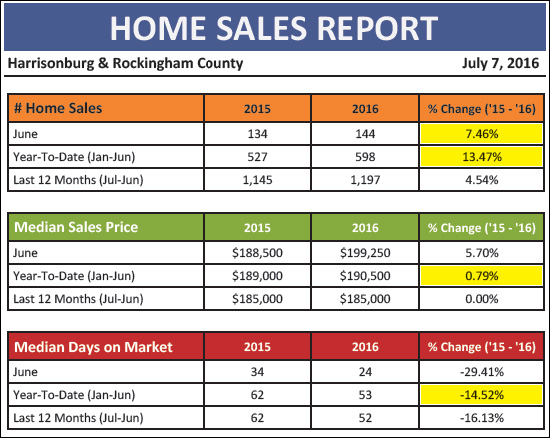 As shown above....
OK -- BIG NEWS HERE -- June 2016 home sales were "off the charts" as they say -- the highest month of monthly home sales we have seen in a LONG TIME! Actually, looking back further that this chart -- the last time we had more than 144 home sales was back in June 2007 -- at the peak of the market boom.
AND -- MORE BIG NEWS -- It happened! It really happened! Most housing market analysts consider six months of inventory (active listings) to be an indicator of a balanced market (between buyers and sellers). The "BUYERS" trend line above is illustrating how many buyers are buying in a six month period. The "SELLERS" trend line above is illustrating how many sellers are in the market (active listings) at any given time. Over the past four years we have seen a steady increase in buyers and a declining number of sellers. And finally, in June, these two trajectories have crossed! There are more buyers buying in a six month period than there are homes for sale!
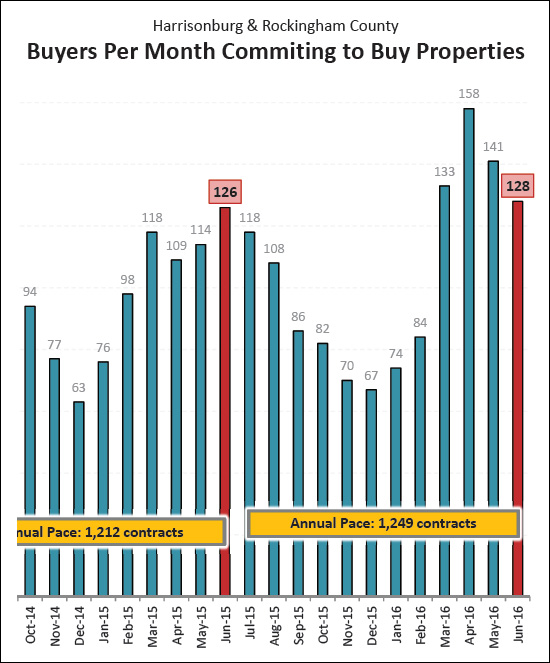 Finally, what should we expect as far as sales for the next few months? Based on recent contract activity, I am thinking we'll see another strong month of sales during July. To put this year in perspective, we have seen an average of 140 contracts per month over the past four months -- as compared to an average of only 117 contracts per month during the same timeframe in 2015. There is more, oh so much more, in my full real estate market report. I have even made it very easily accessible for you to read online....
| |
Home Sales on the Rise in Local Market in May 2016 |
|
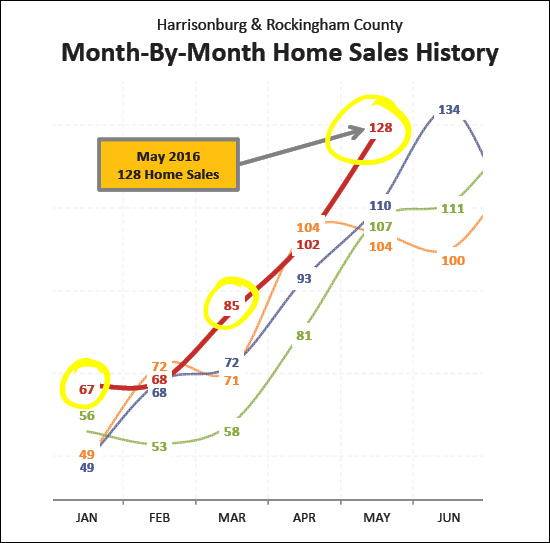
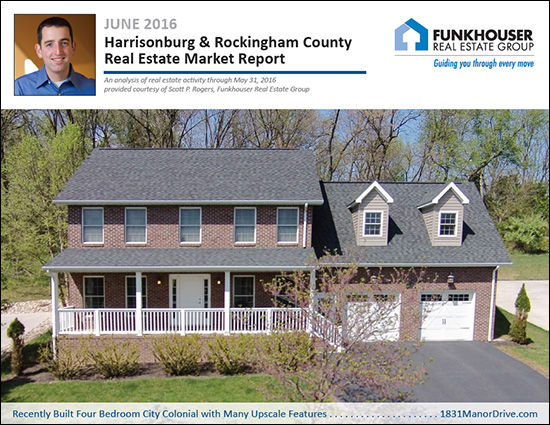 Learn more about this month's Featured Property: 1831 Manor Drive I just published my monthly report on the Harrisonburg and Rockingham County real estate market. Jump to the full online market report, watch the video overview below, or download the PDF, or read on for highlights.... First, a video overview....  Now, let's take a look at the overall market performance in May.... 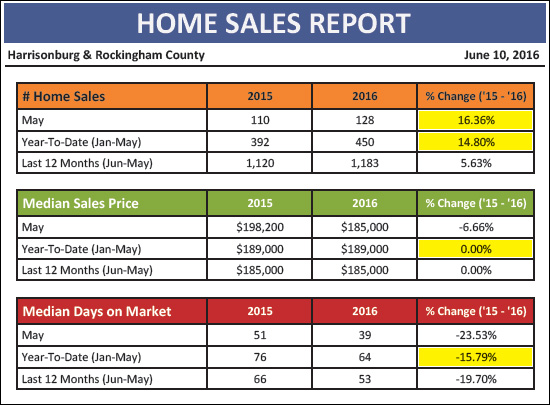 The local housing market is, again, showing signs of strength....
As shown above, there have been several months in particular -- January, March, May -- that have catapulted us to our current 15% improvement in home sales this year as compared to last year.
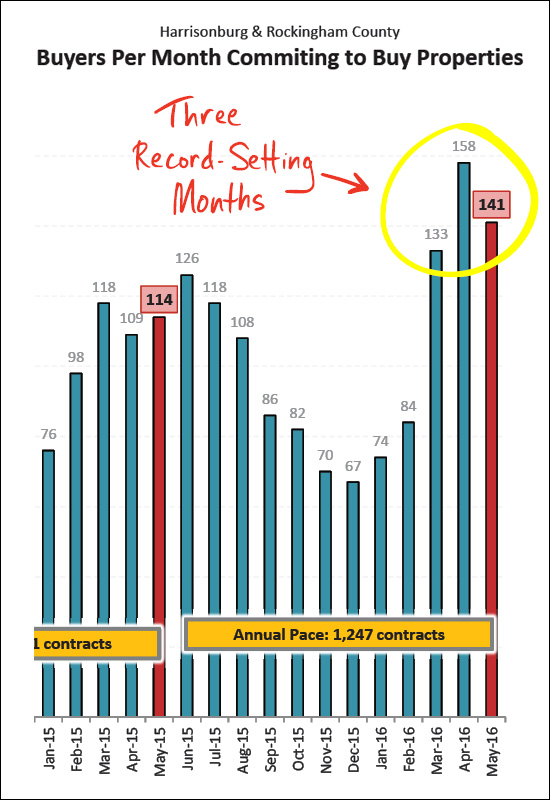
We have seen buyers signing contracts in record numbers over the past three months -- which bodes well for strong sales in June as well as (likely) July.
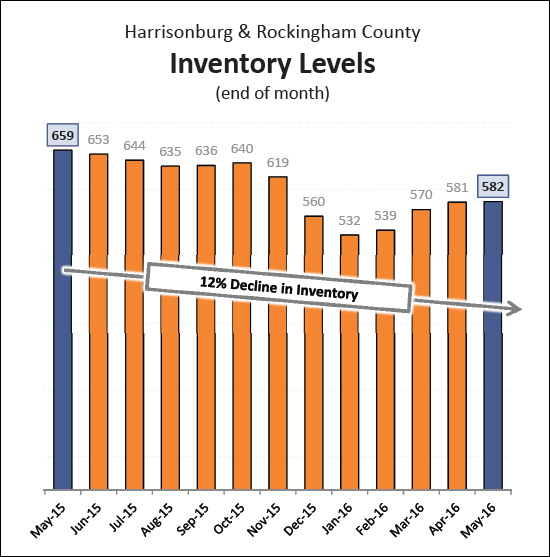
Buyers are buying faster than sellers are ready to sell. Inventory levels, as shown above, have declined 12% over the past year. Buyers are seeing fewer and fewer choices of homes to purchase.
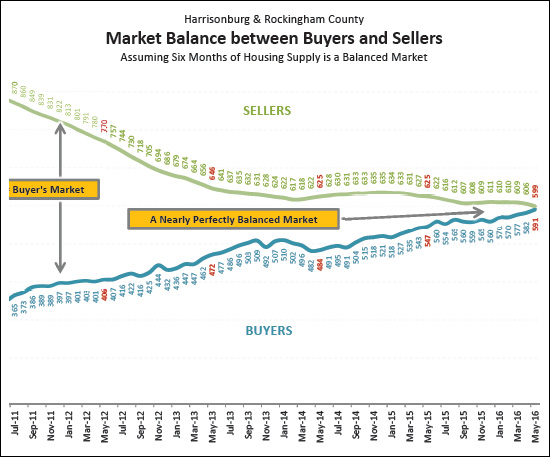
Finally, the market graph we've all been waiting for -- as shown above, we are finally (!) approaching a perfect balance between buyers and sellers in our local market -- with almost exactly six months of supply available. This is a result of a slowly increasing pace of buying activity over the past few years -- and a slowly declining inventory level during the same timeframe. BUT WAIT -- remember -- all real estate is local, and sometimes that means down to the city, town or even neighborhood. If you are getting ready to sell your home, we should start by looking at these overall trends -- but then we'll need to dive much deeper into the analysis of your price range, neighborhood. property type, etc. There is more, oh so much more, in my full real estate market report. I have even made it very easily accessible for you to read online....
| |
SHARP DECLINE.... in local area unemployment rate!?! |
|
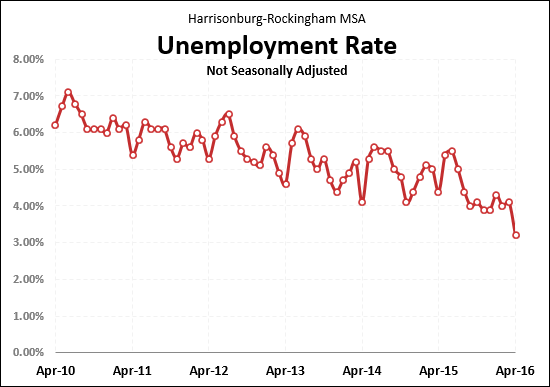 The local unemployment rate dropped quickly, drastically, sharply in April 2016. Waaaaay down to 3.2% -- which is the lowest rate on record in the past six years -- by far. Read some commentary on this news via last week's Daily News Record article, excerpted below. Unemployment in the Harrisonburg metropolitan area hit an eight year low in April, according to data released Wednesday by the U.S. Bureau of Labor Statistics. | |
April 2016 was the BEST MONTH EVER for contracts |
|
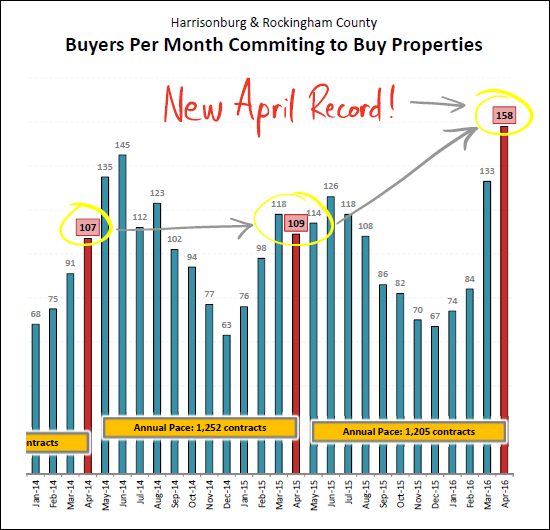
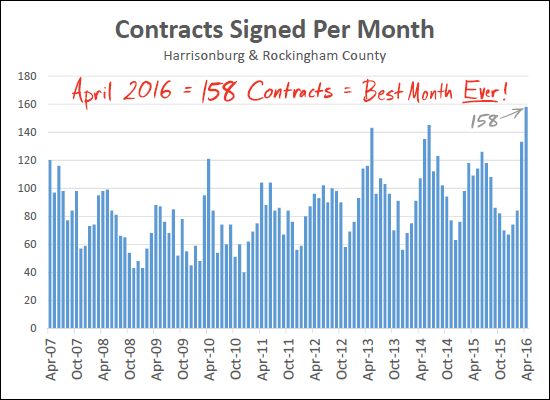 Yep, you heard that correctly, April 2016 was the BEST MONTH EVER -- there has never been another month in Harrisonburg and Rockingham County when more buyers contracted to buy homes. Stay tuned for what might come in May and June. Could we see even higher levels of contract activity? Read more about the local housing market.....  | |
Local Housing Market Shows Strength, Growth in April 2016 |
|
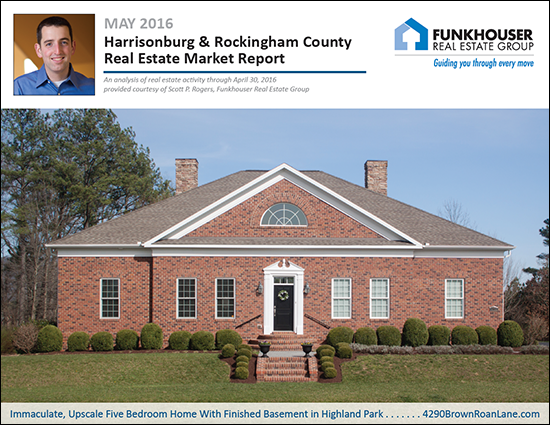 Learn more about this month's Featured Property: 4290 Brown Roan Lane I just published my monthly report on the Harrisonburg and Rockingham County real estate market. Jump to the full online market report, watch the video overview video, or download the PDF, or read on for highlights.... First, a video overview....  Next, let's take a look at the overall market performance in April.... 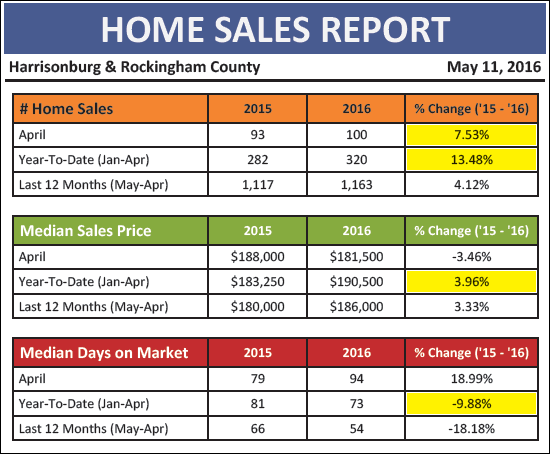 We are, again, looking at signs of strength and growth for our local market....
Let's dig into a few details....
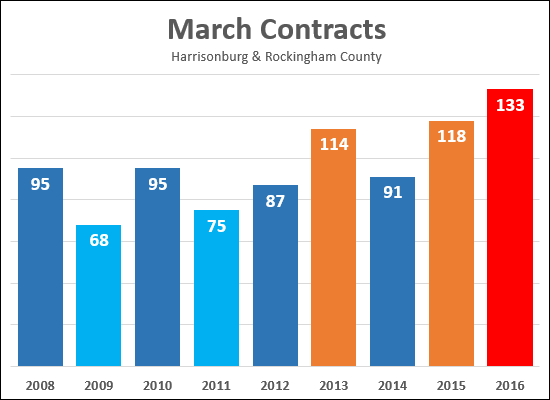
Wow! This graph shows very clearly (look at the last two bars on the right) how HOT of a Spring real estate market we are experiencing this year. The pace of contracts in March was a new record for March -- and in April, buyers have done it again. As far back as I have on record (2007) there has never been a month of April when this many (158) contracts have been signed in Harrisonburg and Rockingham County.
Single family homes are often the best indicator of overall trends in a local housing market. As shown above, sales of single family homes are quite stable -- and the median price has been on the rise for several years now. It seems likely that we will see another increase in the median sales price of single family homes in 2016.
Most housing market analysts consider six months of inventory (active listings) to be an indicator of a balanced market (between buyers and sellers). The "BUYERS" trend line above is illustrating how many buyers are buying in a six month period. The "SELLERS" trend line above is illustrating how many sellers are in the market (active listings) at any given time. Over the past four years we have been seeing a steady increase in buyers in the market and a decline in sellers in the market. In Summary.... | |
Most March Contracts Ever? |
|
| Newer Posts | Older Posts |
Scott Rogers
Funkhouser Real
Estate Group
540-578-0102
scott@funkhousergroup.com
Licensed in the
Commonwealth of Virginia
Home Search
Housing Market Report
Harrisonburg Townhouses
Walk Through This Home
Investment Properties
Harrisonburg Foreclosures
Property Transfers
New Listings

