| Newer Posts | Older Posts |
Almost 1,700 New Homes (or home sites) Are Being Developed or Built in Harrisonburg and Rockingham County With Another 4,000 Planned or Proposed |
|
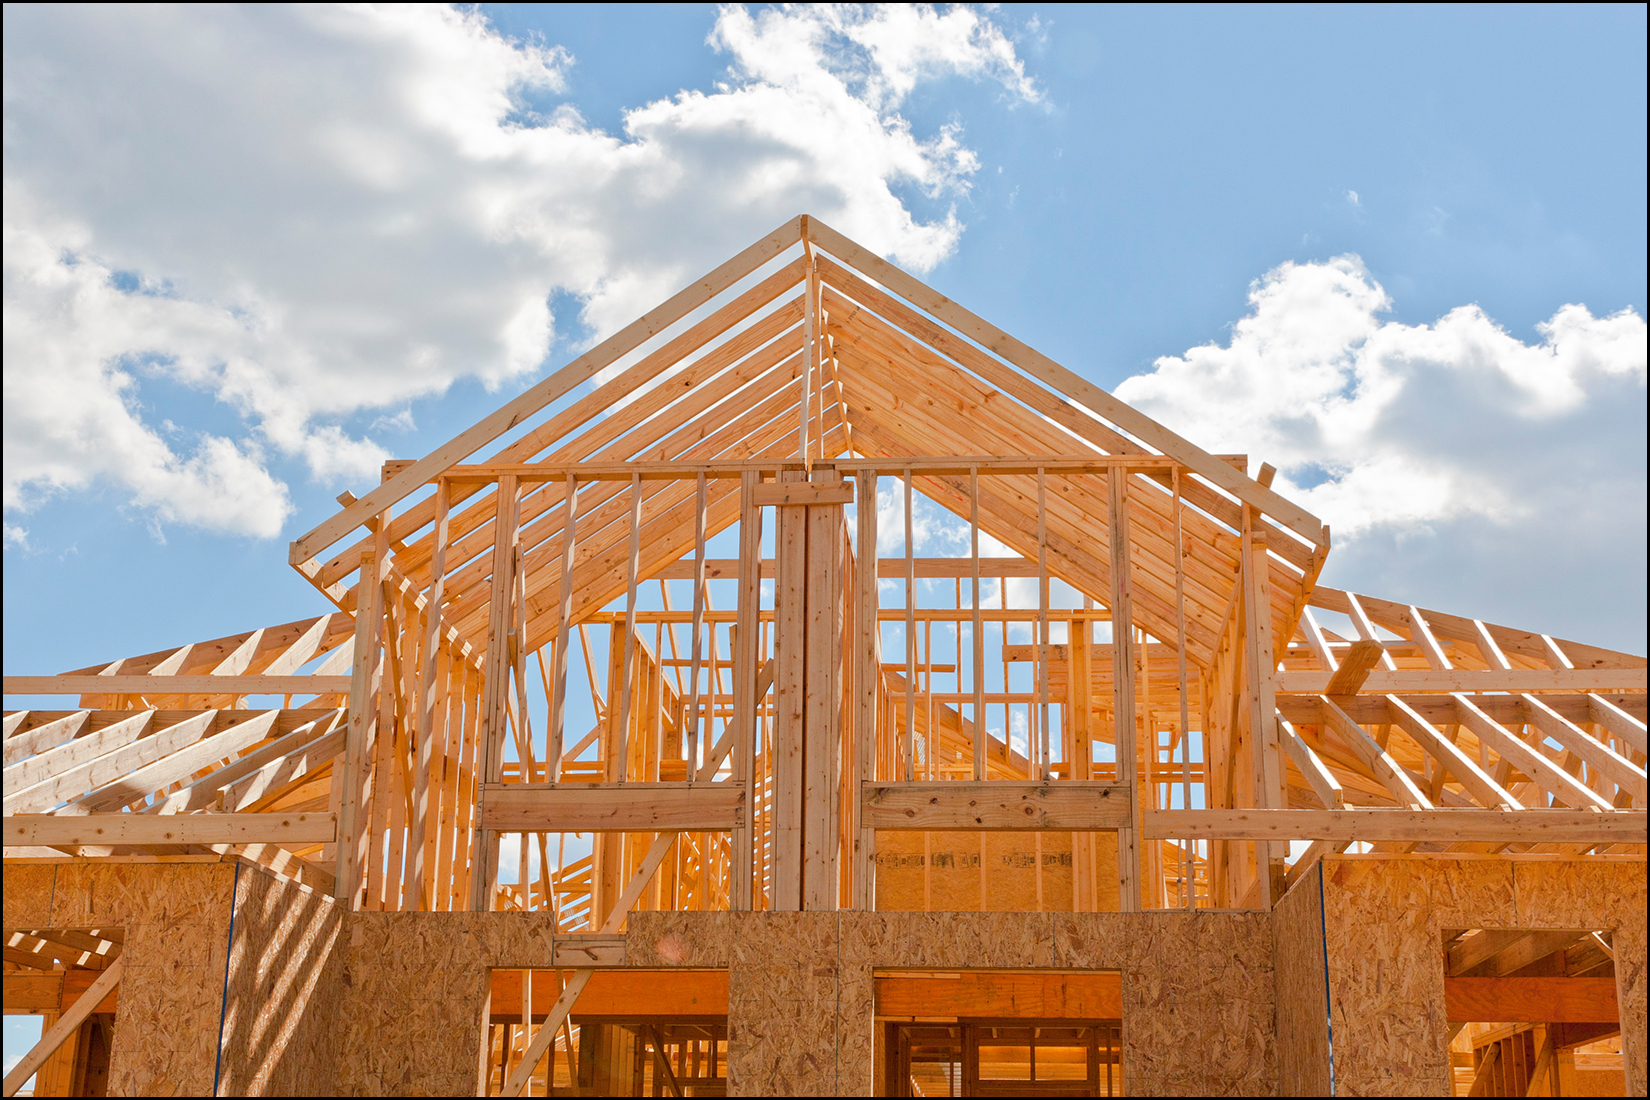 LOTS of new housing is currently being developed in Harrisonburg and Rockingham County... though mostly in Rockingham County. Below are most that I am aware of, with approximate unit counts, though you can find it in spreadsheet form, with some links, here. 369 Apartments
647 Townhouses & Duplexes
287 Single Family Detached Homes or Home Sites
This is not to mention the 4,314 homes that are being planned or proposed...
The important, and perhaps unanswerable, big questions are... [1] Is enough housing being built or planned to support a growing population? [2] Is too much housing being built or planned beyond what our growing population needs? [3] Is the right type, size, and price of housing being built? | |
If You Expected The Local Housing Market To Slow Down Drastically, This Probably Is Not What You Meant |
|
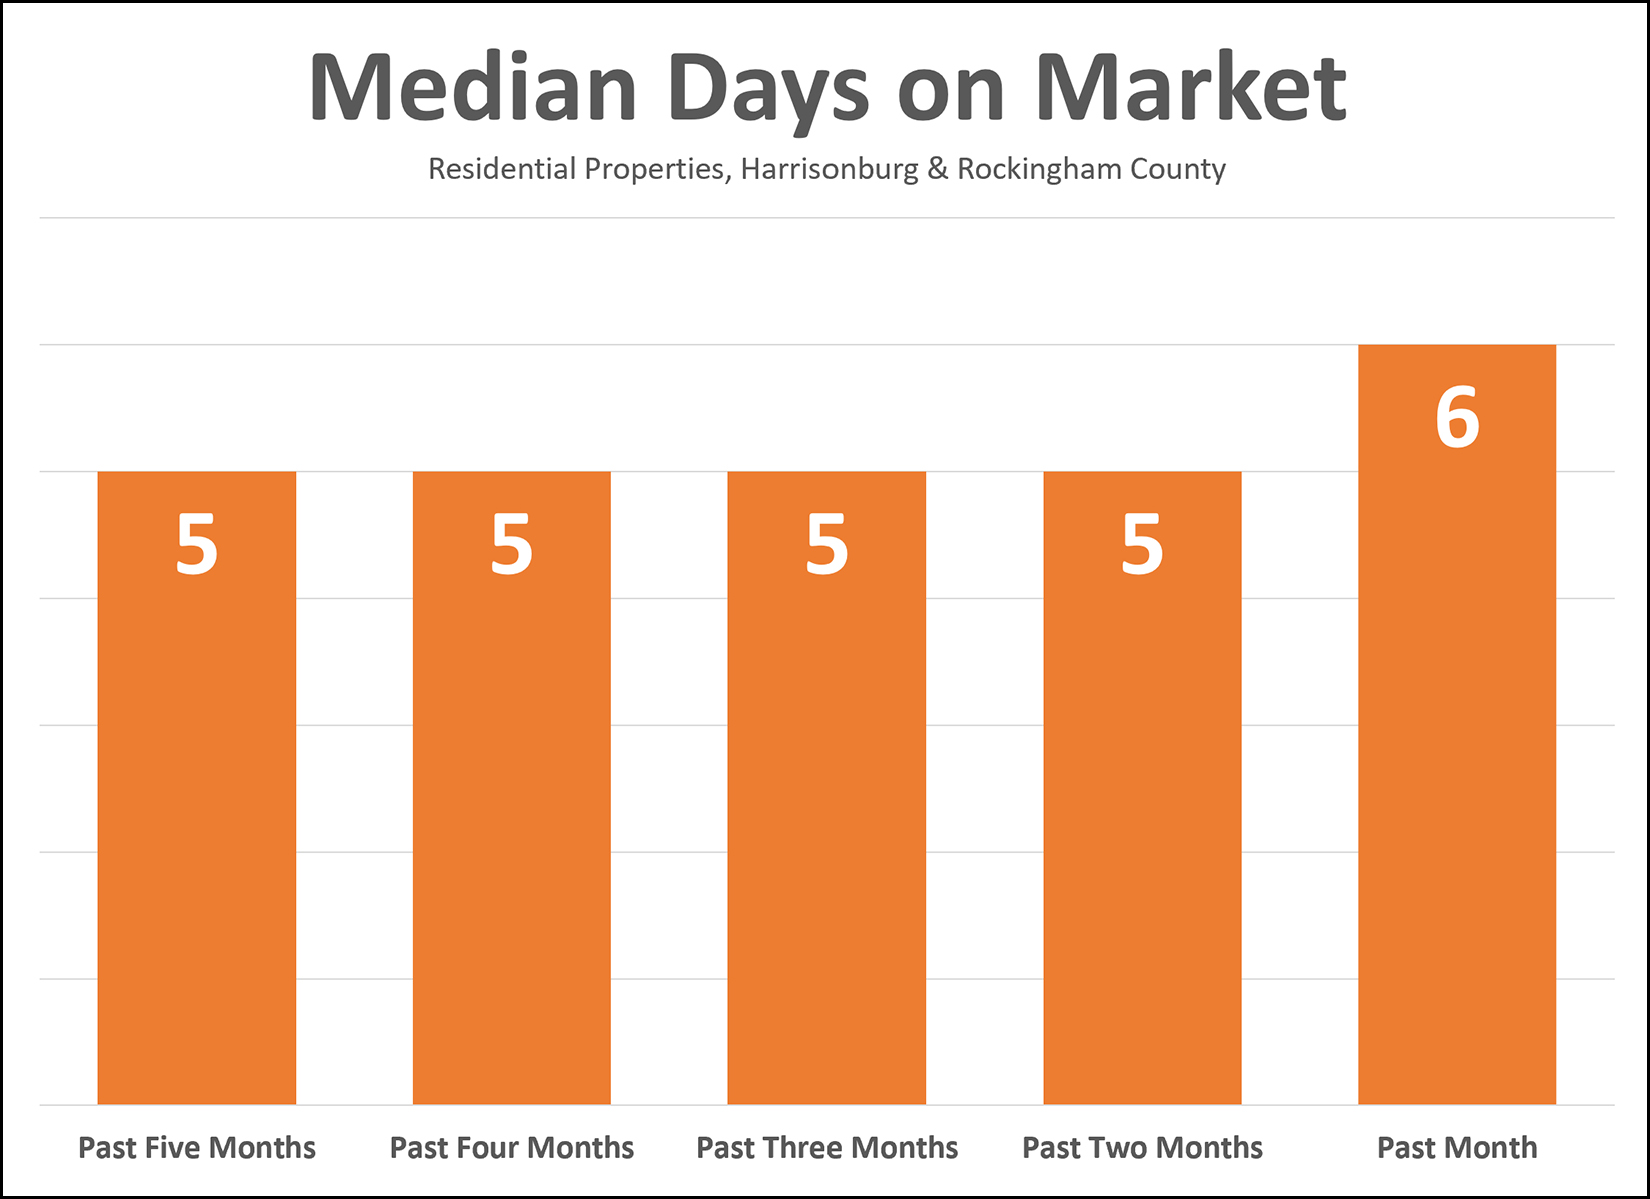 Two years ago the "median days on market" was 15 days in Harrisonburg and Rockingham County. By a year ago, it had dropped to a median of six days on the market. Given that interest rates are rising, I thought perhaps we might be seeing this metric (how quickly homes are going under contract) start to rise in Harrisonburg and Rockingham County. And I was right! Things are SLOWING DOWN! ;-) Wink, wink, nudge, nudge. The graph above starts by looking at the median days on market over the past five months... the median was five days. Then, over just the most recent four months... still a median of five days. Next, over just the past three months, when interest rates started to rise... still a median of five days. Well what about over the past two months... still a median of five days. But, ah ha! I finally found it. The sign the market is really slowing down. The median days on market has increased 20% (!!!!) when we get to that last data point... the median days on market over the past month is... SIX days! :-) So, bottom line, did things go under contract more slowly over the past month than in previous months? Oh, yes, by one day. Is it a sign that the market is slowing? I suppose so. Barely. We'd need to see more of a change than what is described above and shown above to conclude that buyer enthusiasm is measurably declining. Stay tuned to see if that median days on market figure will scrape and claw it's way back up to SEVEN days sometime in the next few months. | |
800 Mixed Income Housing Units Planned For Bluestone Town Center |
|
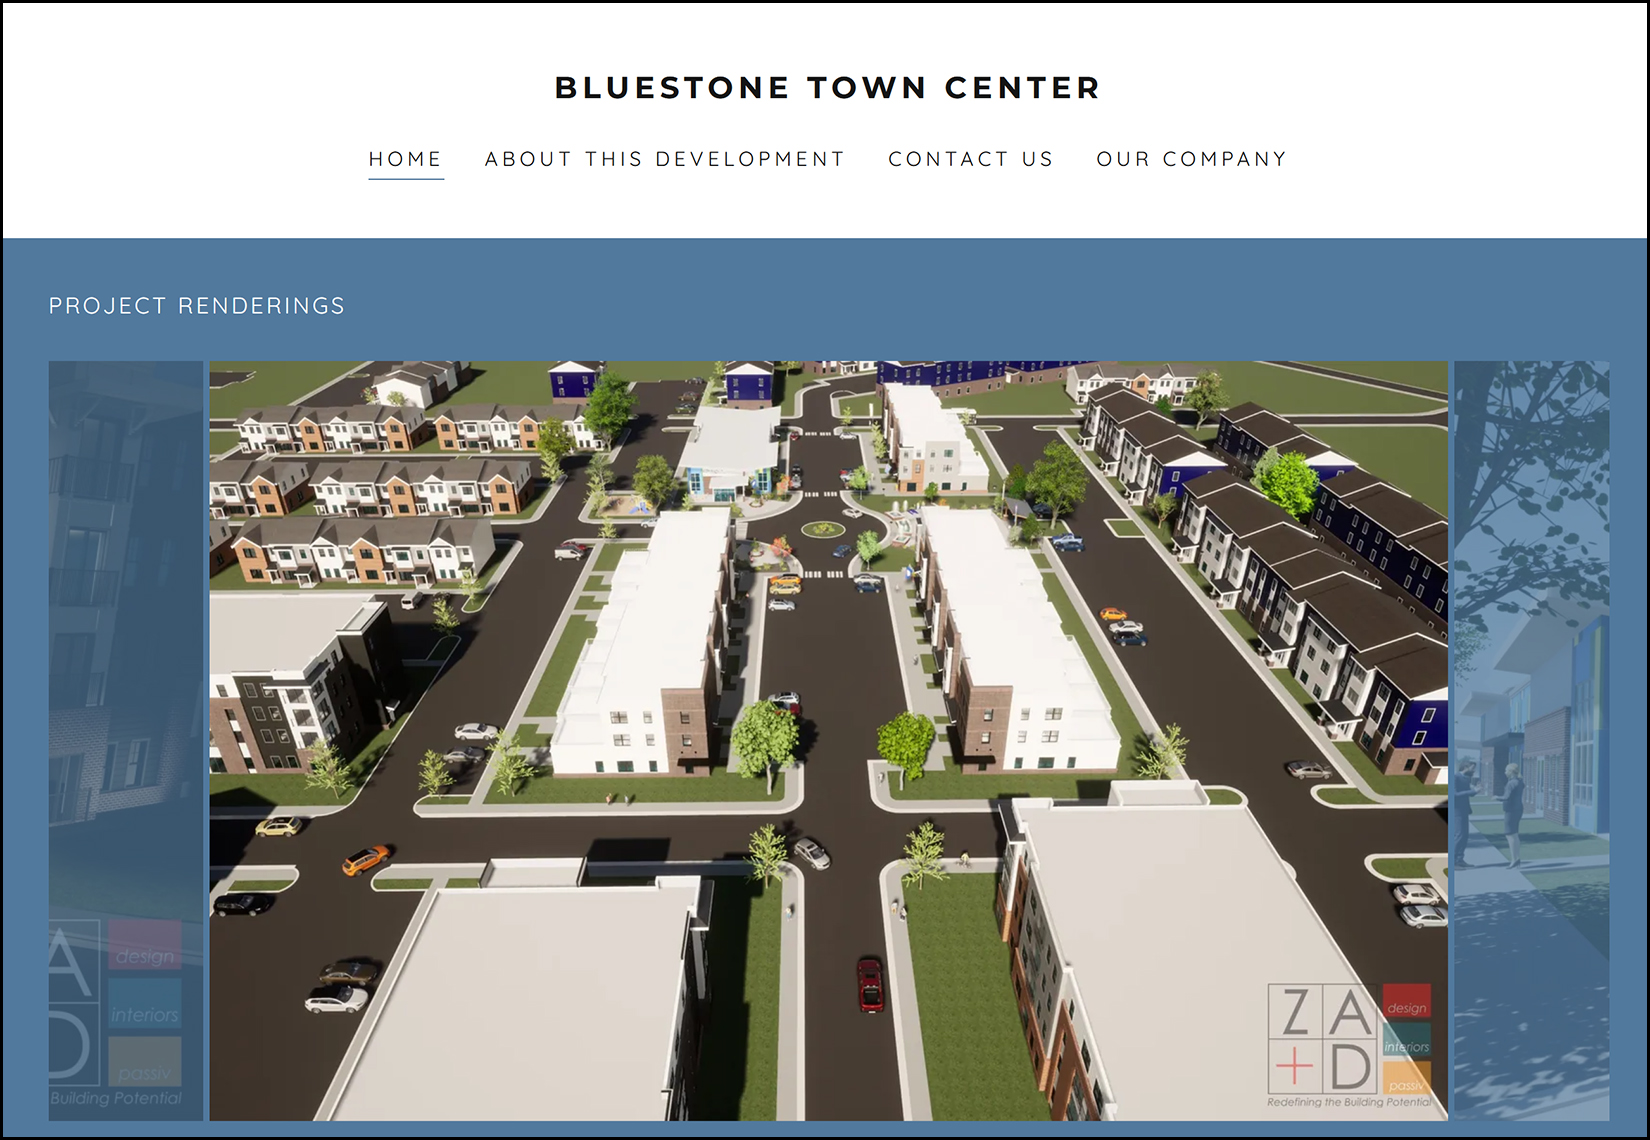
800 (or more) new housing units may soon be coming to Garbers Church Road and Erickson Avenue... at Bluestone Town Center... potentially featuring...
This is a potential joint venture between the Harrisonburg Redevelopment and Housing Authority (not the City of Harrisonburg, but a "political subdivision of Virginia") and Equity Plus (a private entity seemingly out of Mississippi). This potential residential development is intended to offer...
Find out more about this potential development by visiting BluestoneTownCenter.com or by attending the informational session on June 7th (today) from 4:00 PM to 6:00 PM at the Lucy Simms Auditorium. Updated... Daily News Record, June 8, 2022
| |
Renting vs Buying a Townhouse at Congers Creek |
|
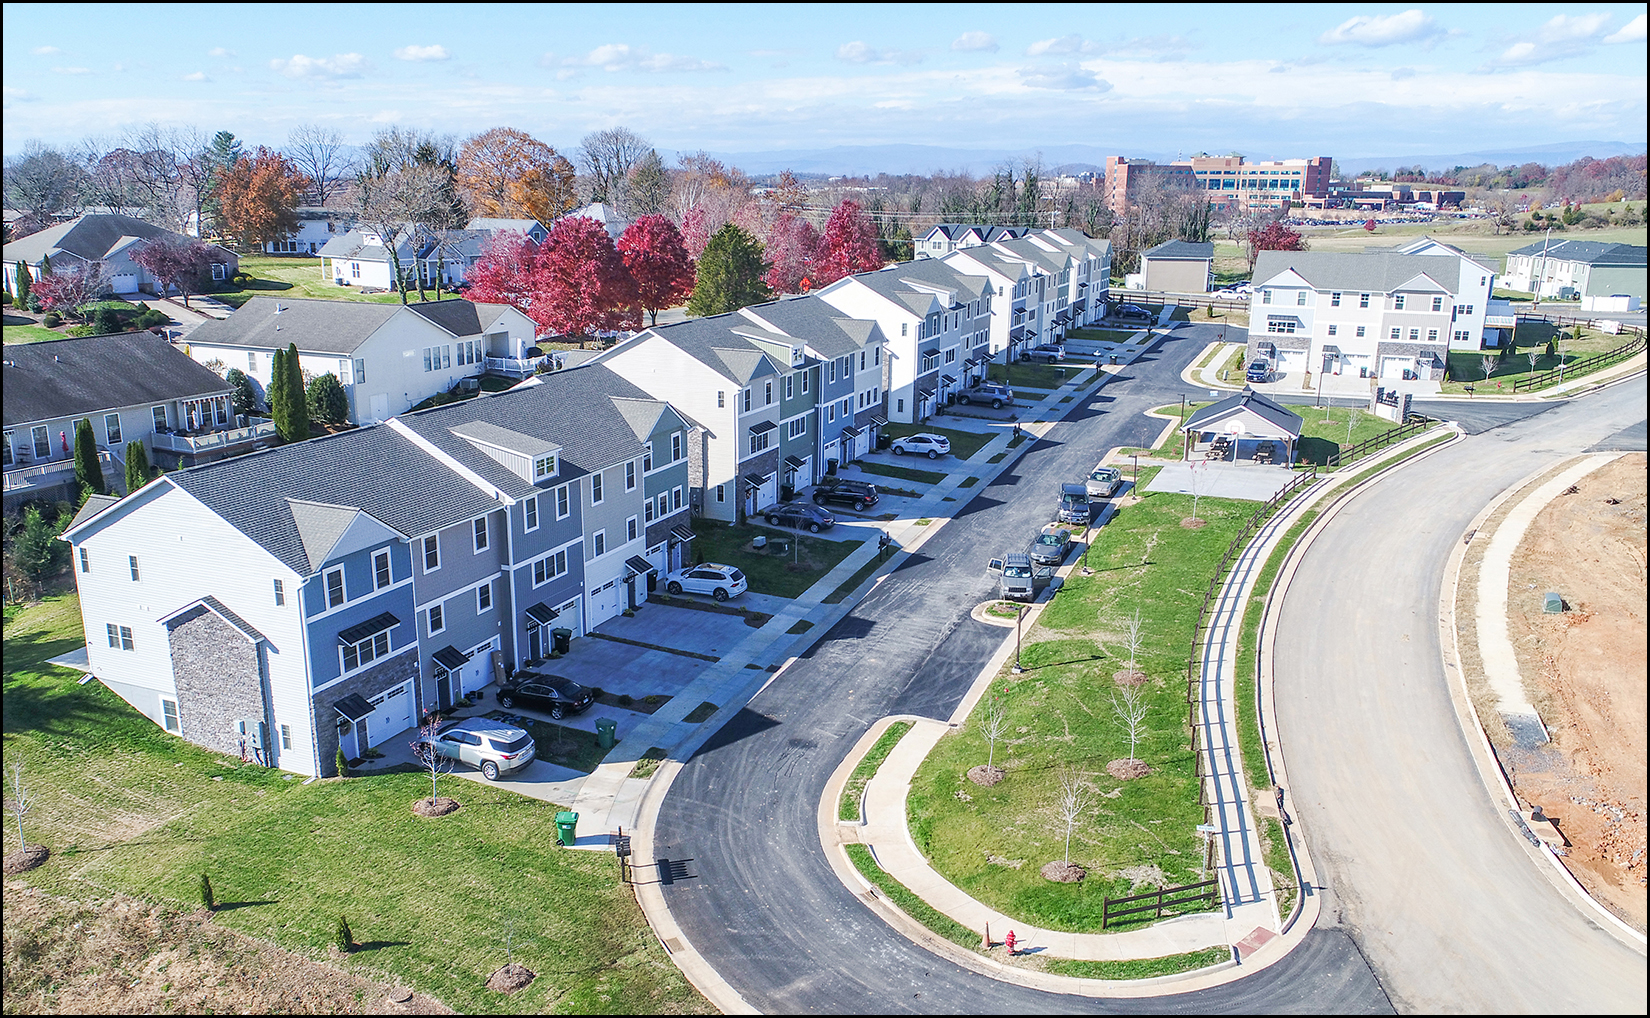 Most of the townhouses at Congers Creek are being purchased by homeowners, but some are being purchased by investors as rental properties... which means you will likely have the opportunity to buy or rent at Congers Creek in the near future. Let's see how those two options compare... RENT = $2,000 / month. The rental rates I have seen thus far at Congers Creek range between $1,950 and $2,200 per month. These rental rates are for a three level townhouse with a garage and (finished or unfinished) bonus room. BUY = $1,785 / month. With a 90% loan, buying such a townhouse apparently may cost as little/much as $1,711 per month assuming a $300K purchase price and a 5.25% interest rate... and when we add the $75/month association fee, we get to $1,785. Total Rental Payments over 5 Years = $120,000 Total Mortgage Payments over 5 Years = $107,100 Principal Reduction of Mortgage over 5 Years = $21,196 Effective Total Housing Payments over 5 Years = $85,904 Savings over 5 Years = $34,096 As you can see, this builds a somewhat compelling case for buying instead of renting if you are going to be living in this potential townhouse for the next five years. A few other factors to keep in mind....
P.S. I represent the builder at Congers Creek. | |
Mortgage Interest Rates Have Been Trending Back Down A Bit |
|
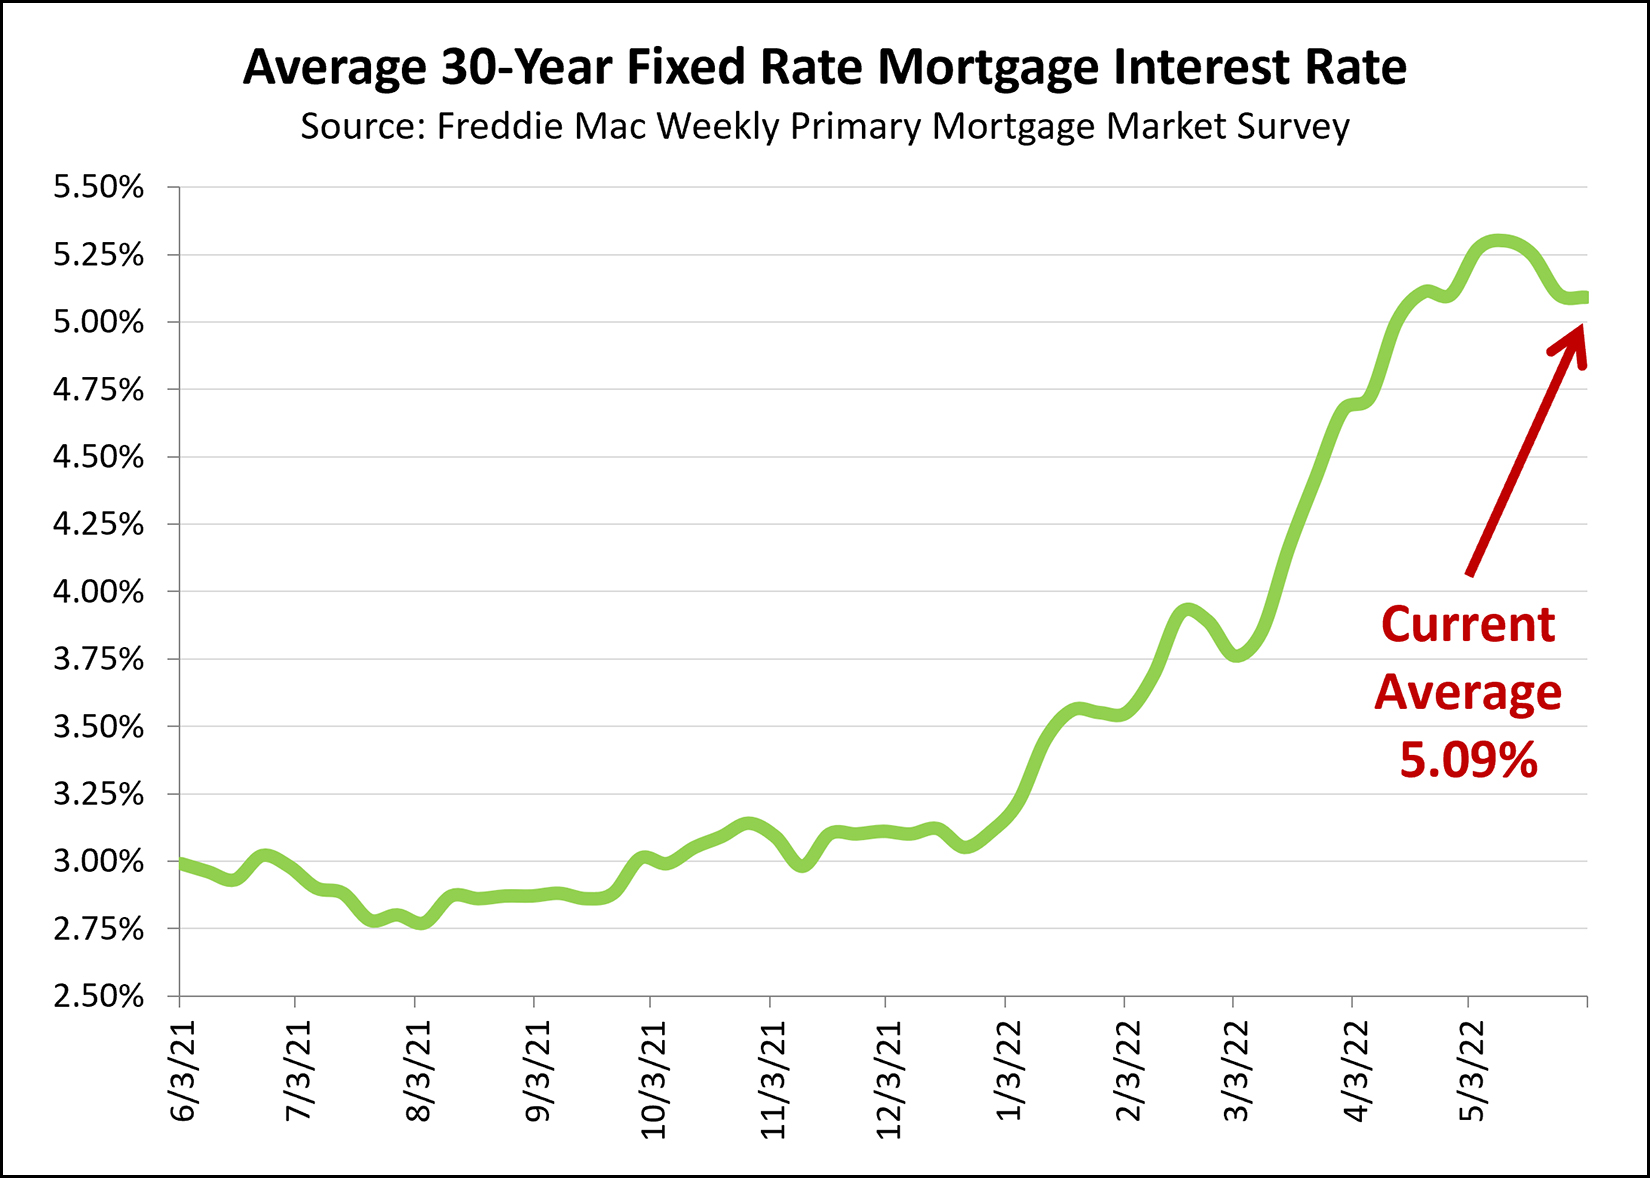 After soaring from 3.2% in January 2022 to 5.3% in May 2022, mortgage interest rates have actually started to level off and even decline in recent weeks. The graph above shows the average 30-year fixed rate mortgage interest rate each week for the past year. Clearly, rates have been rising quickly for the past four to five months... but if you look at the past four weeks, you'll see a different trend. May 12 = 5.30% May 19 = 5.25% May 26 = 5.10% June 2 = 5.09% It is certainly encouraging to see mortgage interest rates leveling out a bit with the potential for sticking right around 5% in coming weeks and months. Certainly, I'd rather today's buyers were able to obtain a 3.5% or 4% mortgage interest rate if possible... but given the possibility of 5%, 5.5%, 6% or even higher, something right around 5% sounds just fine! | |
Strong First Five Months of Contract Activity in 2022 |
|
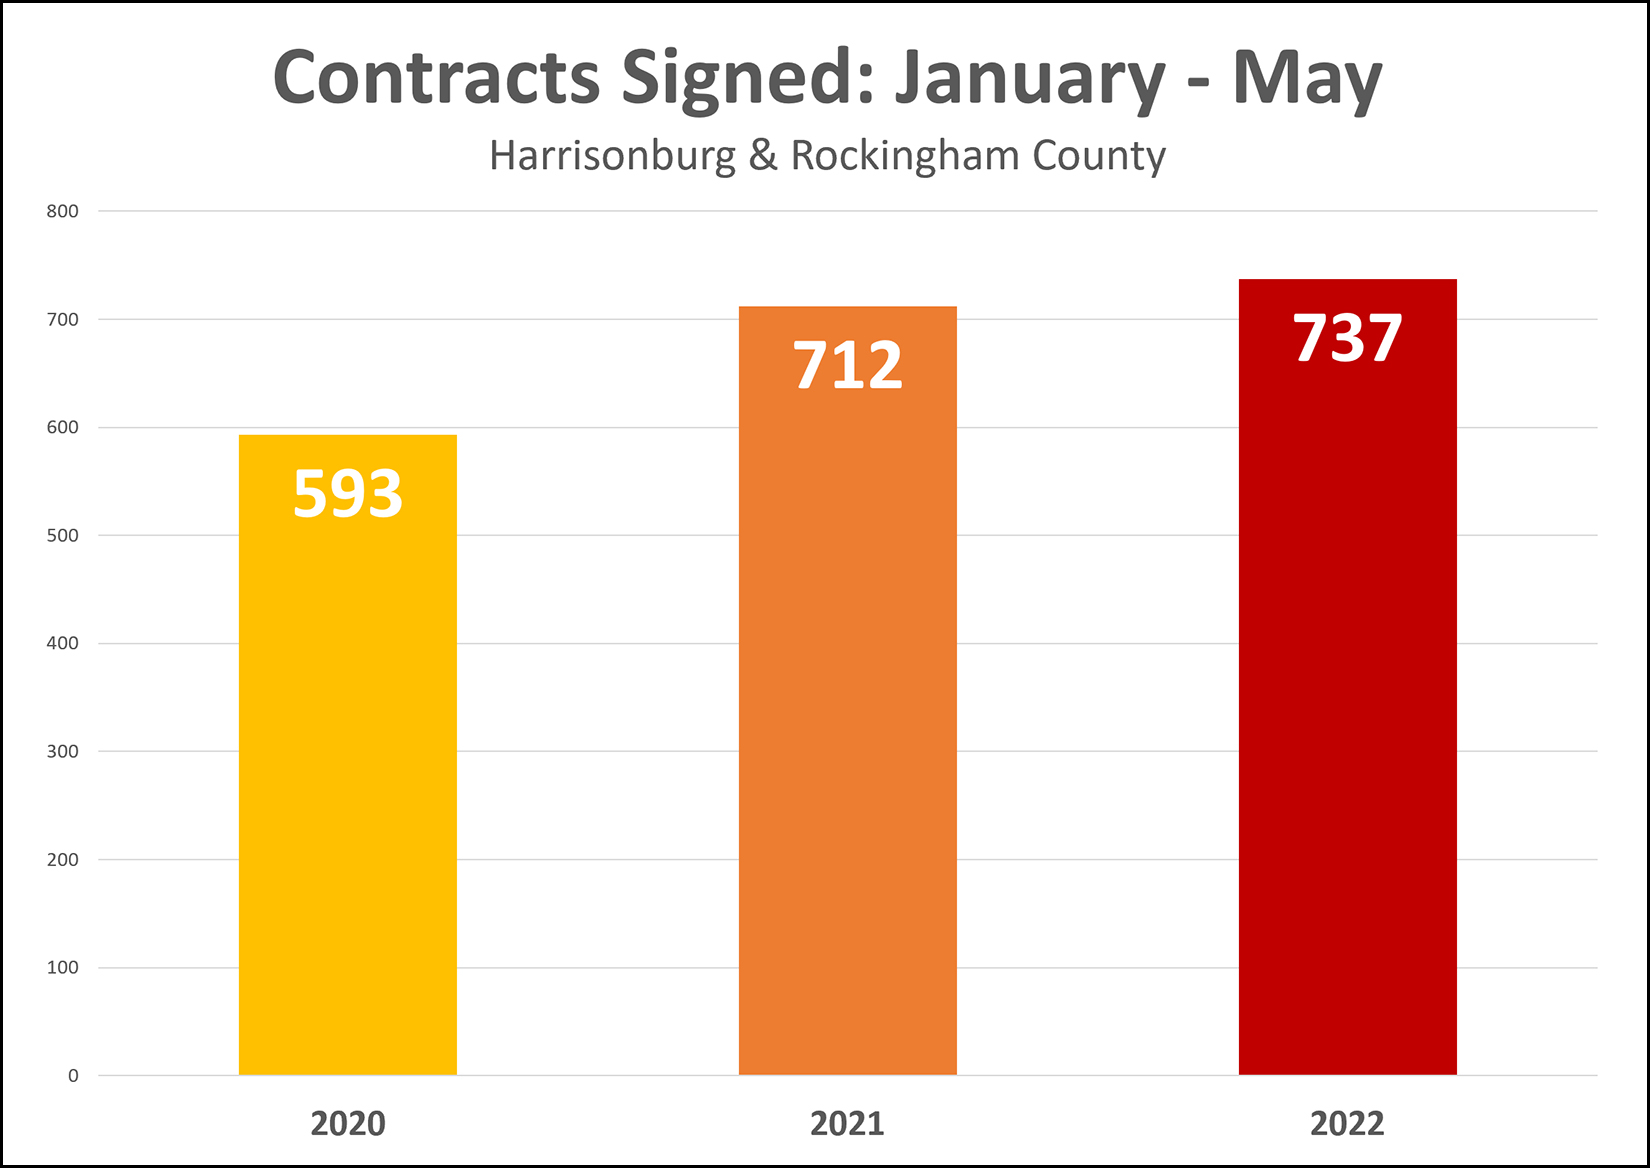 Look out... before you know it, I'll be saying the year is halfway over!? As usual, the months are flying by in 2022 and we are now looking backwards at a full five months of contract (and sales) activity. The graph above illustrates how many buyers (and sellers) have signed contracts to buy (and sell) homes in the first five months of 2020, 2021 and 2022. As you can see, the pace of home buying activity increased quite a bit between 2020 and 2021... and this year, it has increased even further. Higher mortgage interest rates in 2022 might slow down overall home sales activity, but thus far we don't seem to be seeing it here locally. | |
Comparing Tax Bills in the City of Harrisonburg and Rockingham County Over Time |
|
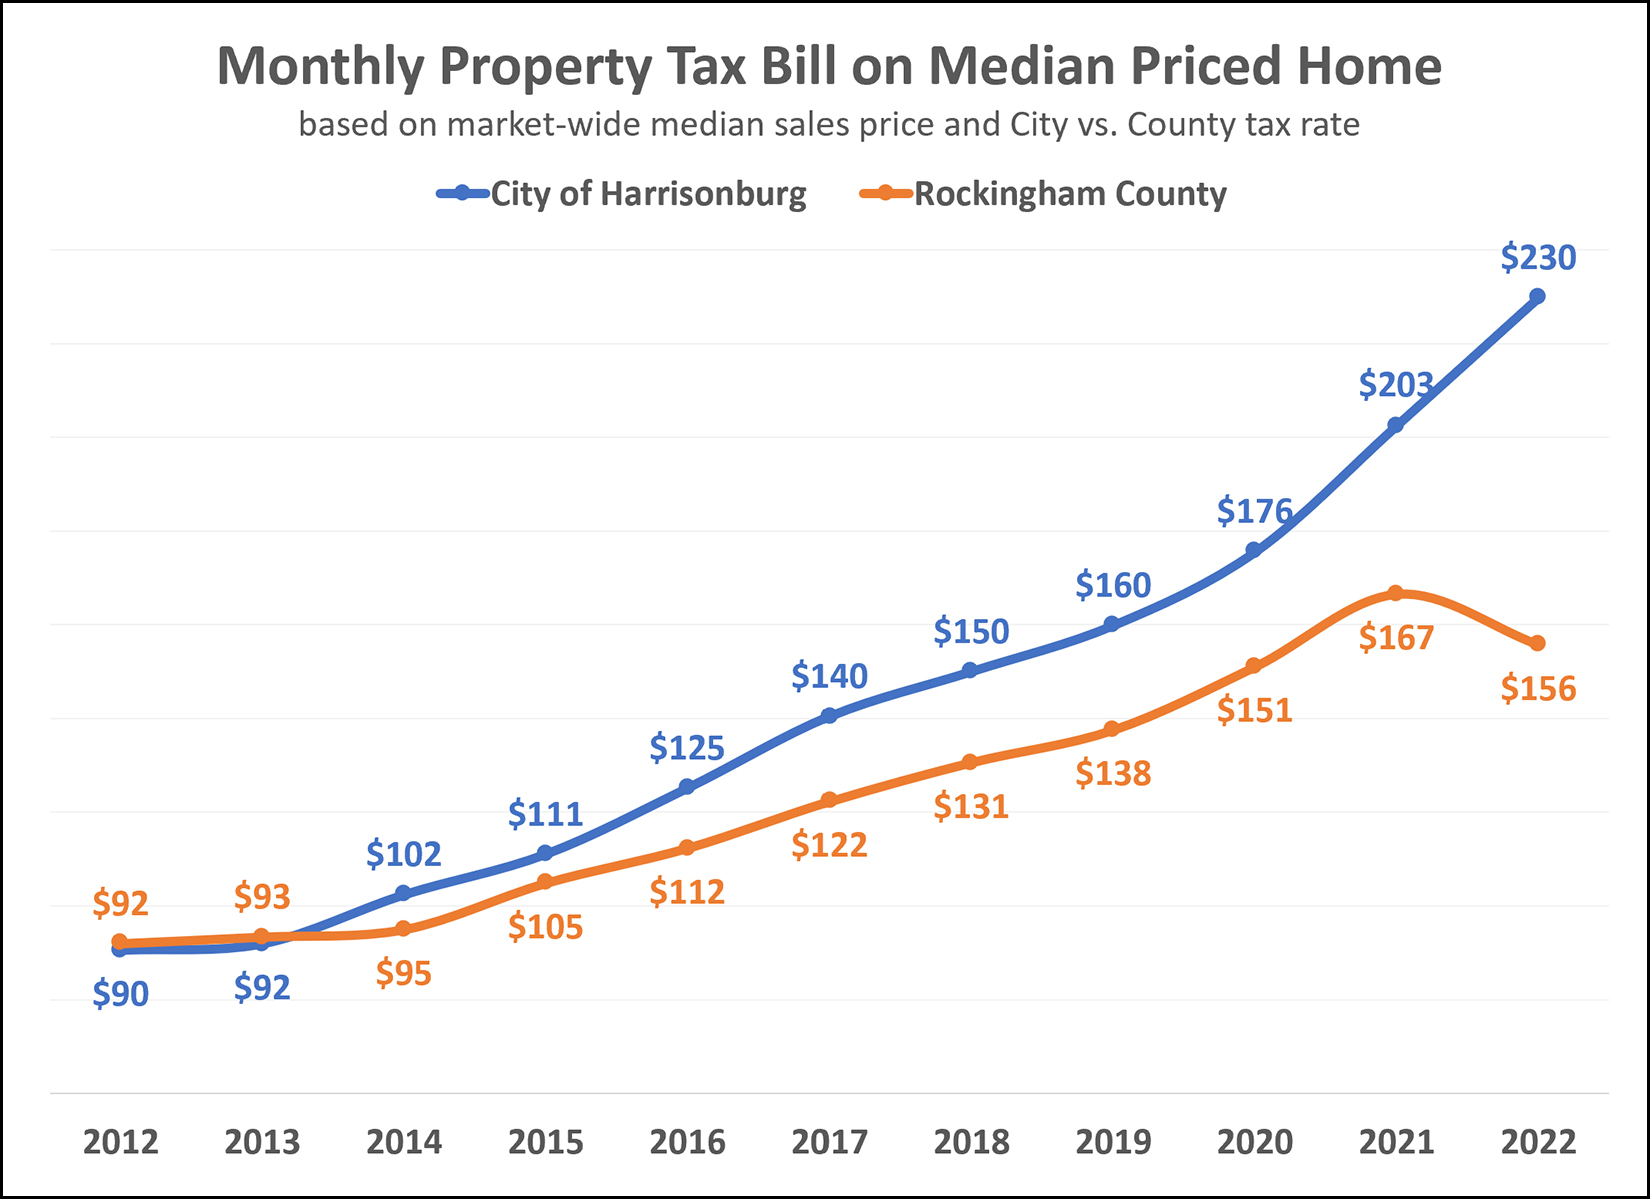 If you're buying a $300K house, will you pay more in property taxes if that house is in the City or the County? In most cases, you will pay more property taxes if you live in the City. The analysis above looks at how a monthly property tax bill has changed over the past decade for a median priced home in the City and County. To be clear, this analysis uses:
As shown above, City property taxes have increased by 155% over the past decade while County property taxes have increased by 70% during the same timeframe. | |
Do You Own A Rental Property? Perhaps You Should Sell It? Pretty Please!? |
|
 If you own a rental property in the City of Harrisonburg or in Rockingham County, perhaps a townhouse or duplex or small single-family home, are you potentially interested in selling it? "Please! Pretty Please!" -- said every owner occupant buyer in the market I understand, there are plenty of reasons why you would not want to do so. Your long-term strategy may be to continue to rent out that property for many years to come, and perhaps you would not want to tax liability that might arise from selling the property, but maybe you have been thinking about selling the property for the past few years.
But... if you have had any thought at all about perhaps selling such a property, now is an excellent time to do so. There is an extreme shortage of available lower-priced homes in the City and County and owner occupant buyers are pursuing such properties quickly and making very competitive offers when they do come on the market. If you would like to explore the possibility of selling a property that you have been renting out for the past few years, let’s talk about timing and logistics. You will likely be selling the property at a very favorable price with very favorable contract terms and you will be helping out the backlog of owner occupied buyers who are desperate to buy a home and settle down in the Harrisonburg area. | |
Will Home Renovations Surge In 2022 and 2023? |
|
 This scenario seems to be very common right now... [1] We decided a year or two ago we wanted to sell our house and move to a bigger or nicer or different house. [2] We've been looking at houses, making offers on houses, but haven't been able to secure a contract on a house. [3] Mortgage interest rates have gone up quite a bit and we are now not sure if we want to trade in our 3.75% rate on our current mortgage (with only 20 years to go) for a new 30 year mortgage at 5.25% or higher. [4] Prices of homes we'd buy have increases significantly since we started looking to buy... and when that is combined with the higher interest rates, it really starts to affect our projected monthly payment. [5] Maybe we should stay in our current house and make some renovations or modifications to allow it to work better for us or to allow us to be more excited about staying for another 10+ years!? Staying and renovating won't be the answer for all buyers who have unsuccessfully tried to buy over the past year or two, but I think it is something more would be buyers will be considering given all of the factors outlined above. | |
Monthly Cost Of Median Priced Home Jumps Much Higher In 2022! |
|
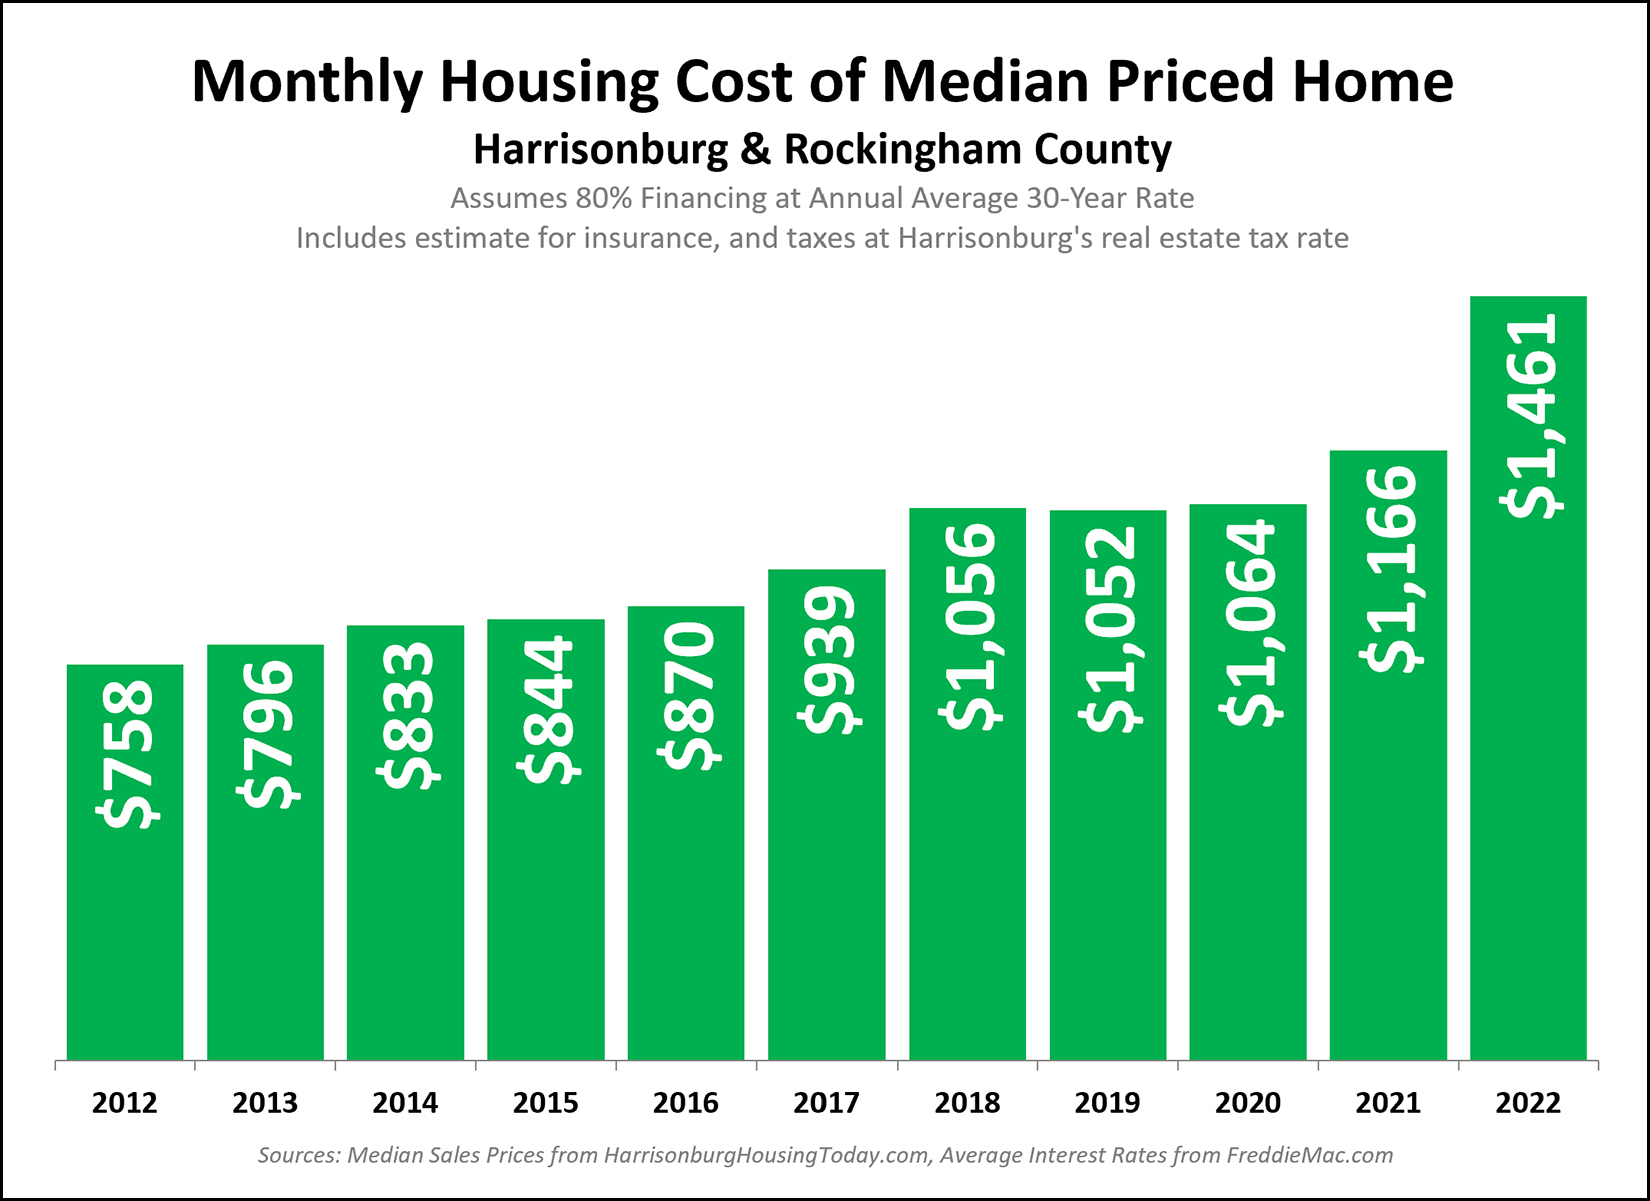 Wow. The monthly cost of a median priced home has jumped quite a bit in 2022! This is related to a variety of changes between 2021 and 2022... [1] The median sales price increased from $270,000 to $296,500. [2] The average mortgage interest rate increased from 2.96% to 4.27%. [3] The City real estate tax rate increased from $0.90 to $0.93. All of these factors, combined, resulted in a rather significant increase in the monthly cost of a median priced home in our local market. | |
Are We Seeing A Big Slow Down In Home Sales Activity Locally? |
|
 If you read much national news you'll see plenty of headlines that say the housing market is slowing down... the housing market peaked... slower times are ahead for housing markets across the country. I'm sure that is all true, generally, nationally, and maybe in many markets. But, real estate is and has also been, local. Will the pace of home sales slow down in our local market? Maybe so. Will prices stop climbing as much as they have been in recent years? Maybe so. Are either of those things happening yet? Are we seeing a big slow down in home sales activity locally? It seems not. Properties going under contract in the past 30-ish days (April 25 - May 24) this year compared to last... Last Year = 170 contracts This Year = 162 contracts If things start changing in our local market, I'll be certain to be writing about it here... but just because you're reading it in the national news doesn't mean it is necessarily happening in Harrisonburg and Rockingham County. | |
Sales of Not New Homes Are Increasing Too |
|
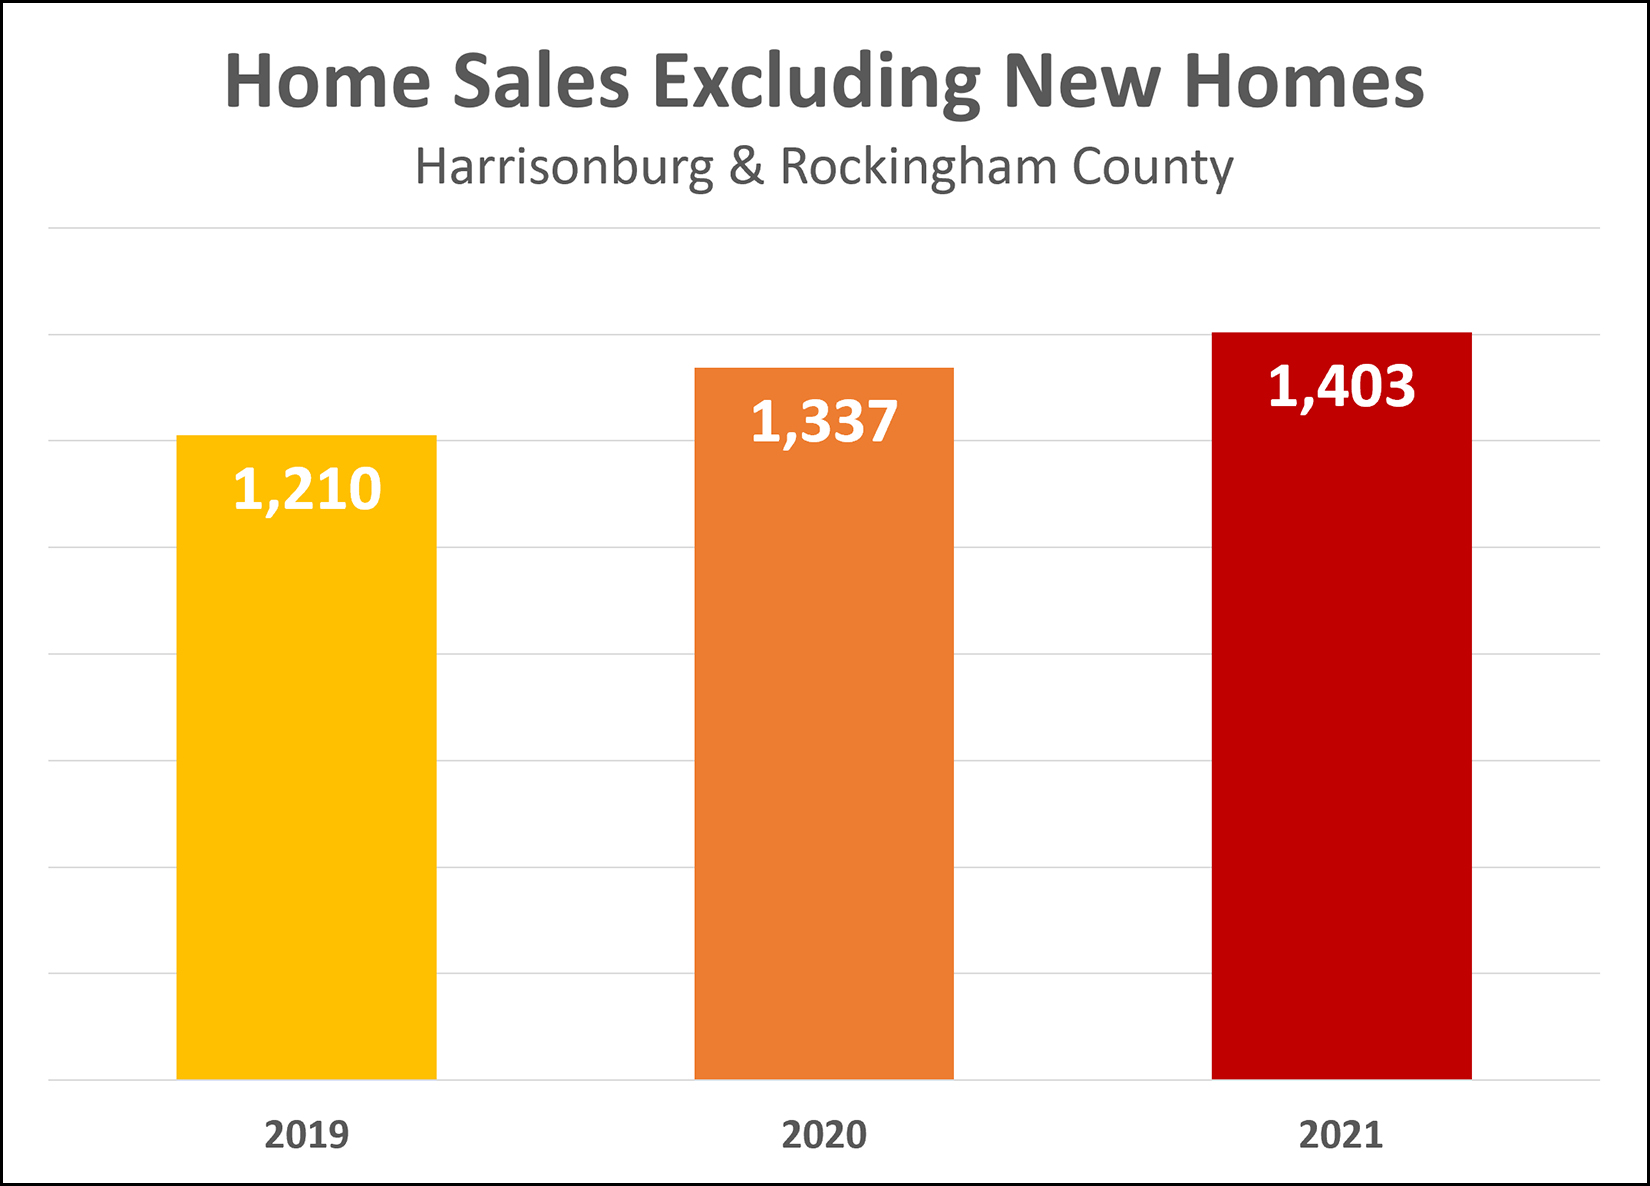 What do we call homes that are not new homes? Resale homes? Used homes? Existing homes? Previously owned homes? :-) Last week I pointed out that we are seeing a rapid increase in the sale of new homes in our market... a 39% increase in 2020 and a 68% increase in 2021. One might have thus wondered if ALL of the increases in our local area home sales can be attributed to new home sales. Well, the answer seems to be... no. As shown above, sales of not-new homes are increasing as well... a 10% increase in 2020 and a 5% increase in 2021. | |
New Home Construction Is Ramping Up in Harrisonburg and Rockingham County |
|
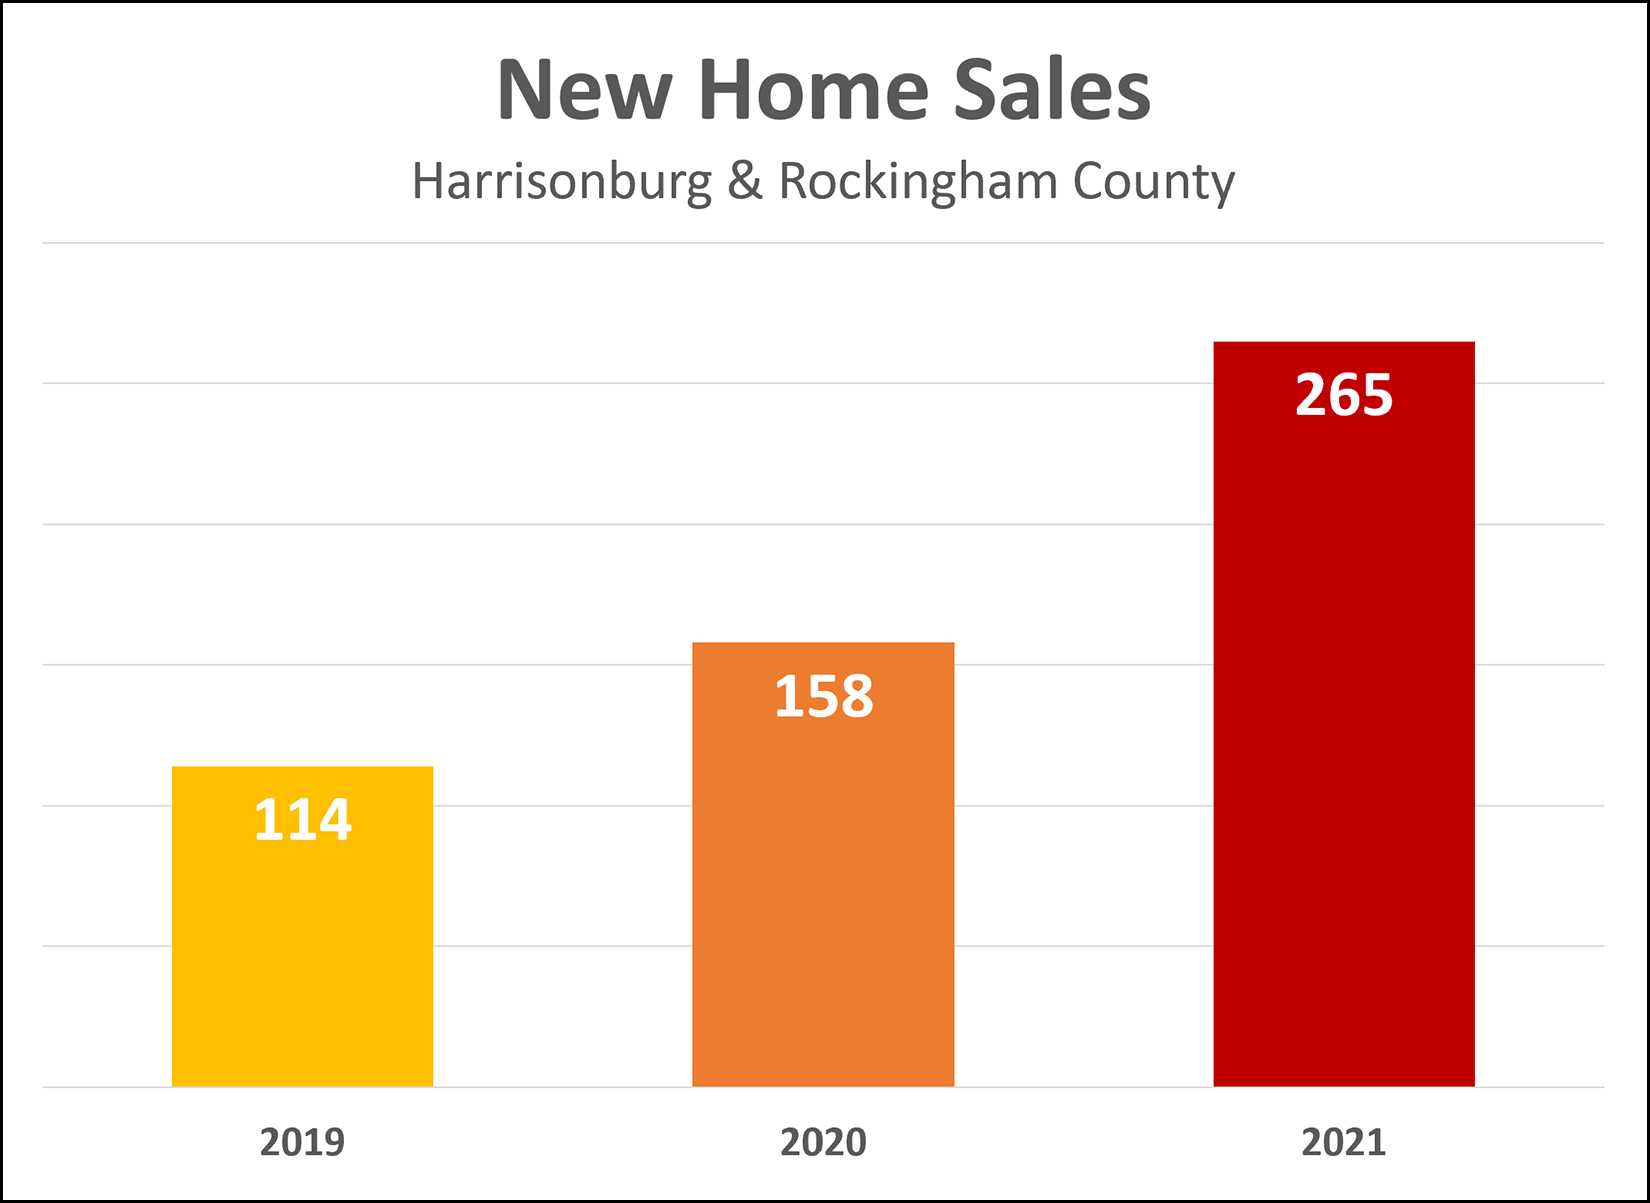 New home sales are on the rise in Harrisonburg and Rockingham County! After a 39% increase in new home sales in 2020, we saw an even larger 68% increase in 2021. What does 2022 have in store when it comes to new home sales? As of 5/19/2022 there have only been 77 home sales thus far this year... but there are 220 new homes under contract! Assuming all of those sell this year, we'd be at 297 new home sales for 2022, before any others that will come on the market in the coming months. New homes being built is one of the only ways we will be able to get out of this low inventory housing market. There are more people who want to live in Harrisonburg and Rockingham County than there are homes to house them. Keep on building, builders, keep on building! ;-) | |
Reflecting On Large, Fast Changes In Mortgage Interest Rates |
|
 For at least the past five years, I have remained convinced that mortgage interest rates would start rising... anytime. But month after month, year after year, interest rates did not rise... instead, they fell. But 2022 has been a bit different. If you had asked me anytime in the past five or ten years what would happen if mortgage interest rates increased from 3% to 5% in the course of just four months, I likely would have told you that the market would likely immediately and significantly slow down... not to a screeching halt... but certainly to a slower pace than before that enormous increase in mortgage interest rates. But, here we are, on the other side of rapidly increasing mortgage interest rates for the past four months, and the market seems to still be, doing pretty similar things to what it was doing before mortgage interest rates started rapidly climbing. Homes are still going under contract very quickly. Buyers are still often competing with multiple offers, including escalation clauses and waiving contingencies. Prices keep climbing. So, have the rising mortgage interest rates had any impact at all on our local housing market? I'd say yes. 1. Some would-be home buyers are no longer able to afford the homes they would like to buy. 2. I think some homes might be receiving two or three offers now instead of six or eight that they might have received before. 3. Some would-be sellers might not be selling after all as they see how their buying budget will be affected by higher mortgage interest rates. So, there have been changes in our local market as a result of these rapidly rising interest rates, they the higher rates have had a much narrower impact than I would have assumed in years gone by. One other point of trivia... the last time the average mortgage interest rate was 5.25% (or higher) was... way back in August 2009... almost 13 years ago! | |
Lake Shenandoah Stormwater Control Authority to Construct New Taylor Spring Detention Basin |
|
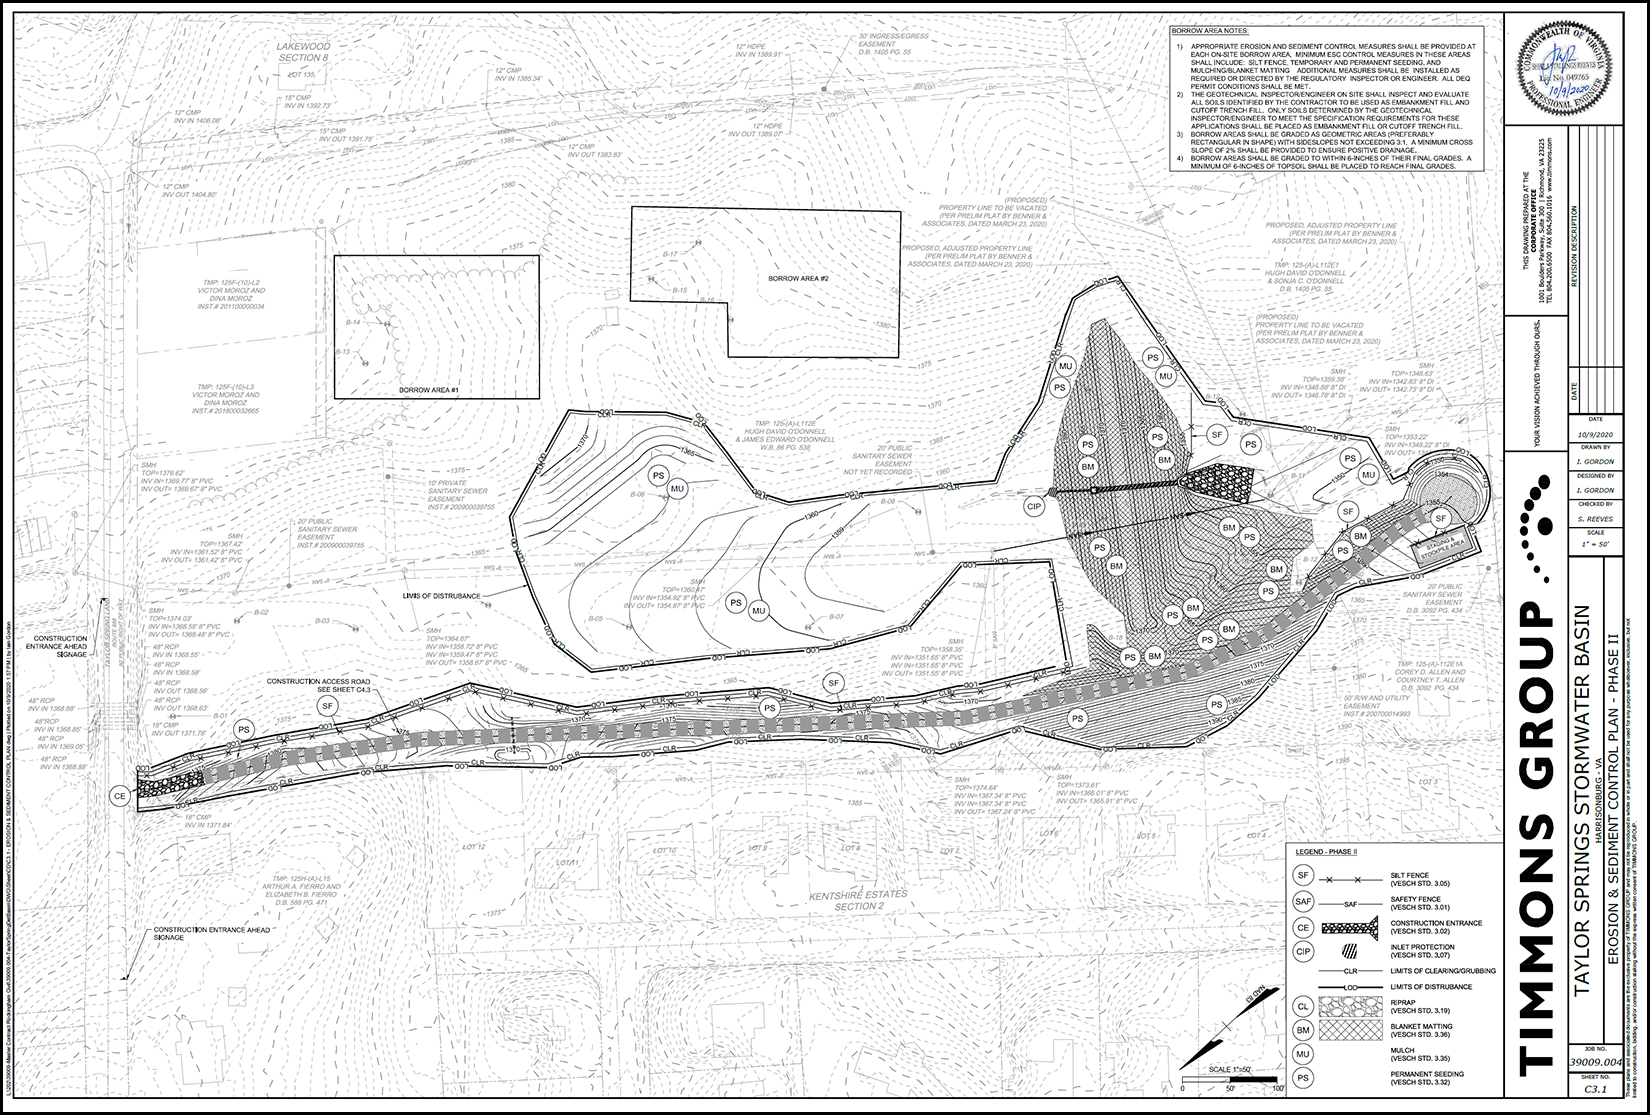
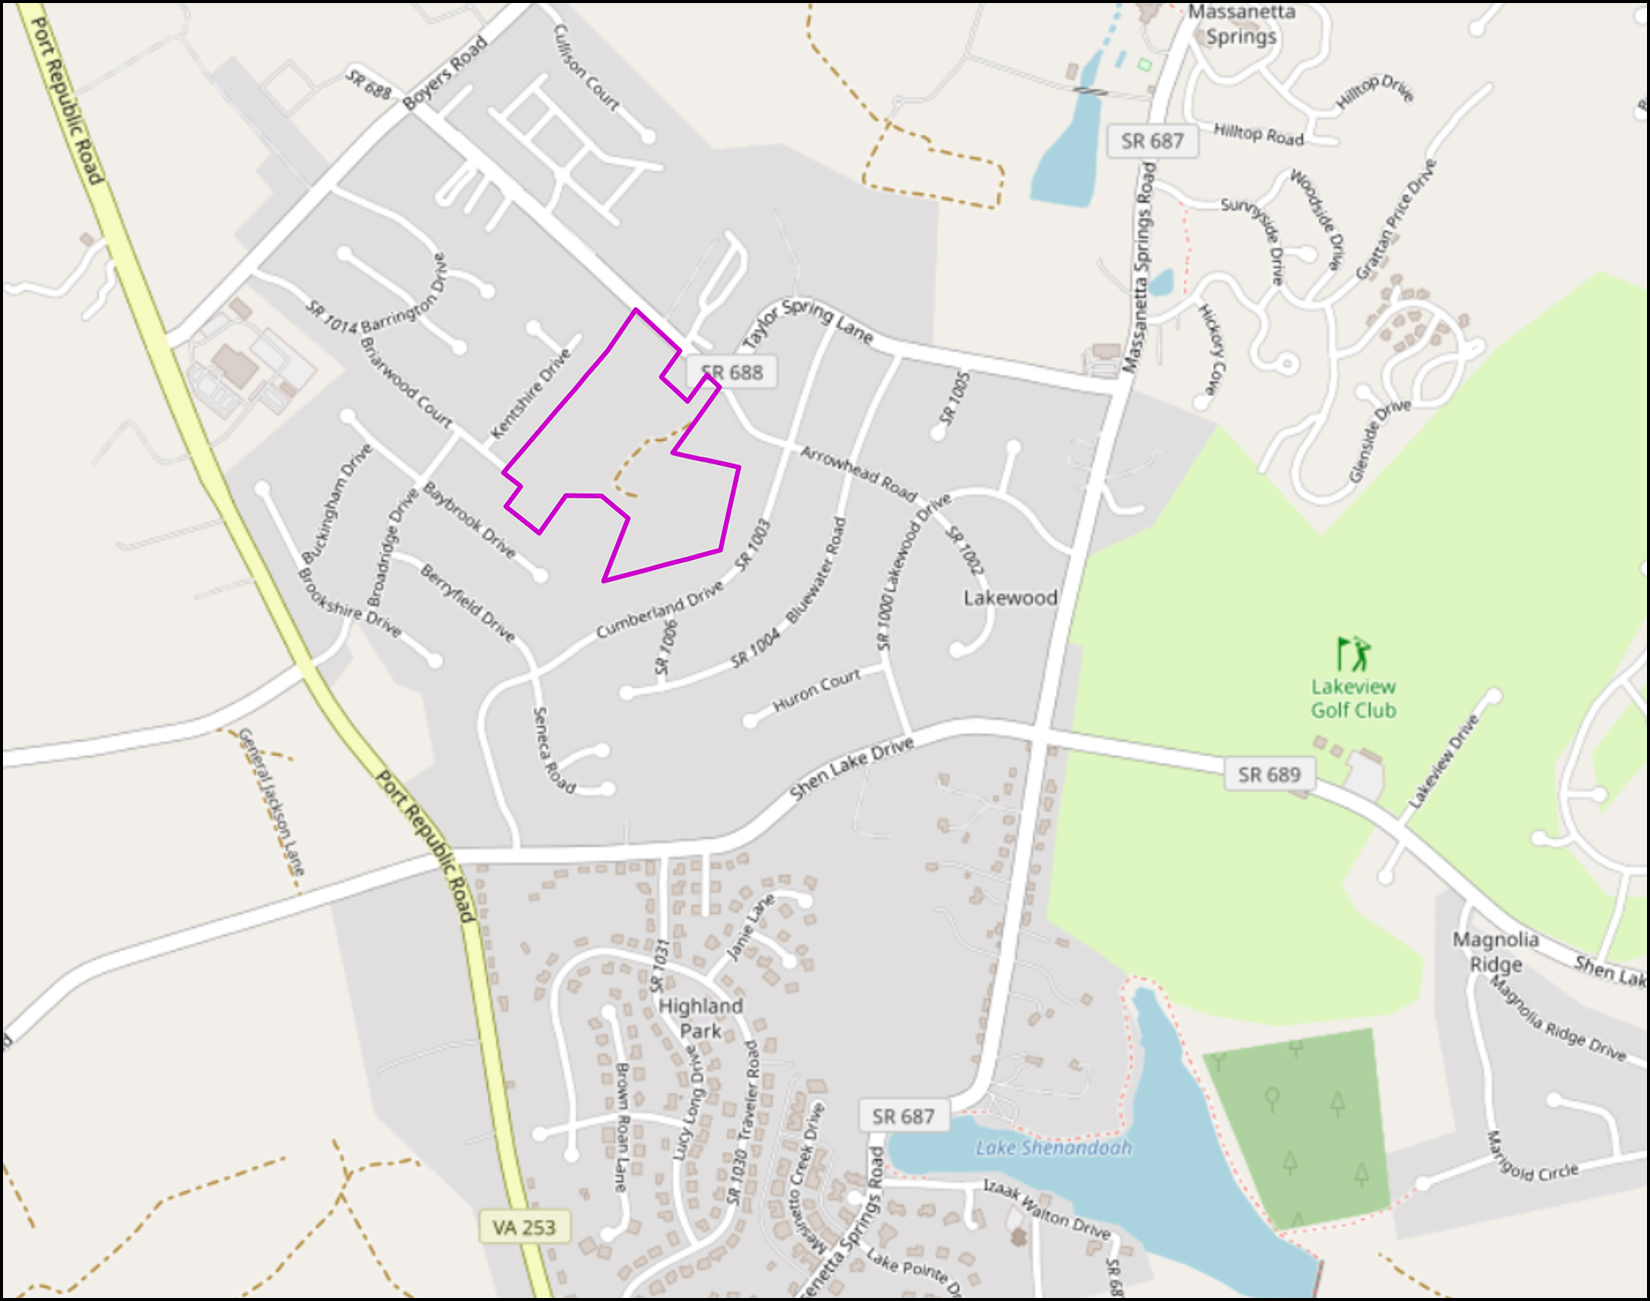 If you live in the Lake Shenandoah Drainage Area you are currently paying an additional tax alongside your real estate tax... with the new tax going to the Lake Shenandoah Stormwater Authority. The tax per property is based on $0.08 per year per square foot of rooftop area and went into effect in December 2020. Also in 2020, Rockingham County purchased a 28.878 acre property within the Lake Shenandoah Drainage Area for use as a stormwater storage area. Now, more details have emerged via an invitation to bid that closes today. Per the government documents, work is to be completed by December 1, 2022. This new stormwater facility will be located on land that is currently undeveloped between Barrington, Kentshire Estates, Lakewood, Taylor Spring and Taylor Grove subdivisions in the area outlined in pink/purple above. View engineering plans for the stormwater facility by clicking the image below... Update 5/26/2022: Rockingham County rejects single bid received | |
It Is Totally OK To Make Fast OR Slow Home Buying Decisions |
|
 The housing market in Harrisonburg and Rockingham County is moving very quickly right now. The median "days on market" is only five days... which means that half of homes are going under contract in five or fewer days.
This fast moving market is largely caused by a supply and demand imbalance. There are more would-be buyers who want to buy than there are would-be sellers who are willing to sell. The fast moving market is resulting in very low housing inventory in just about every price range and location in our market. Given a quickly moving market and very low inventory levels, many would-be home buyers are thus concluding that they will likely need to make a relatively speedy decision about whether to make an offer when they see a new listing of interest. Some buyers, though, might feel like these current market dynamics (low inventory, quickly moving market) are forcing them to make rushed decisions. So, should would-be home buyers feel rushed and forced into making quick decisions? No. It is totally OK for home buyers in this market to make buying (or offering) decisions with whatever speed they would like. It is OK to move quickly in making a decision about an offer - and yes, that will likely increase your odds of being able to secure a contract on a house. It is OK to move slowly in making a decision about an offer - and yes, that will likely decrease your odds of being able to secure a contract on a house. But in the end... you get to decide how quickly you will make decisions about making an offer on a house in the current market. I won’t be rushing you to make decisions more quickly than you are comfortable... and current market dynamics shouldn’t be some external and magical force that rushes you to make a decision more quickly than you are comfortable. Let’s start exploring some houses together that you might want to buy, let’s come to understand the market as we go, and then you can make the decision about how quickly to make an offer based on your comfort level and based on how well any particular house fits your needs. It can be a stressful time to try to buy a home given current market dynamics, but it is totally OK to move at your own speed... whether that is fast or slow... or even if it starts off slow and then speeds up over time. | |
Inventory Levels Have Been Dropping For Almost An Entire Decade |
|
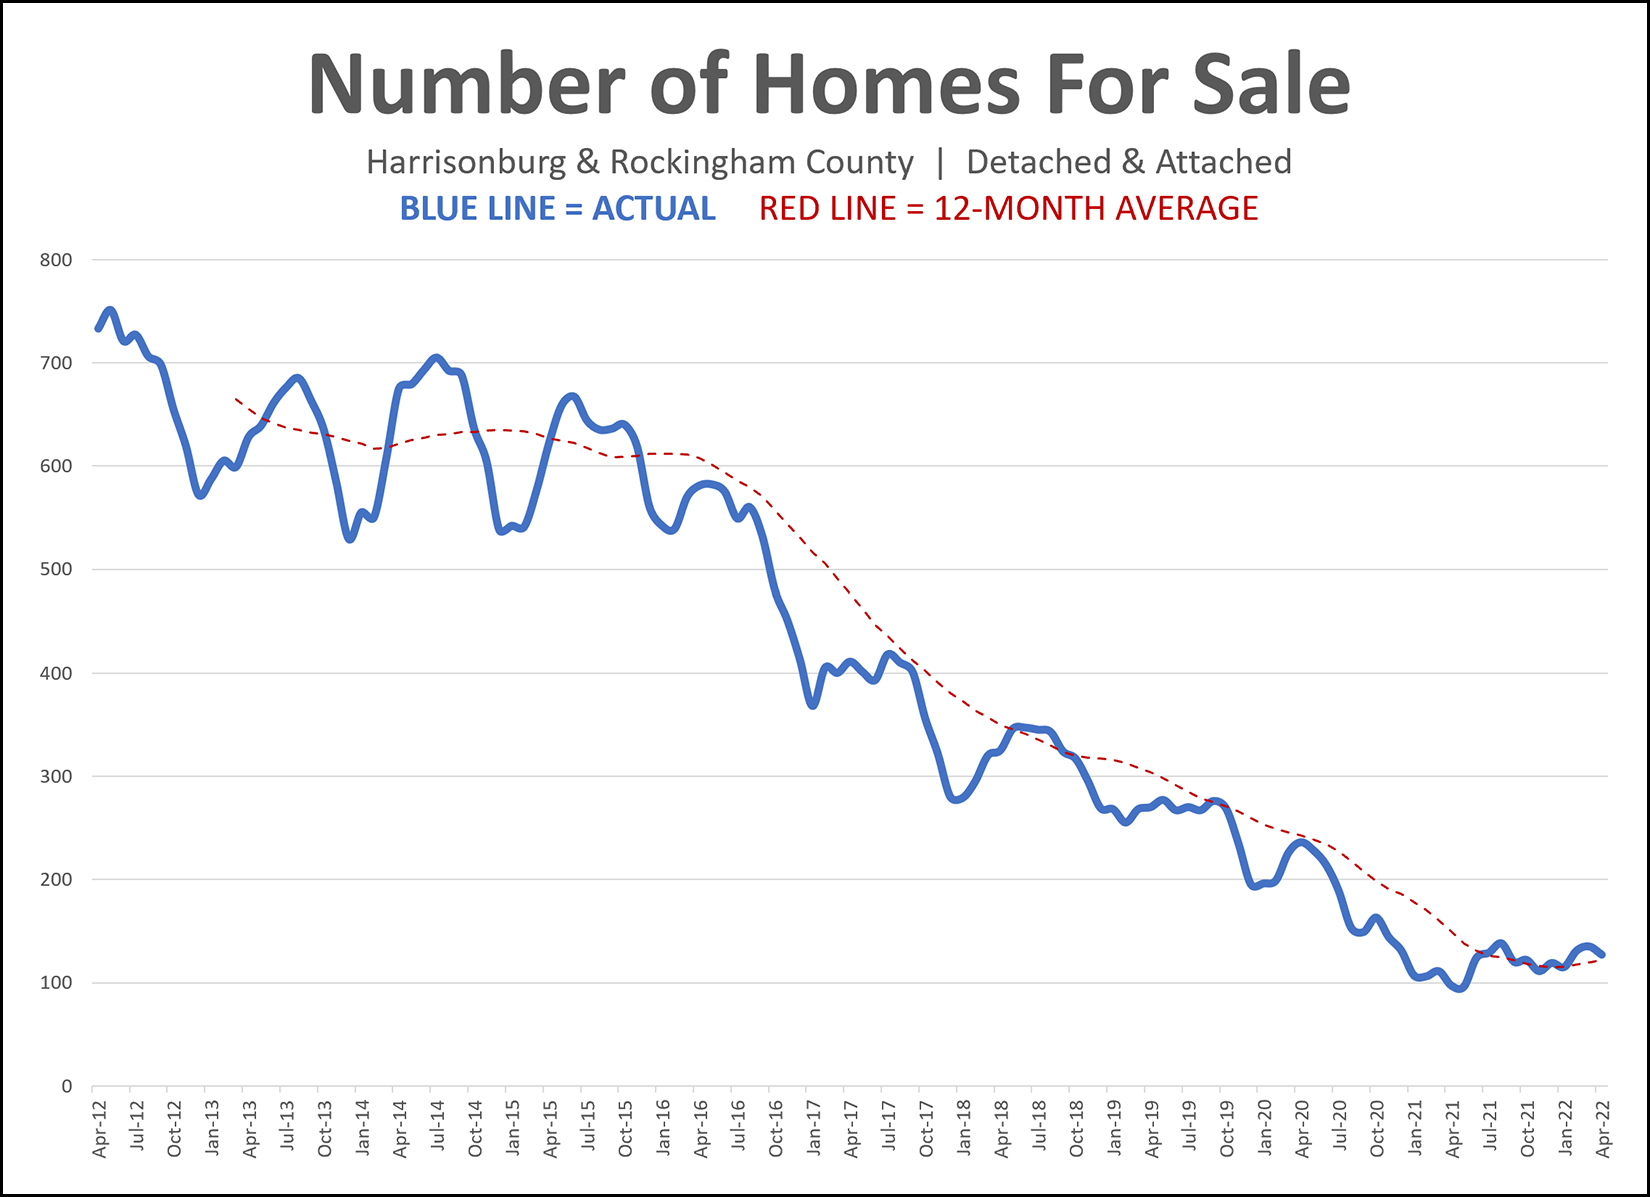 At the end of last month there were only 127 homes for sale in Harrisonburg and Rockingham County. Five years ago, at the end of April 2017, there were 411 homes for sale. Five years before that, at the end of April 2012, there were 733 homes for sale. Home buyers over the past year have had fewer options of what to buy at any given point in time than ever before in the past decade, and possibly ever before, ever. The low inventory levels don't mean fewer buyers are buying -- in fact, more buyers are buying on an annual basis than ever before. The low inventory levels are an indication that there is much more buyer demand than seller supply, so new listings get scooped up (go under contract) within a matter of days -- thus, not contributing to the inventory levels at the end of the month. | |
Home Sales Steady in 2022, Prices Still Rising Quickly! |
|
 Happy Thursday morning, friends! It's definitely spring in the Valley (cool mornings, warmer afternoons, lots of rain, lots of sun) and spring is a busy time for many! Busy times in the Rogers household these days include college visits with Luke, baseball games for Luke and track meets for Emily...  Whatever has you running around this spring, I hope you are enjoying all that this season in the Shenandoah Valley has to offer and are finding opportunities to spend time outdoors (ok, or indoors!?) with family and friends. Before I get started on this month's market report, a few notes.. My Favorite Spots... Each month in this space I highlight one of my favorite spots to enjoy a meal, a cup of coffee, or as with this month, an experience. One of my favorite summer experiences is heading down to Natural Chimneys Park in Mt Solon for great music in the great outdoors at the Red Wing Roots Music Festival... a super relaxing and family friendly music festival featuring 40+ musical artists on five stages over three days, with great food, and activities for all, including camping, fun runs, bike rides, yoga, dancing and much more! Have you considered going to Red Wing but perhaps haven't been yet? Maybe this summer is the time for you to make it one of your favorite family traditions. I am looking forward to being there with my family and I'm hoping you'll join in on the fun... from June 24th through 26th. If you're interested in going to Red Wing, and haven't purchased your tickets yet, I'm giving away a pair of three-day general admission tickets. Click here to enter! I'll pick a winner in about a week. If you don't win, you still better come to Red Wing... and you can buy tickets here. Download All The Charts & Graphs... Looking for ALL the numbers and charts and graphs? Download a full PDF of my market report here. Now, then, let's take a look through some of the graphs together to see what we can learn... 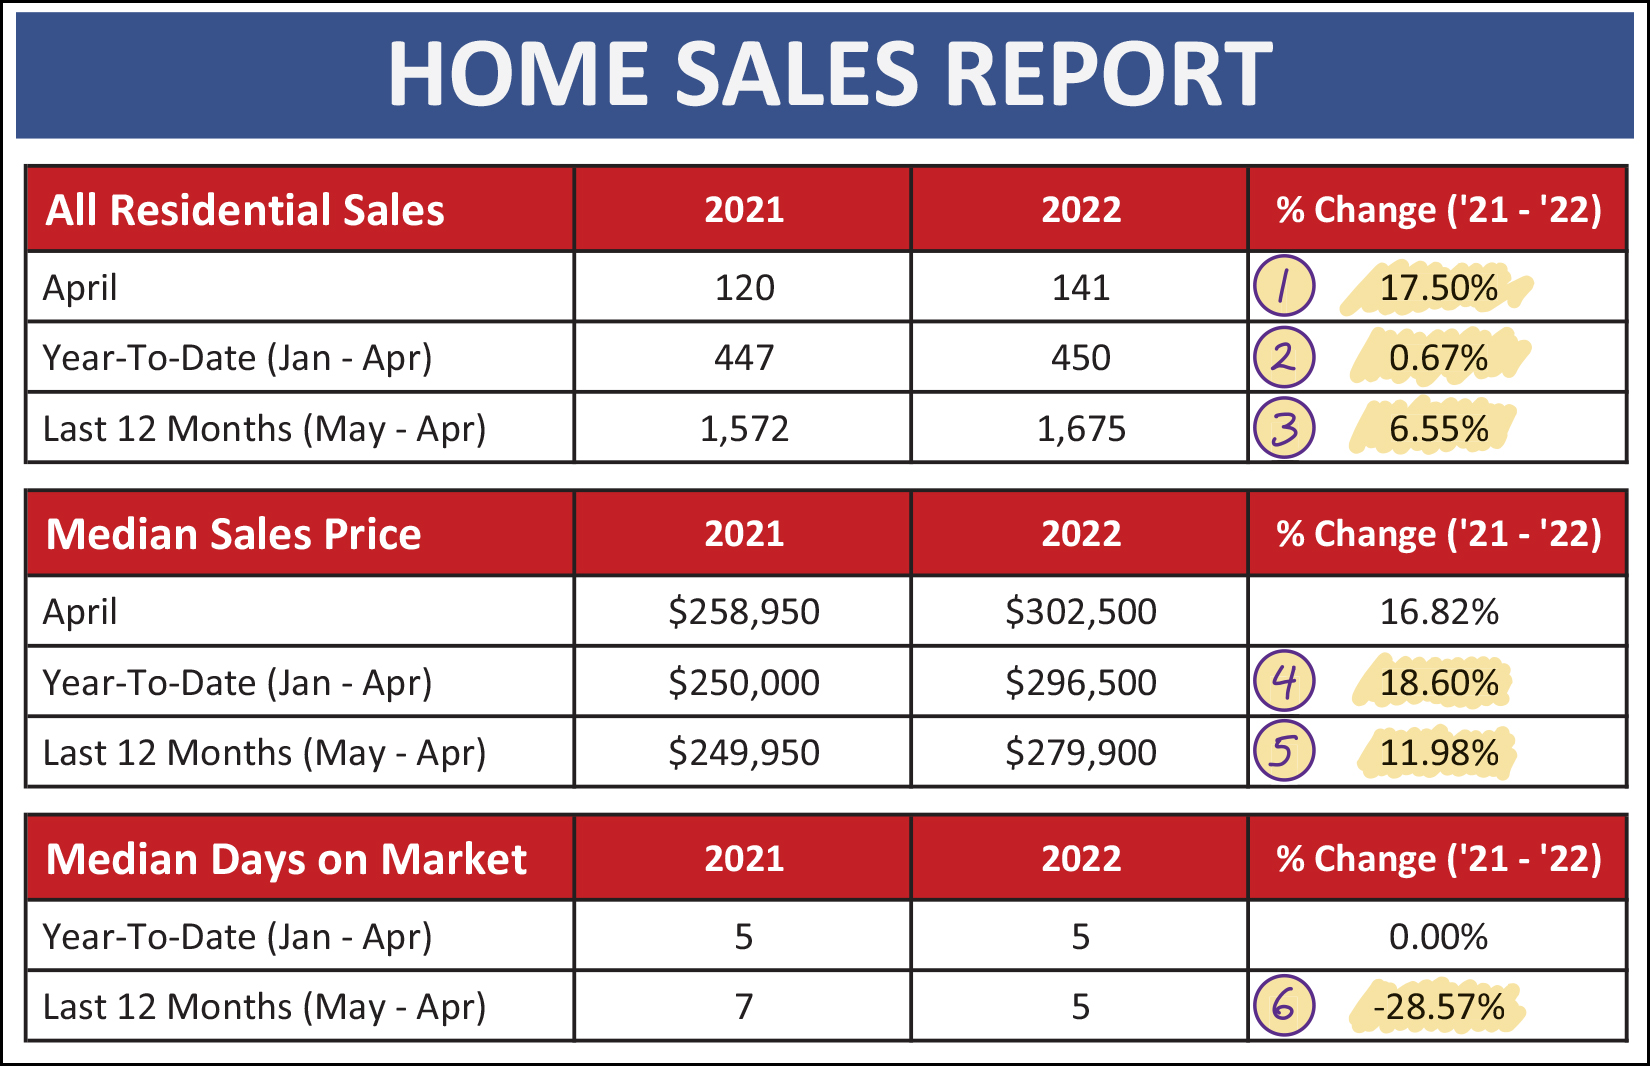 Above you'll find many of the main market metrics I'm evaluating each month and there is plenty to note this month, with my notes below lining up with the numbers above... [1] We saw quite a few more sales this April than last April.. After only 120 last April, there was a 17.5% increase this April. As you may recall, March home sales were a bit slow this year, which caused some to wonder if the market was cooling off. Well, maybe it's not ready to cool off yet because April sales were hot, hot, hot! [2] Looking back at the first four months of the year there have been 450 home sales, compared to 447 sales during the same timeframe last year. Thus, home sales activity is tracking very similarly to how things looked a year ago. [3] If we broaden our view a bit more, to a 12-month window, we'll find that there have been 1,675 home sales over the past 12 months... compared to only 1,572 in the 12 months prior to that. Thus annual home sales activity has increased 6.55% over the past year. [4] The changes in sales prices over the past year is still somewhat staggering. The median price in the first four months of 2022 is 18.6% higher than it was in the first four months of 2021! [5] Again looking at a longer timeframe, the median sales price over the past 12 months has been 12% higher than during the 12 months before that. Sales prices are increasing quickly in our area! [6] Homes are selling faster, and faster, and faster yet. The median days on market over the past year has been five days, which is 29% faster than the seven day median in the 12 months before that. Wow! So, about the same number of homes are selling as last year... but at much higher prices... and more quickly! These quickly rising prices have caused to market metrics to pop over major (psychological) thresholds over the past 12 months... 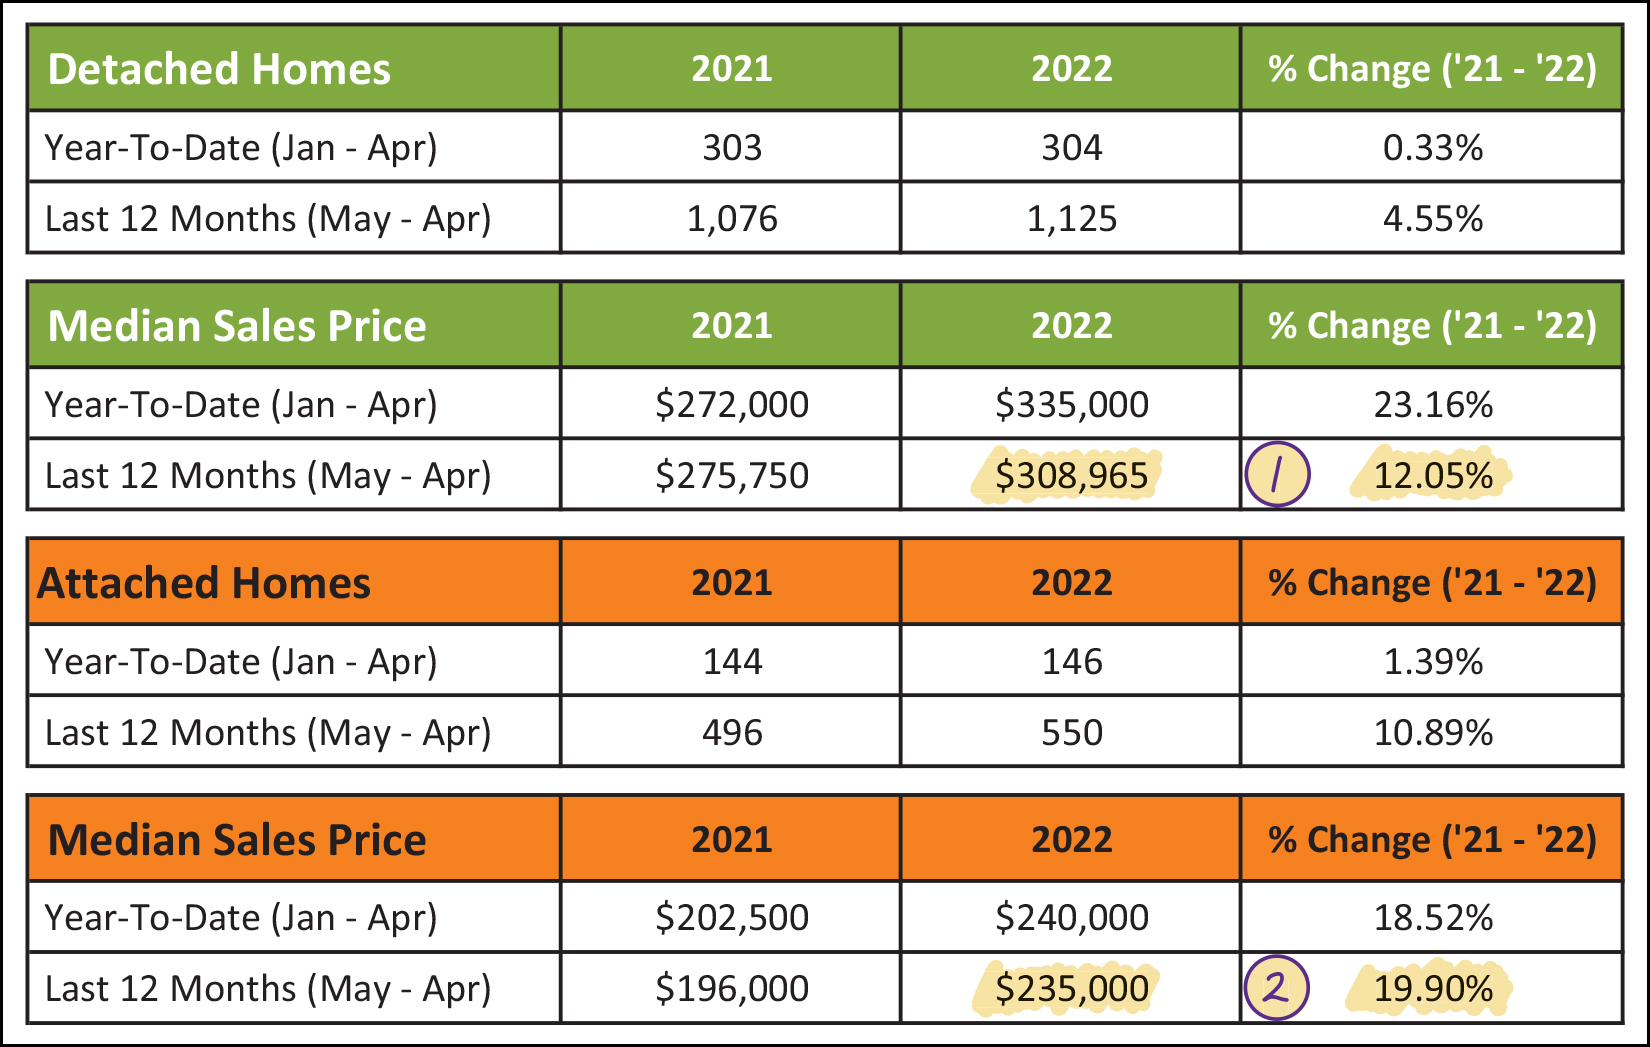 [1] A year ago, the median sales price of a detached home was under $300K... at only $276K... and now it has risen above $300K to $309K. That is to say that half of detached homes that are selling in Harrisonburg and Rockingham County are priced at or over $309K. [2] A year ago, the median sales price of attached homes was under $200K... at only $196K... and now it has risen above $200K to $235K. That is to say that half of the attached homes that are selling in Harrisonburg and Rockingham County are priced at or over $235K. The times, they are a changing! Prices keep rising! Diving back into the details a bit, April was another surprisingly strong month of home sales... 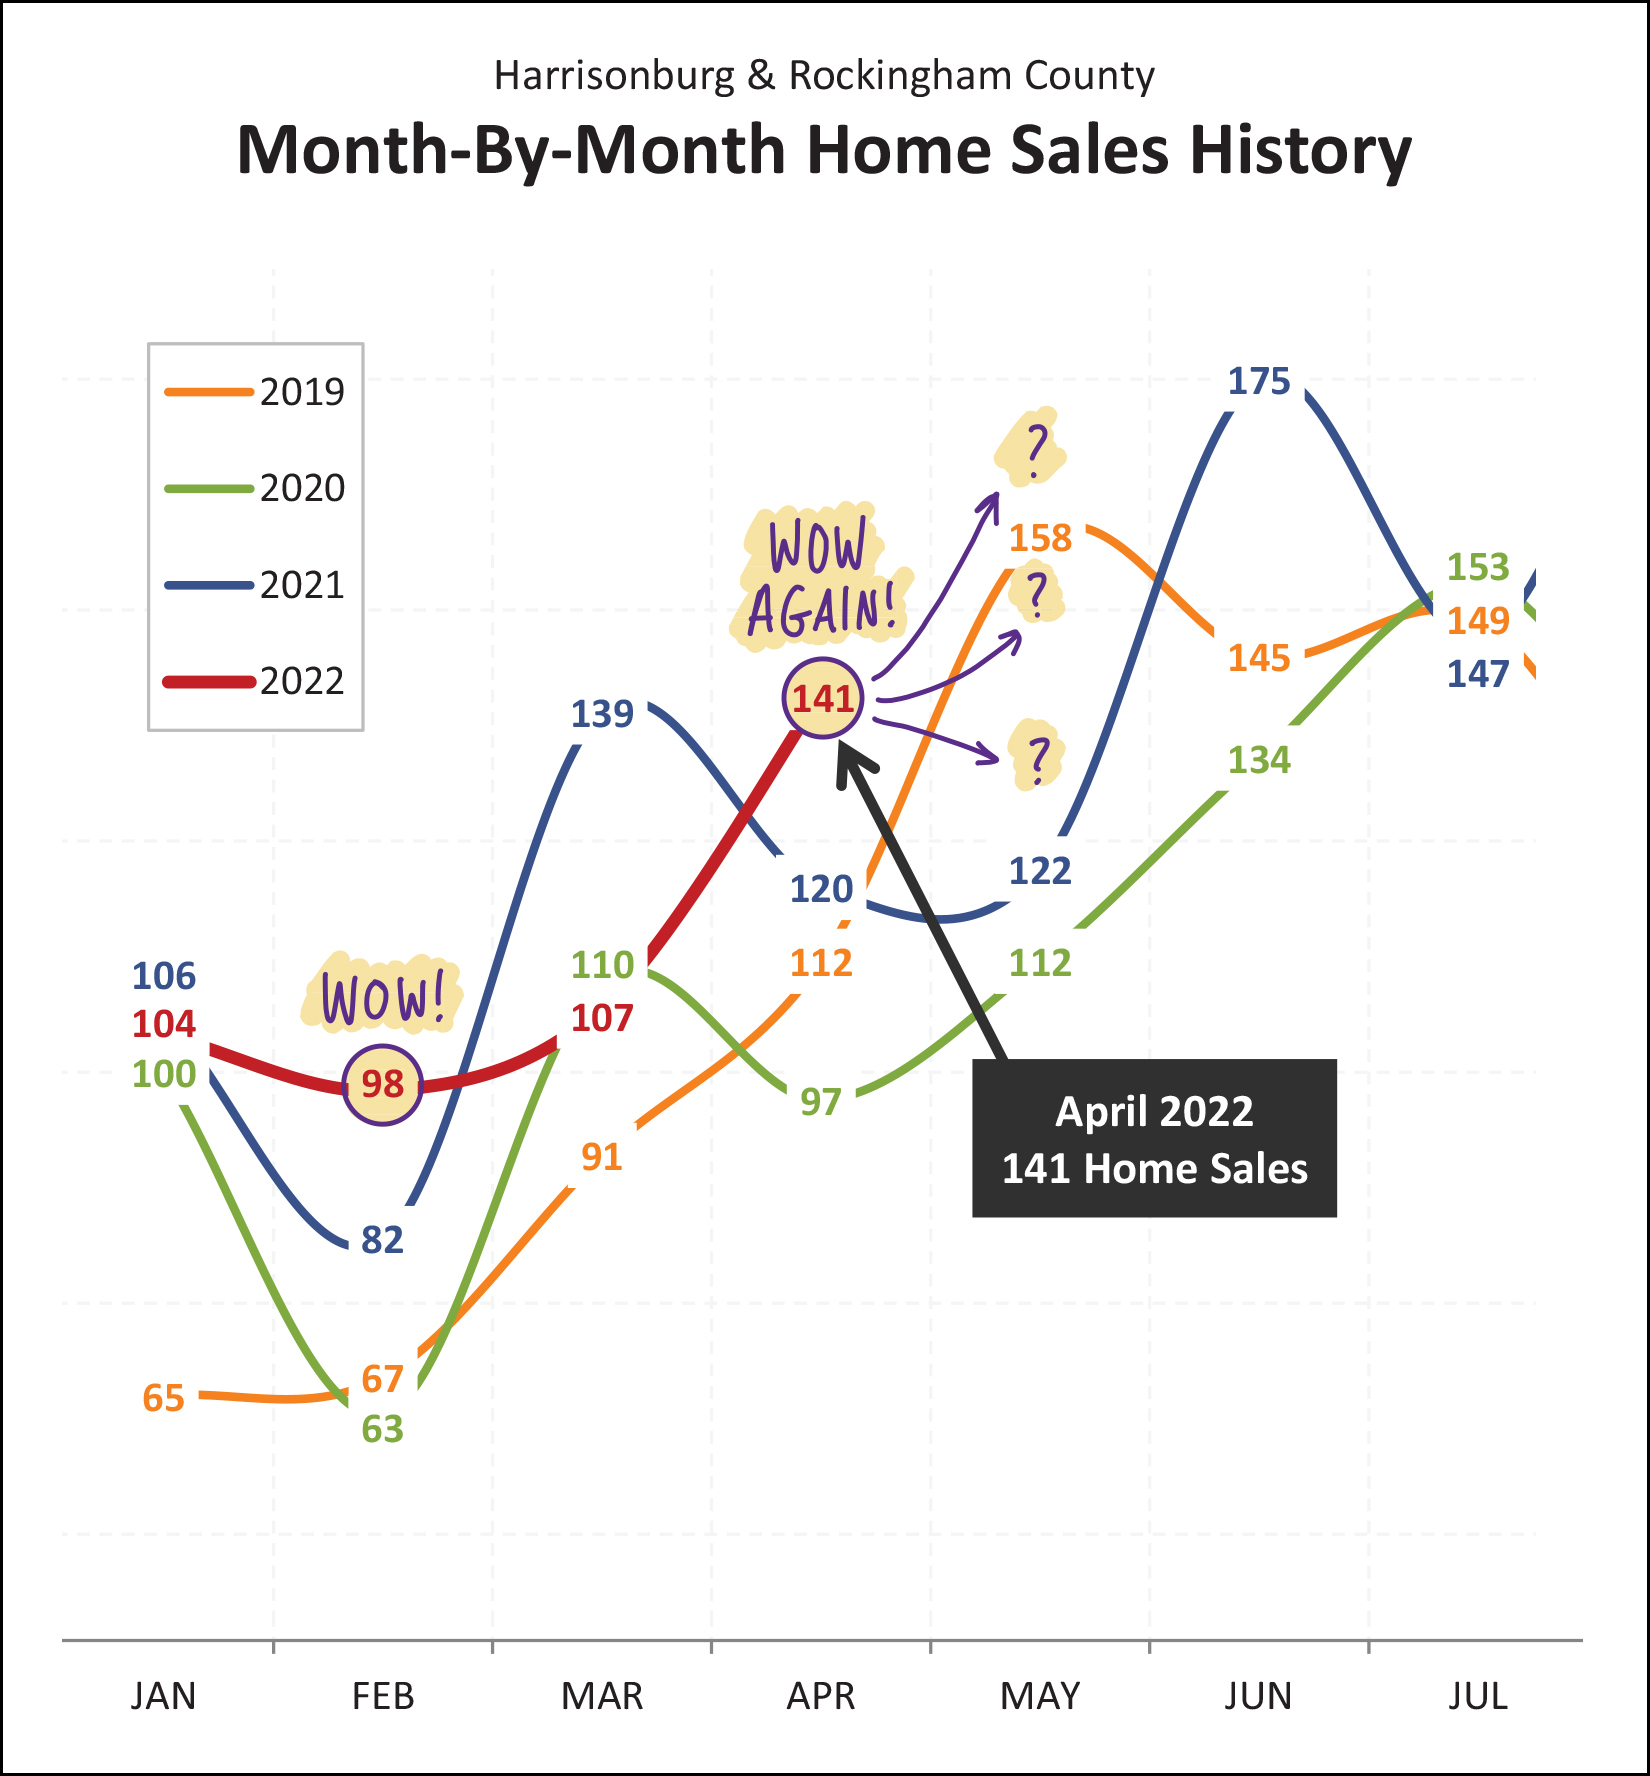 The 98 home sales seen in February 2022 was a surprising jolt of energy for the early 2022 housing market, but then things cooled off a bit in March... or so it seemed. Come April, the buyers were back, and the monthly market activity was once again surprising... with 141 home sales, well above the monthly sales in April of each of the past three years. That extra burst of home sales in April caught 2022 back up with 2021... 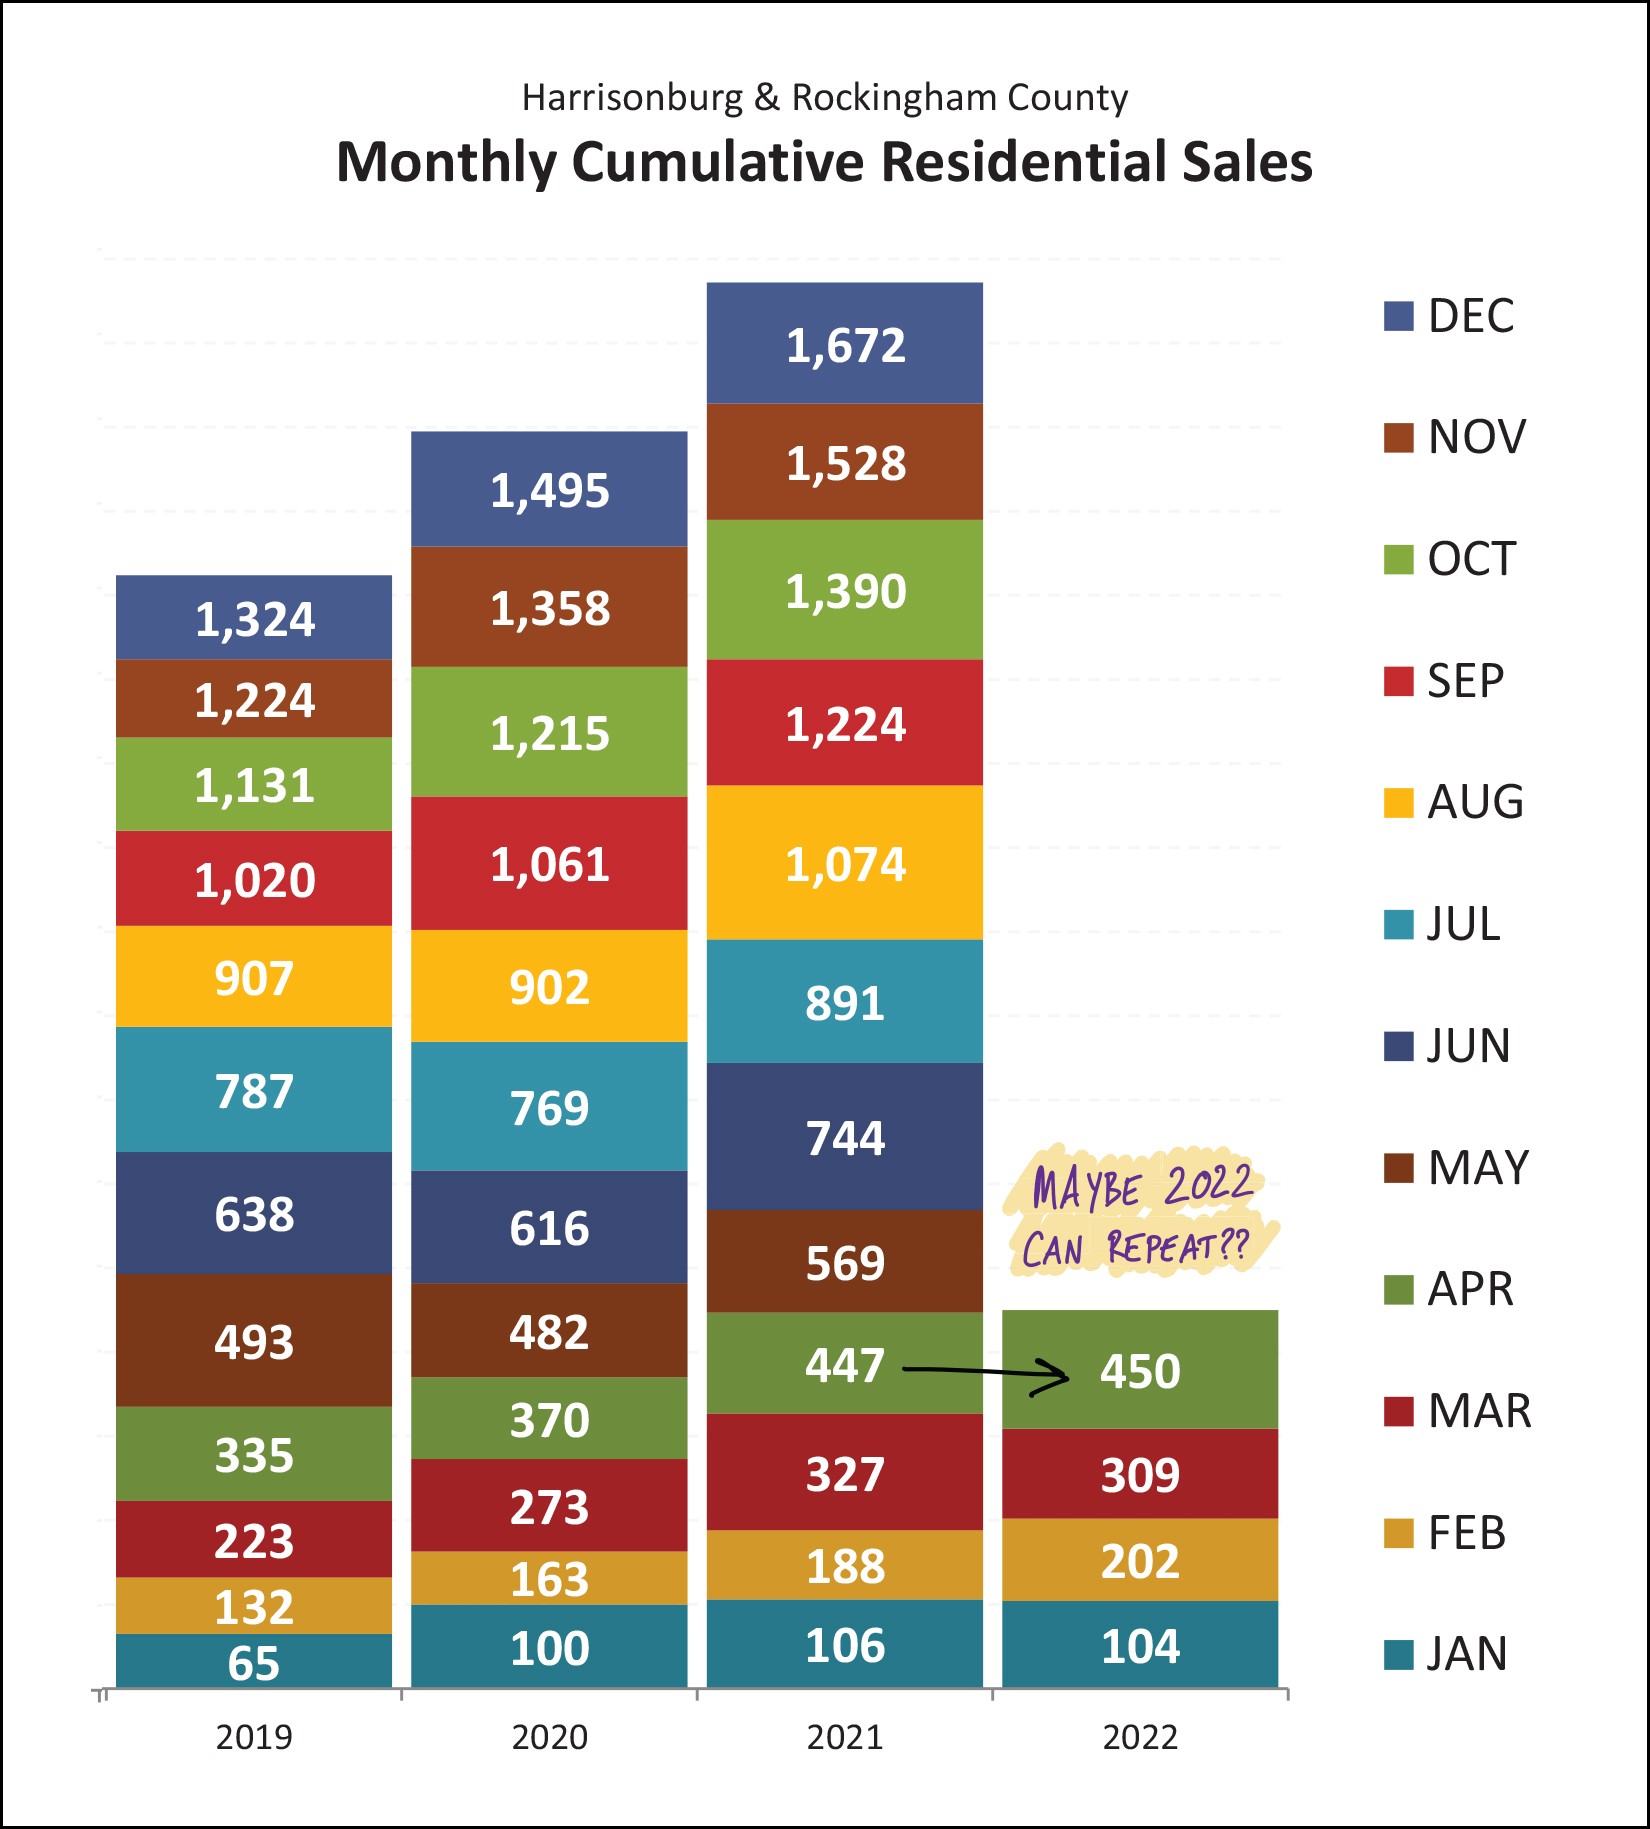 Year-to-date home sales through the end of March 2022 (dark red bar) had fallen a bit behind where things were a year ago at the end of March 2021. But, then, enter April 2022. A strong month of home sales in 2022 pushed this year back ahead of last year when looking at the first four months of the year. Repeating the 1,672 home sales seen last year still seems like a might feat for 2022, but it is still seeming quite possible after four months of sales activity. Of interest, as it relates to home sales activity, it does seem that we have come to the end of the line of ever increasing numbers of home sales in our area... 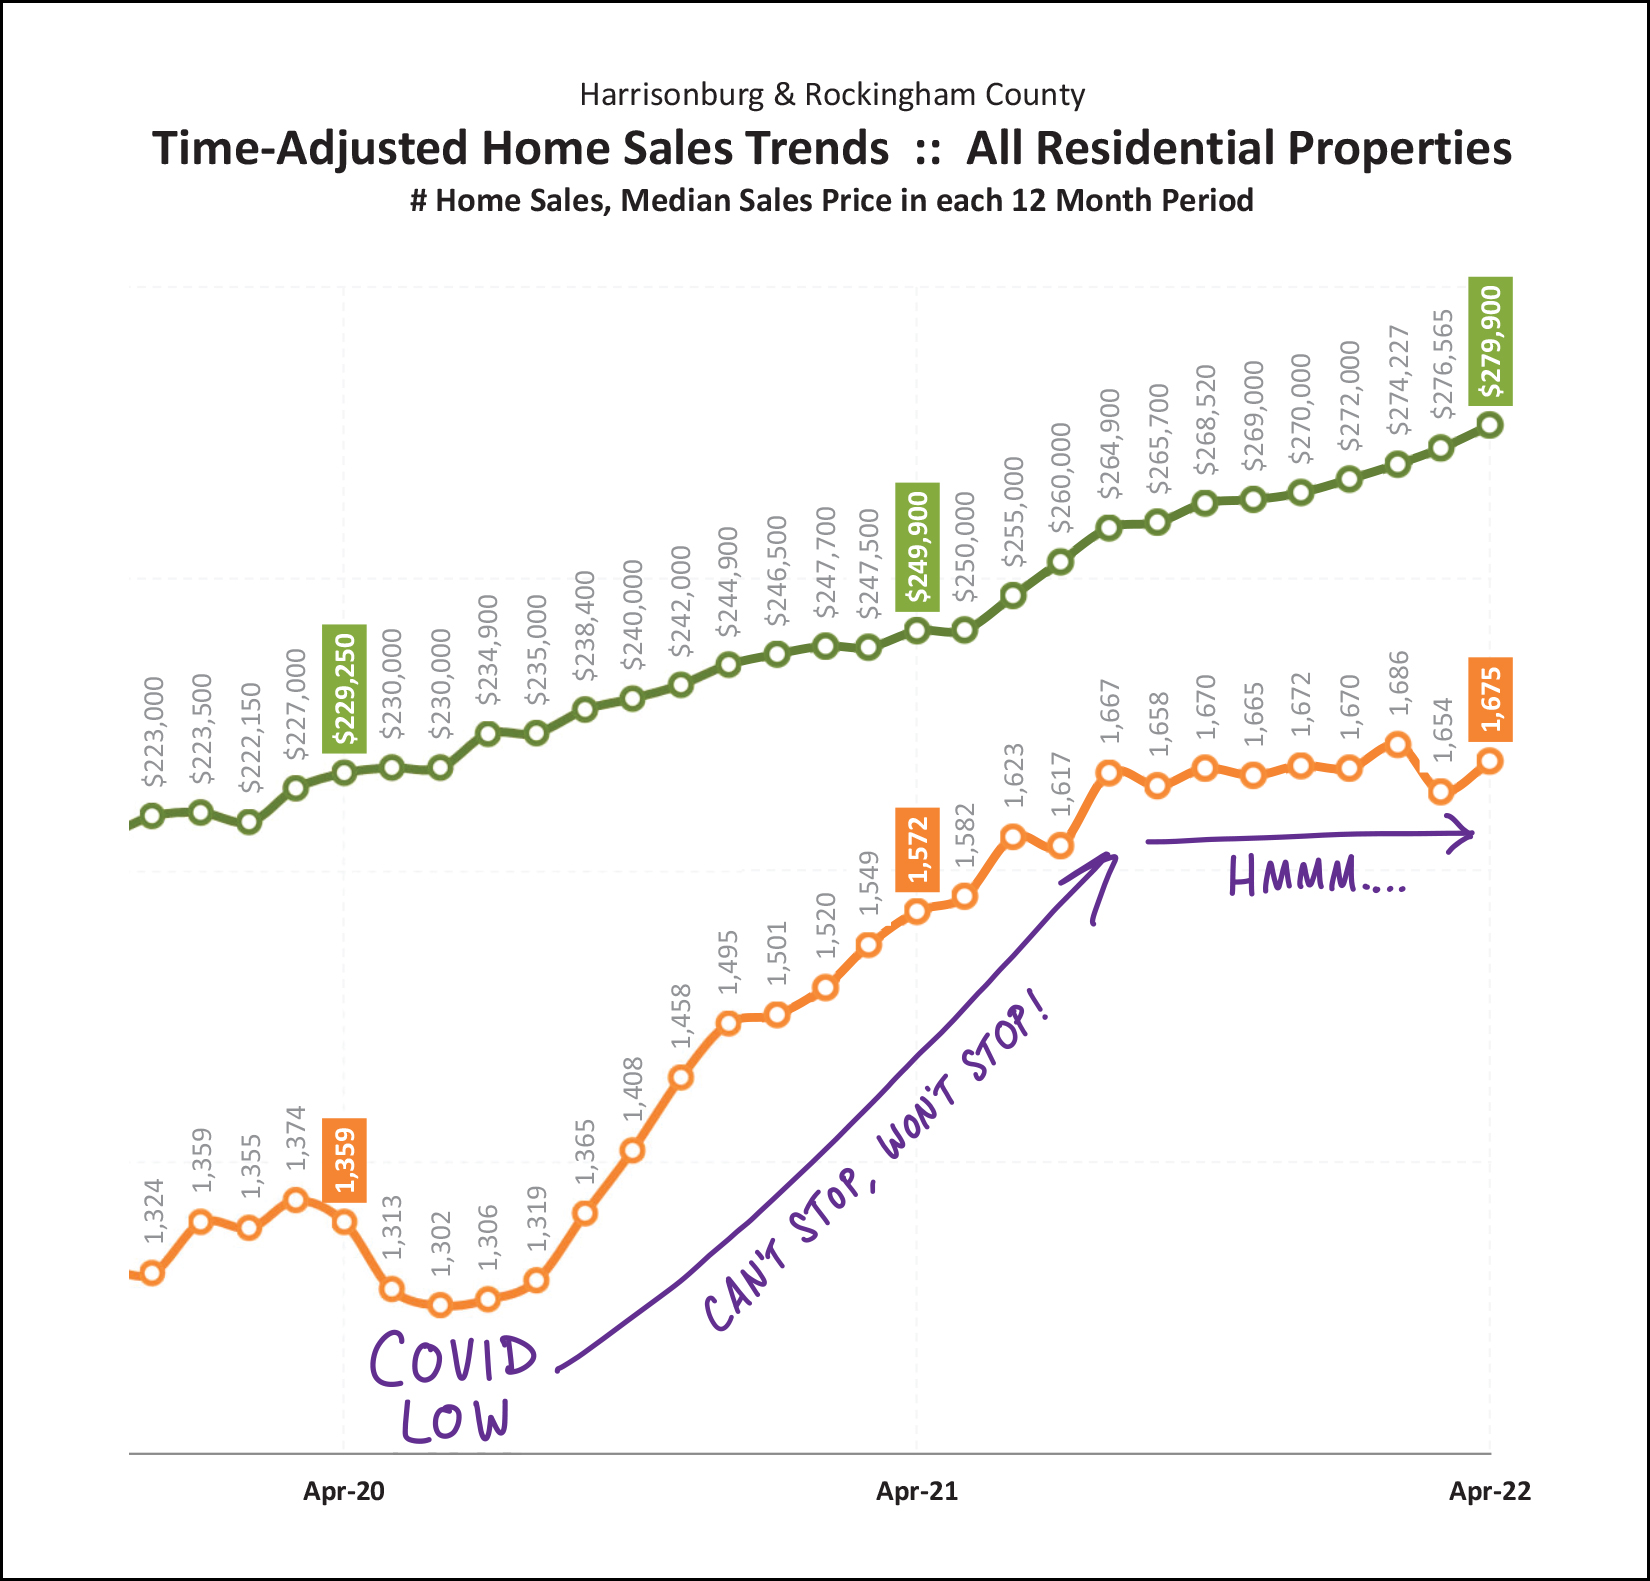 From the start of Covid in mid-2020 to the end of 2021, we saw a rapid increase in the number of homes selling on an annual basis with that figure steadily increasing from 1,300-ish to 1,650-ish. Now, over the past nine months, we have seen the annual pace of home sales largely holding steady around 1,650 to 1,675 home sales per year. It seems unlikely that we will see another strong increase in the annual pace of sales, but it seems equally unlikely that we will see a rapid decline in the number of home sales in Harrisonburg and Rockingham County. Bouncing back to prices... which keep soaring higher and higher... 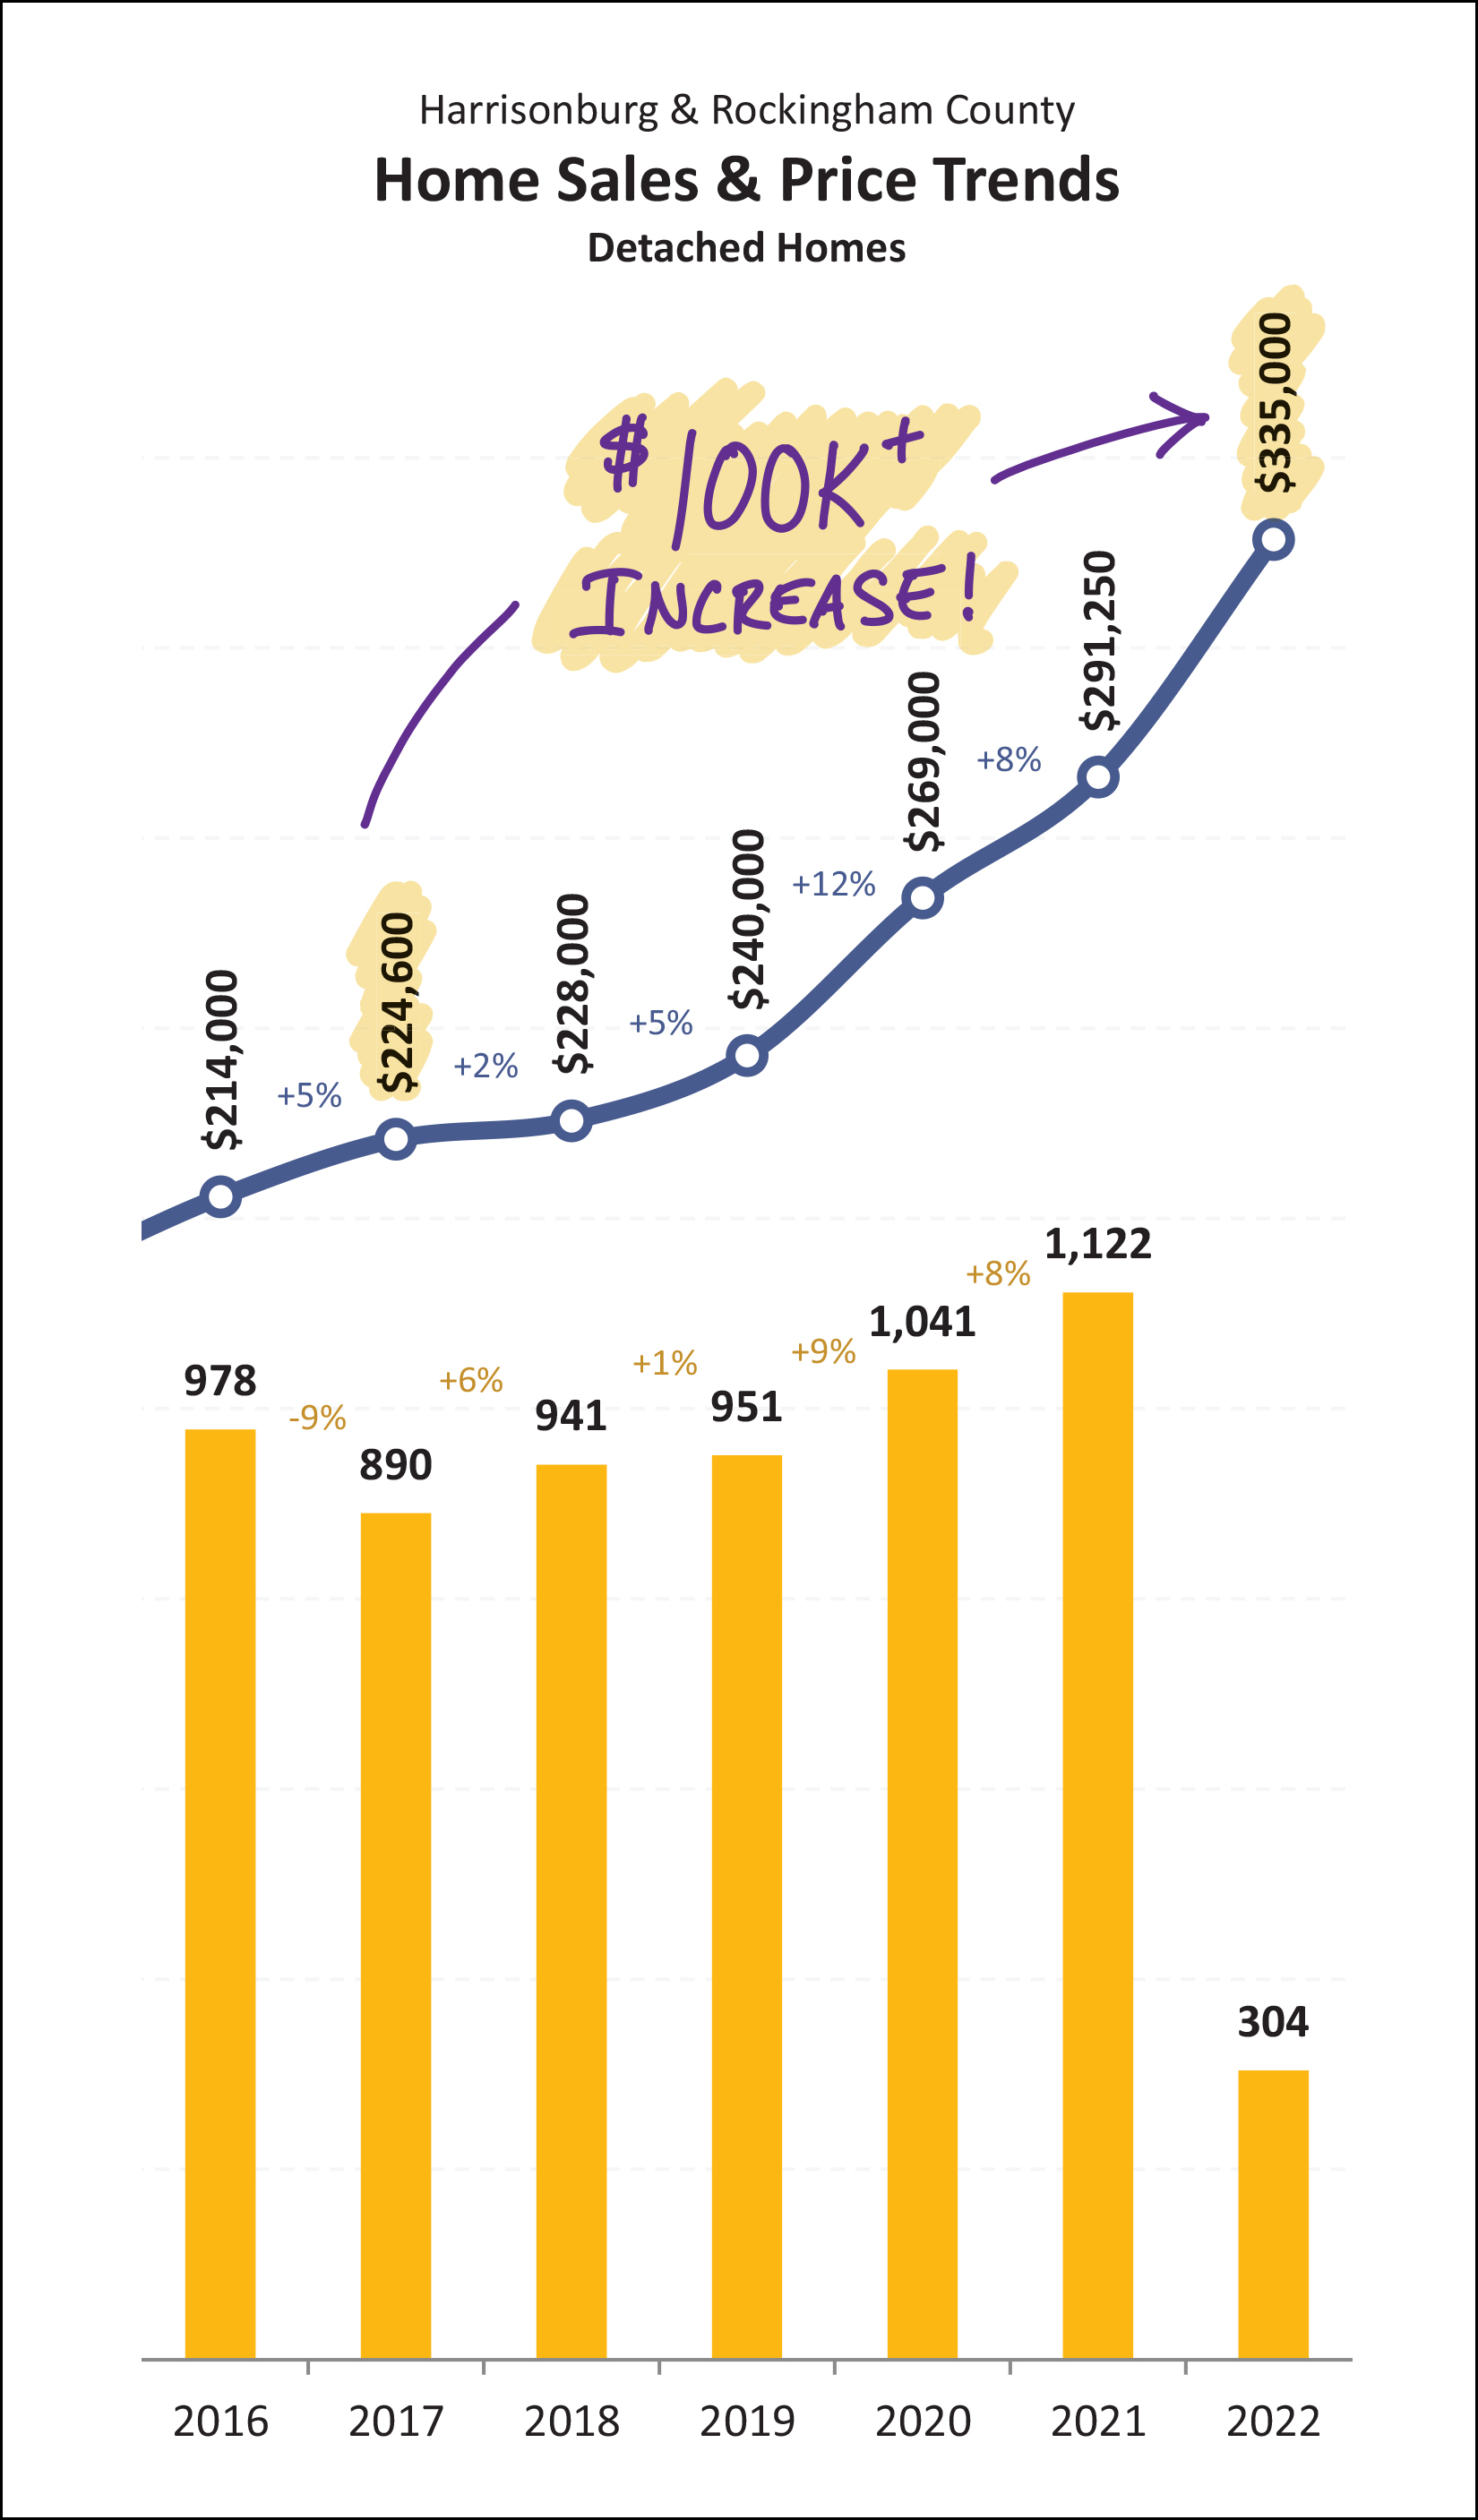 Here's a tidbit for you to share with a friend, relative or neighbor the next time you are talking about the crazy local real estate market... The median price of a single family (detached) home has increased by over $100,000 over the past... five years! That's rather astonishing. Just five years ago, the median price of a single family home was only $225K... and now it is up to $335K! Starting to look ahead now, let's examine contract activity... 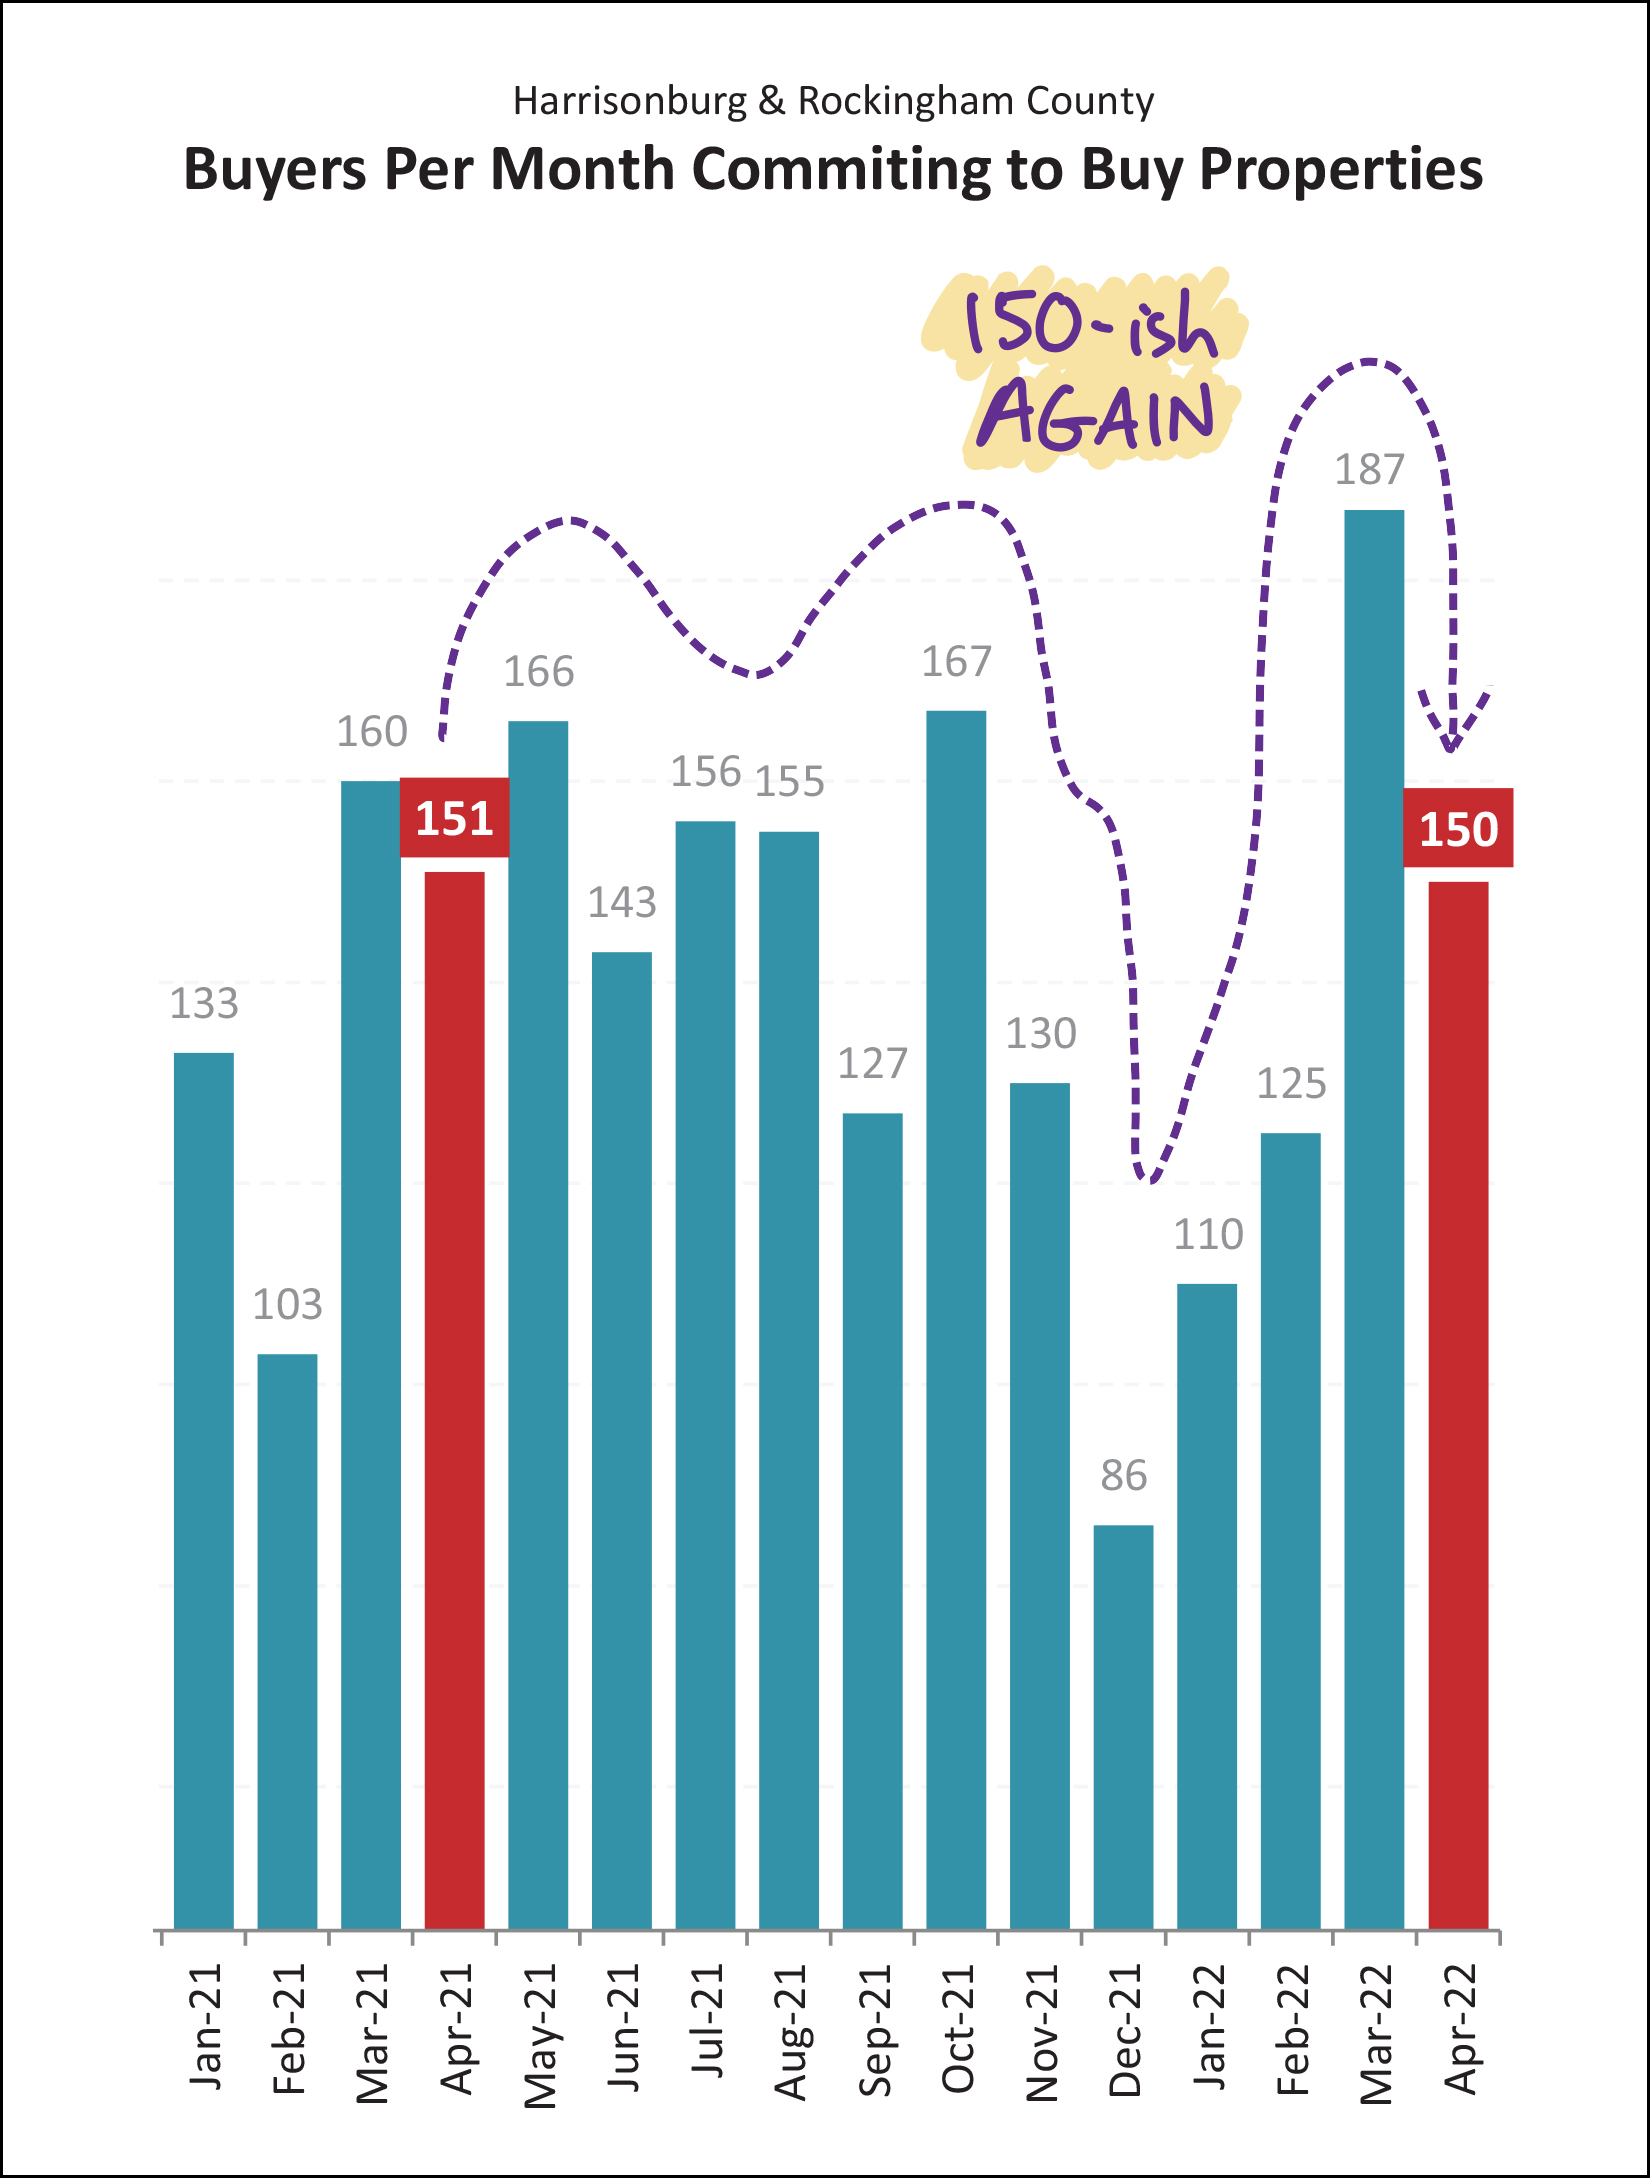 Contract activity (as shown above) is a funny thing. In theory, it measures when buyers made decisions to buy homes... but in times of low inventory (as in, now) contract activity has just as much to do with when sellers are ready to put their homes on the market. Few sellers selling = few buyers buying. No sellers selling = no buyers buying. That said, a year ago (in April 2021) there were 151 contracts signed on homes in Harrisonburg and Rockingham County and in the month that just concluded (April 2022) we saw... 150 contracts signed. So, despite the monthly ups and downs that always do occur, we still seem to be pretty much on track in 2022 with how things were progressing in 2021. Looking ahead, it seems likely that we'll see around 140 to 160 contracts per month over the next four to six months. Now then, about those sellers and whether they are ready to sell... 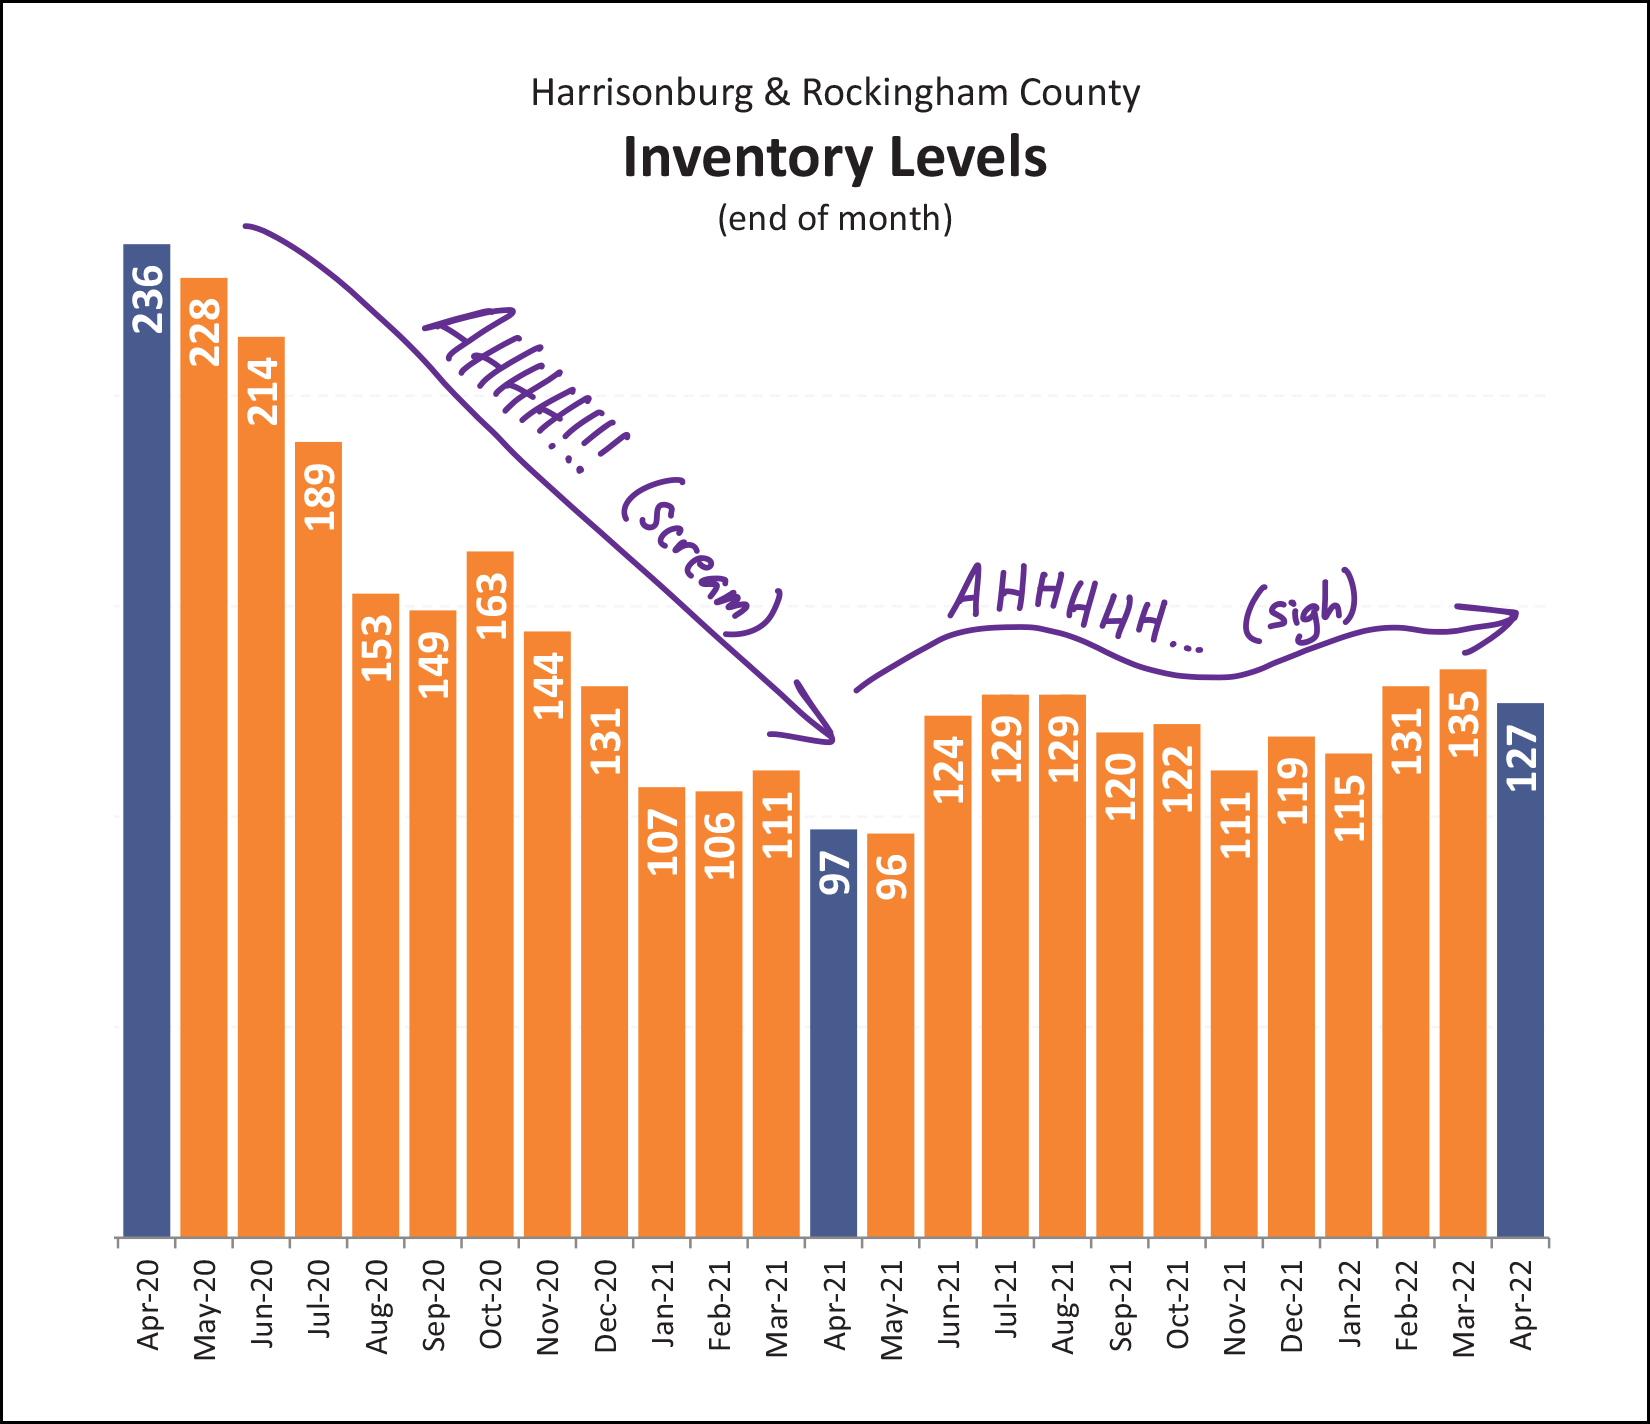 After quite a few years of inventory levels tumbling downward, it seems that things may have finally leveled off at an equilibrium of around 130 homes for sale in Harrisonburg and Rockingham County. This is only somewhat of a relief... it's great that inventory levels aren't dropping further, but these current inventory levels still aren't doing buyers any favors. In many or most price ranges and neighborhoods there is nothing or next to nothing available for sale at any given time. For buyers to feel like things are improving, at all, we'd need to start to see a bit more inventory staying on the market at any given time. We're not there yet. Going hand in hand with very low inventory levels is the speed at which homes are going under contract... 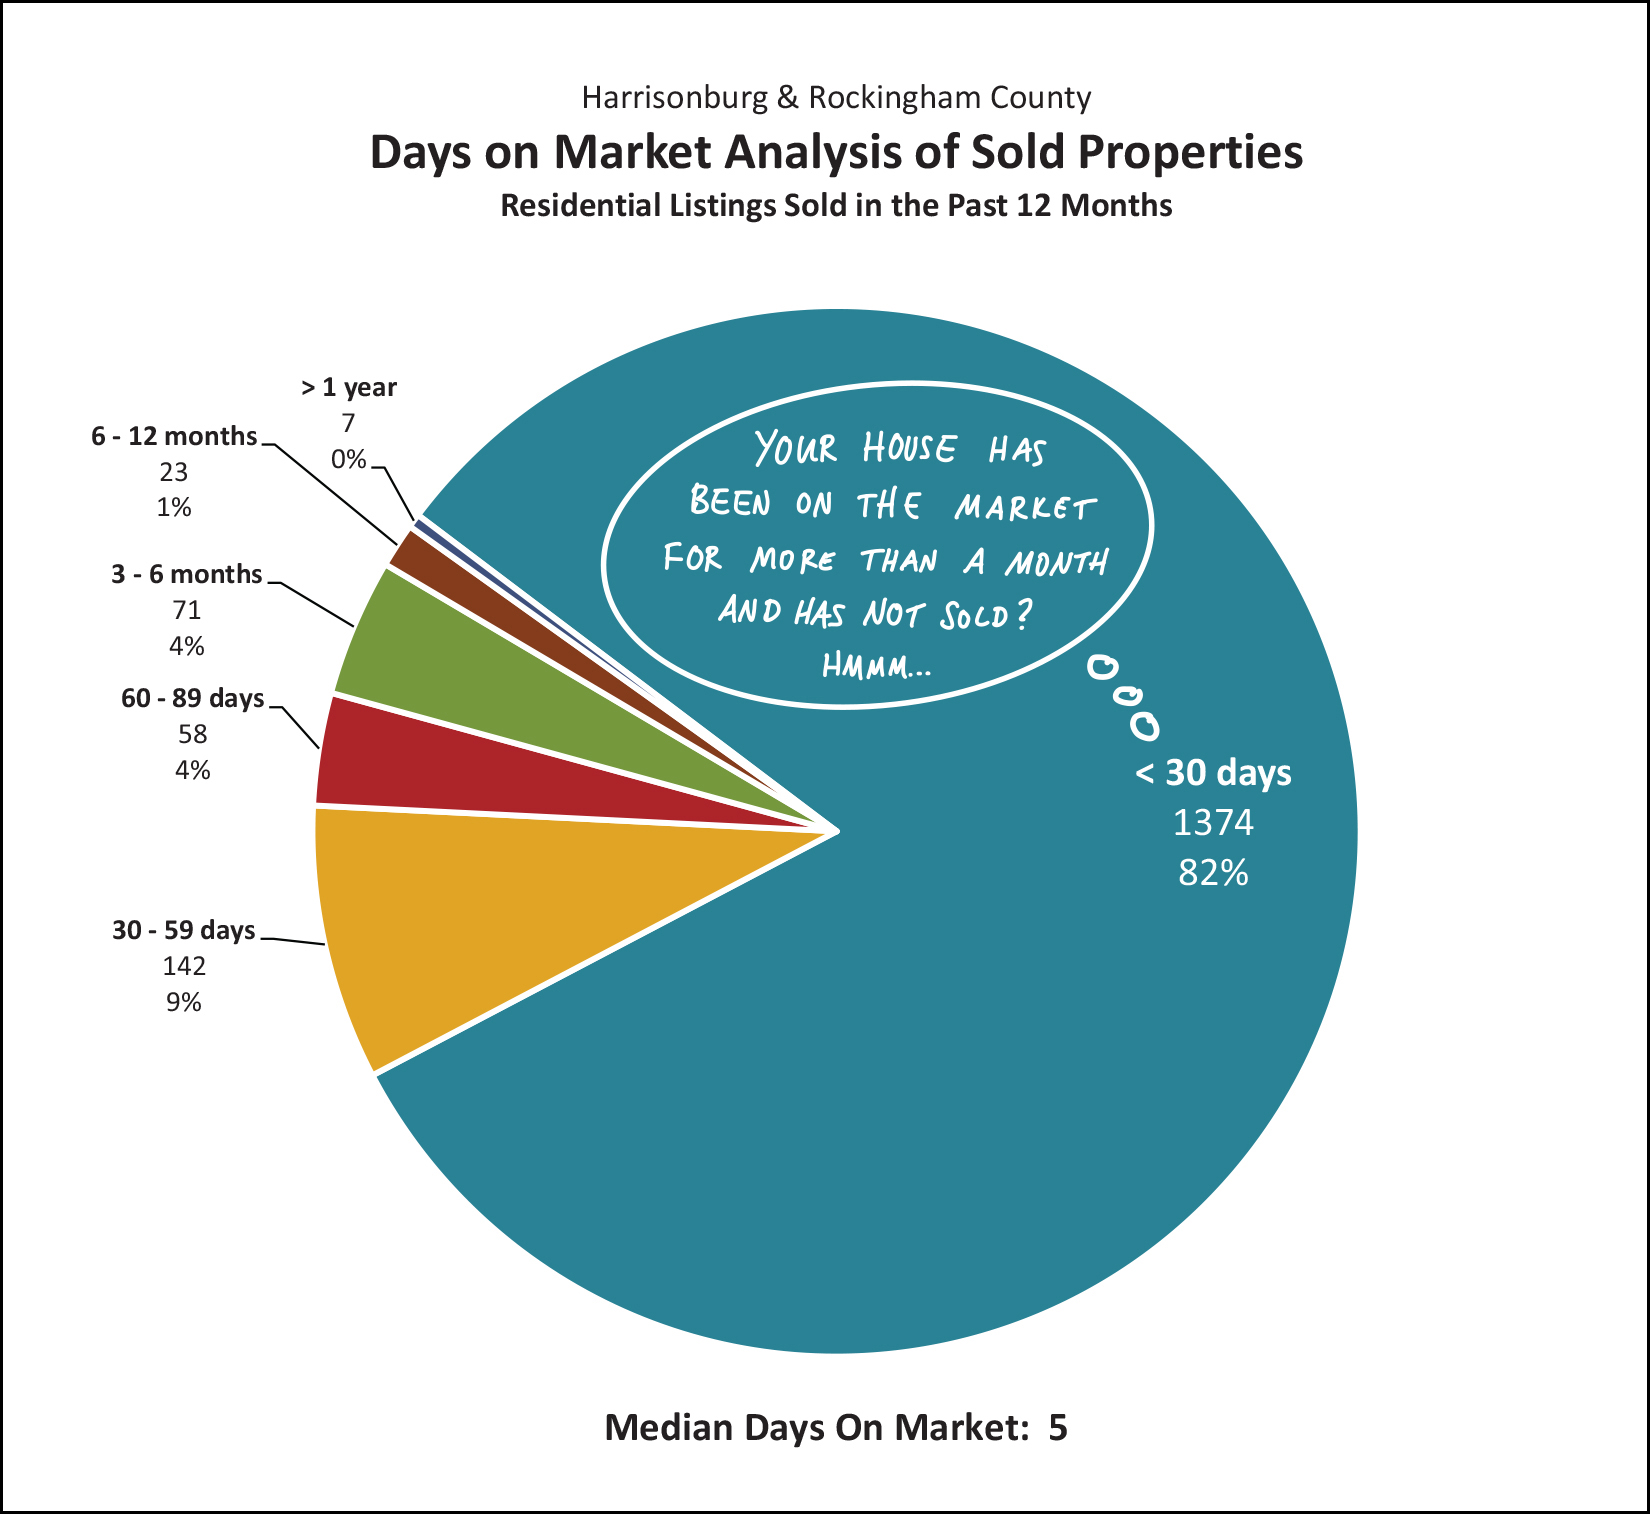 Indeed, as noted above, if your home has been on the market for more than a month... and is still not under contract.... hmmm.... Right now, 82% of homes (that sell) are under contract within 30 days, and 91% are under contract within 60 days! The market is moving quickly, so if your house isn't moving quickly then you should have a chat with your Realtor to understand why. This next metric also looks at median days on the market, and I think it will be the first metric to start shifting if or when the market starts to soften a bit... 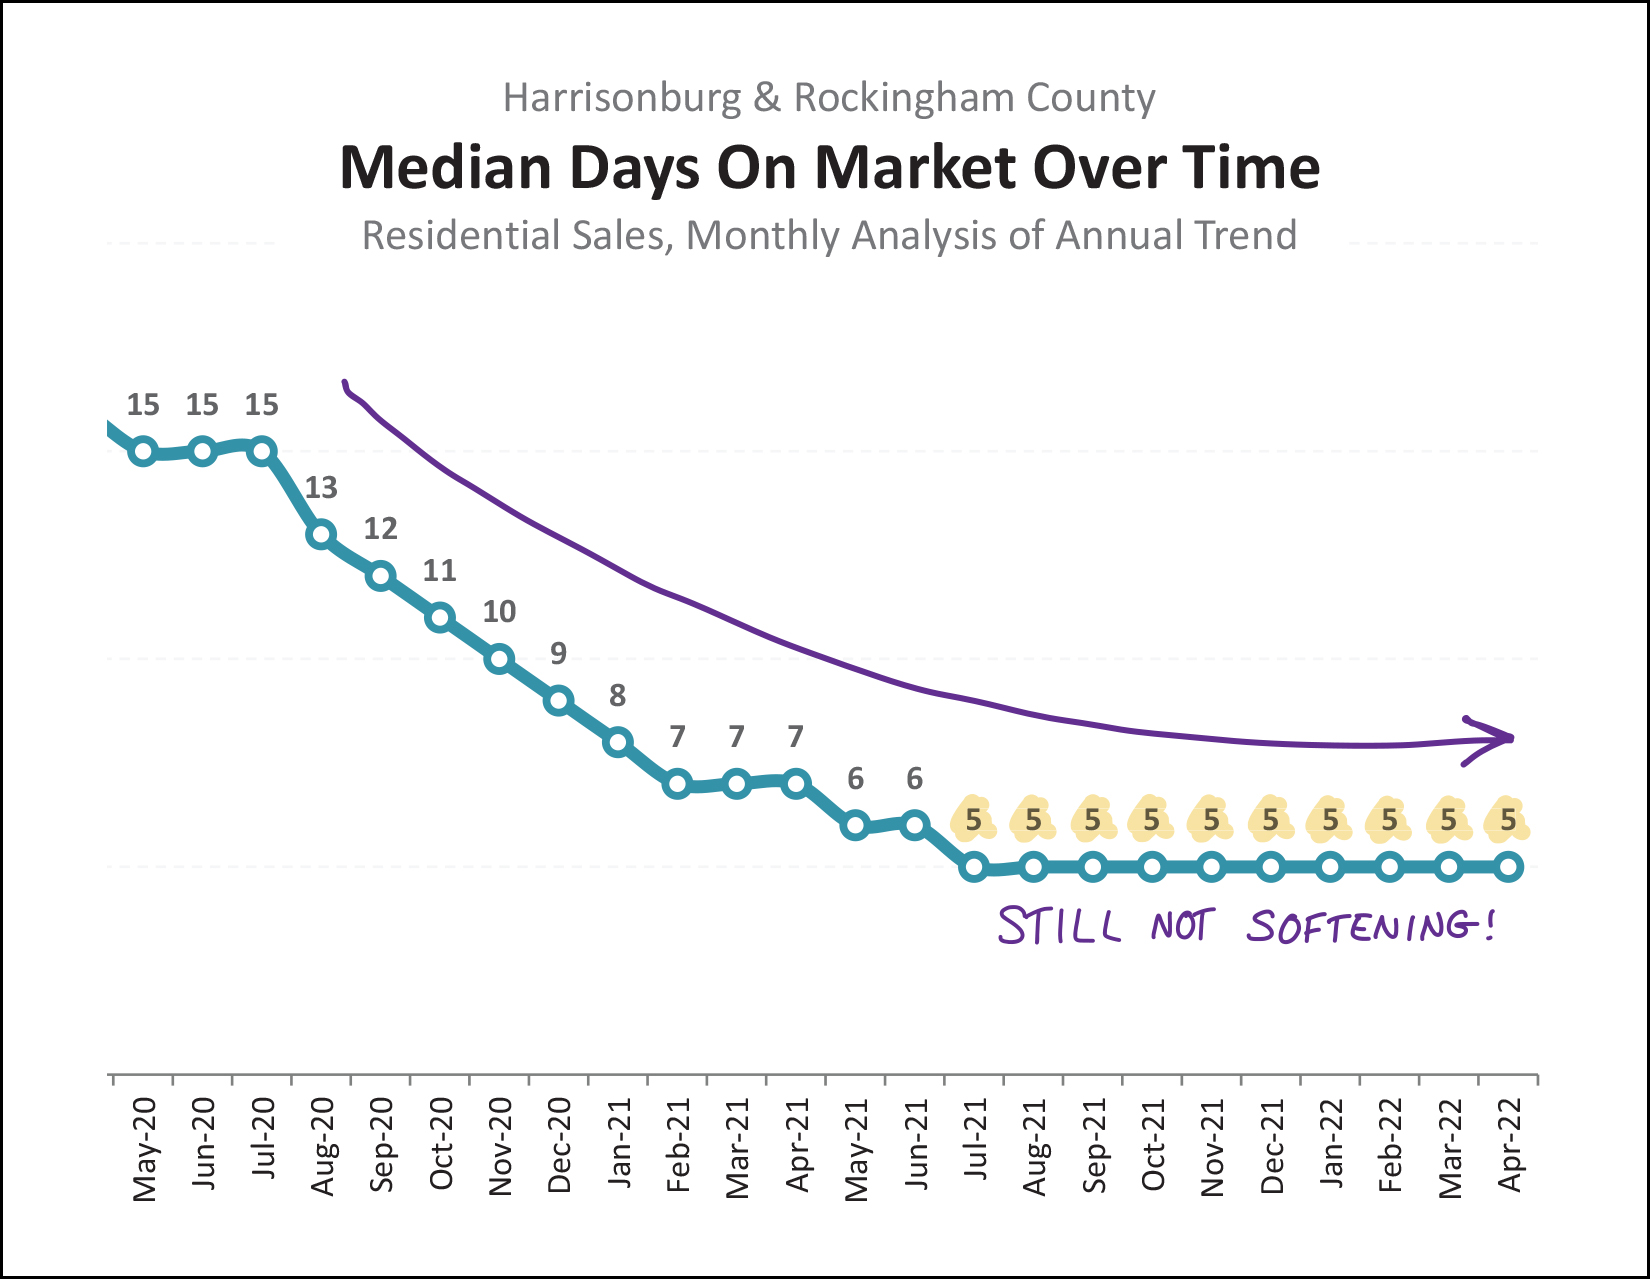 Over the past 12 months, the median "days on market" has been five days... and the market has been moving that quickly for almost a year now... since last July. At some point we will likely see the speed of the market start to slow down a bit... and that will be OK! If the median days on market of sold listings crept back up to seven days, or even (gasp!) ten days... the market would likely still (!!) be tipped in favor of sellers. But, despite talk of possible softening or deceleration of the market... it doesn't seem to be happening yet. And here is why some are thinking the pace of housing market activity could start to slow down a bit... 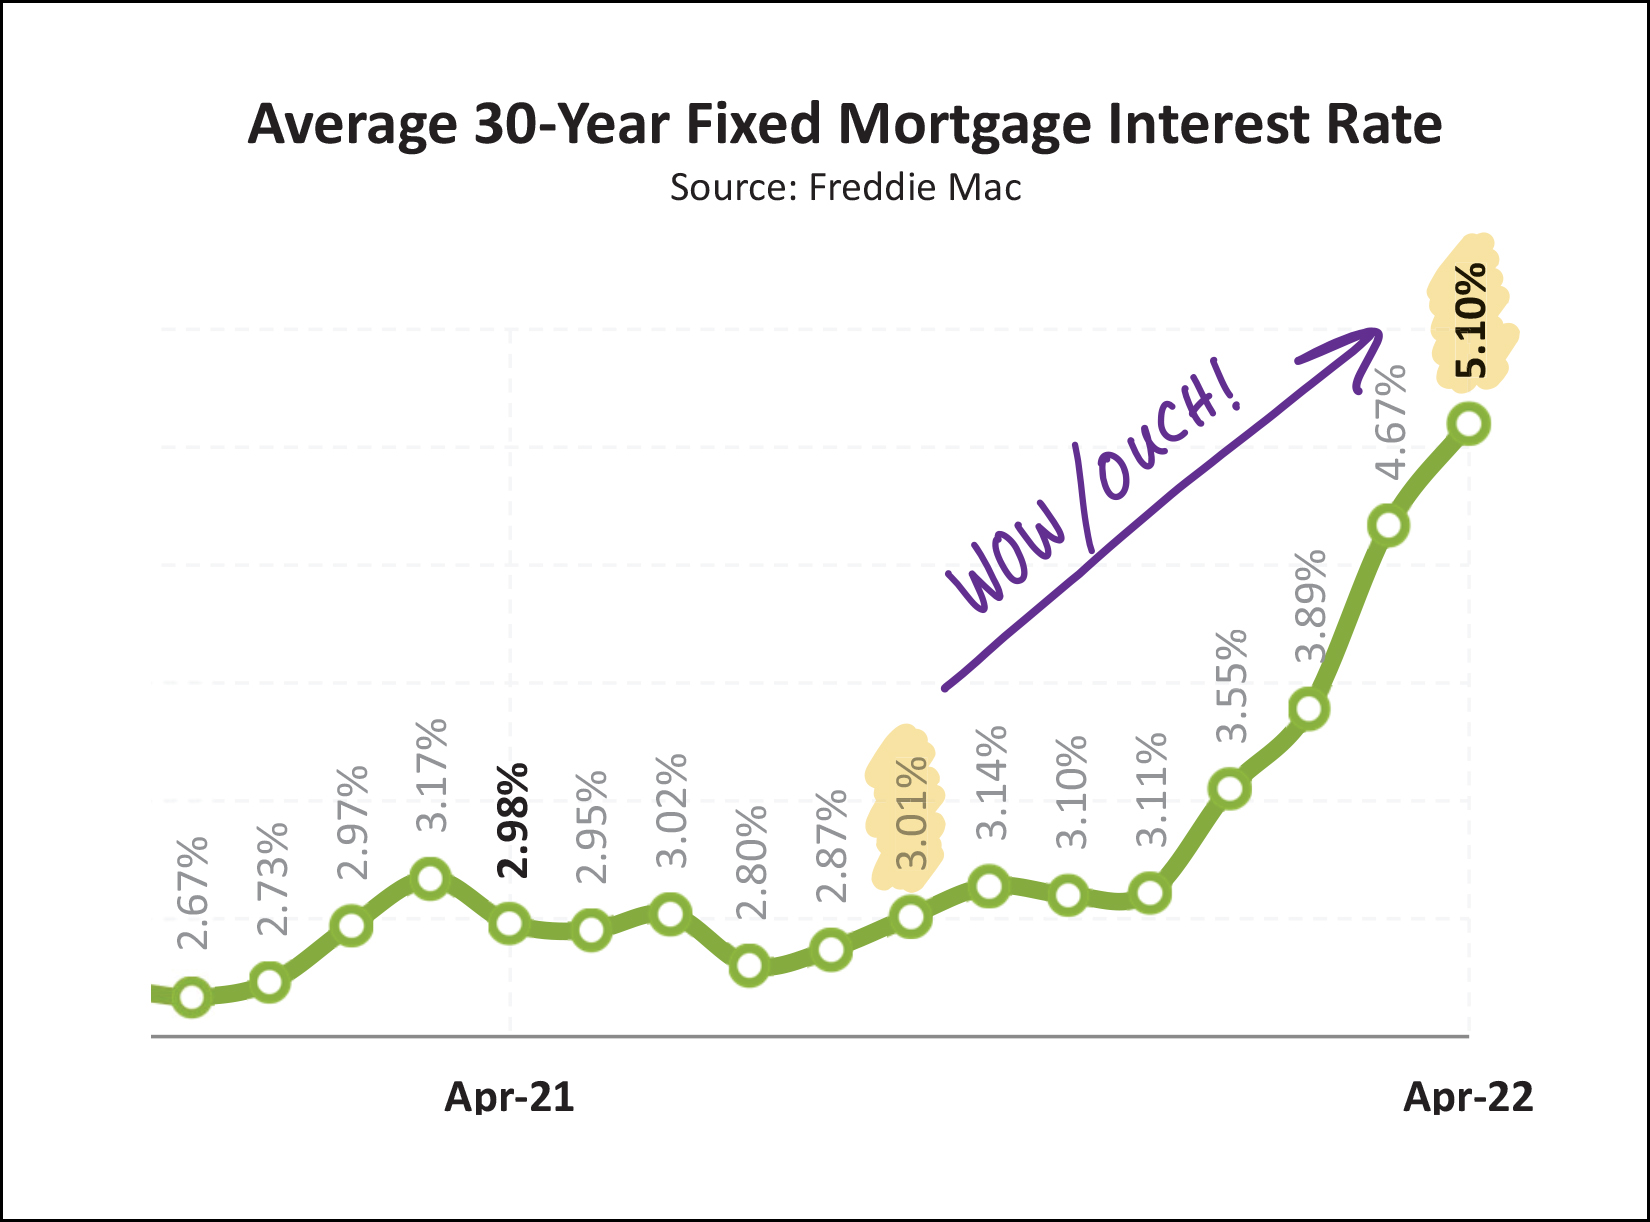 After quite a few years below 4% (and even below 3%) the average mortgage interest rate has quickly risen over the past seven months... from right at 3% to just over 5%! This can make a significant difference in the monthly payment that buyers will have to pay on their mortgage... so it has a good chance of impacting the amount of buyer interest in various houses at various price points. We haven't seen an overall market slowdown yet as a result of these rising rates, but it seems quite possible that if interest rates continue to rise we will see buyer enthusiasm dampen a bit. And with that... we reach the end of my monthly ramblings about the state of the local housing market. I hope the graphs above and my reflections herein have helped you have more clarity on the current happenings in our local housing market. Before signing off, a few reminders... [1] Make plans to attend the Red Wing Roots Music Festival this year. You won't regret it! Enter to win a free pair of three-day general admission tickets here. [2] If you are planning to sell your home, or move, or buy a home, this spring or summer, let's chat. I can swing by your house or we can start with a brief conversation by phone or email. Call or text me at 540-578-0102 or email me here. That's it! I hope the balance of your month of May goes well. Touch base anytime if I can be of any help to you or your family, friends or co-workers or colleagues... with real estate or otherwise. | |
If Your Home Has Been On The Market For More Than __ Days And Is Not Under Contract, Ask Yourself Why! |
|
 Five short (long!?!) years ago -- back in 2017 -- the median days on market was 33 days. That is to say that half of homes that sold were under contract within 33 days and half took longer than 33 days to go under contract. So, back in 2017, if your house was on the market for more than 33 days, you had to start wondering why. Why was it taking that long for your house to go under contract. The same logic applies today, though the timeframe is quite a bit (!!!) shorter. The median days on market is now just five days (over the past 12 months) which means that half of homes are going under contract in five or fewer days and half are going under contract in five or more days. So... if your house is still on the market, and not under contract, a week after hitting the market (gasp!) you will probably want to ask yourself why a buyer has not contracted to buy it yet. Is the price too high? Did you not prepare the house well enough and some aspects of the condition of the house are making buyers less excited about it? Is the marketing of your house selling it short? Or, is there some aspect of your house that you cannot change that will cause it to take longer to sell? For better or for worse, within a week of having your house on the market you should have some very helpful feedback on your pricing, preparations and marketing. | |
Generally Speaking, The Larger The Home, The Lower The Price Per Square Foot |
|
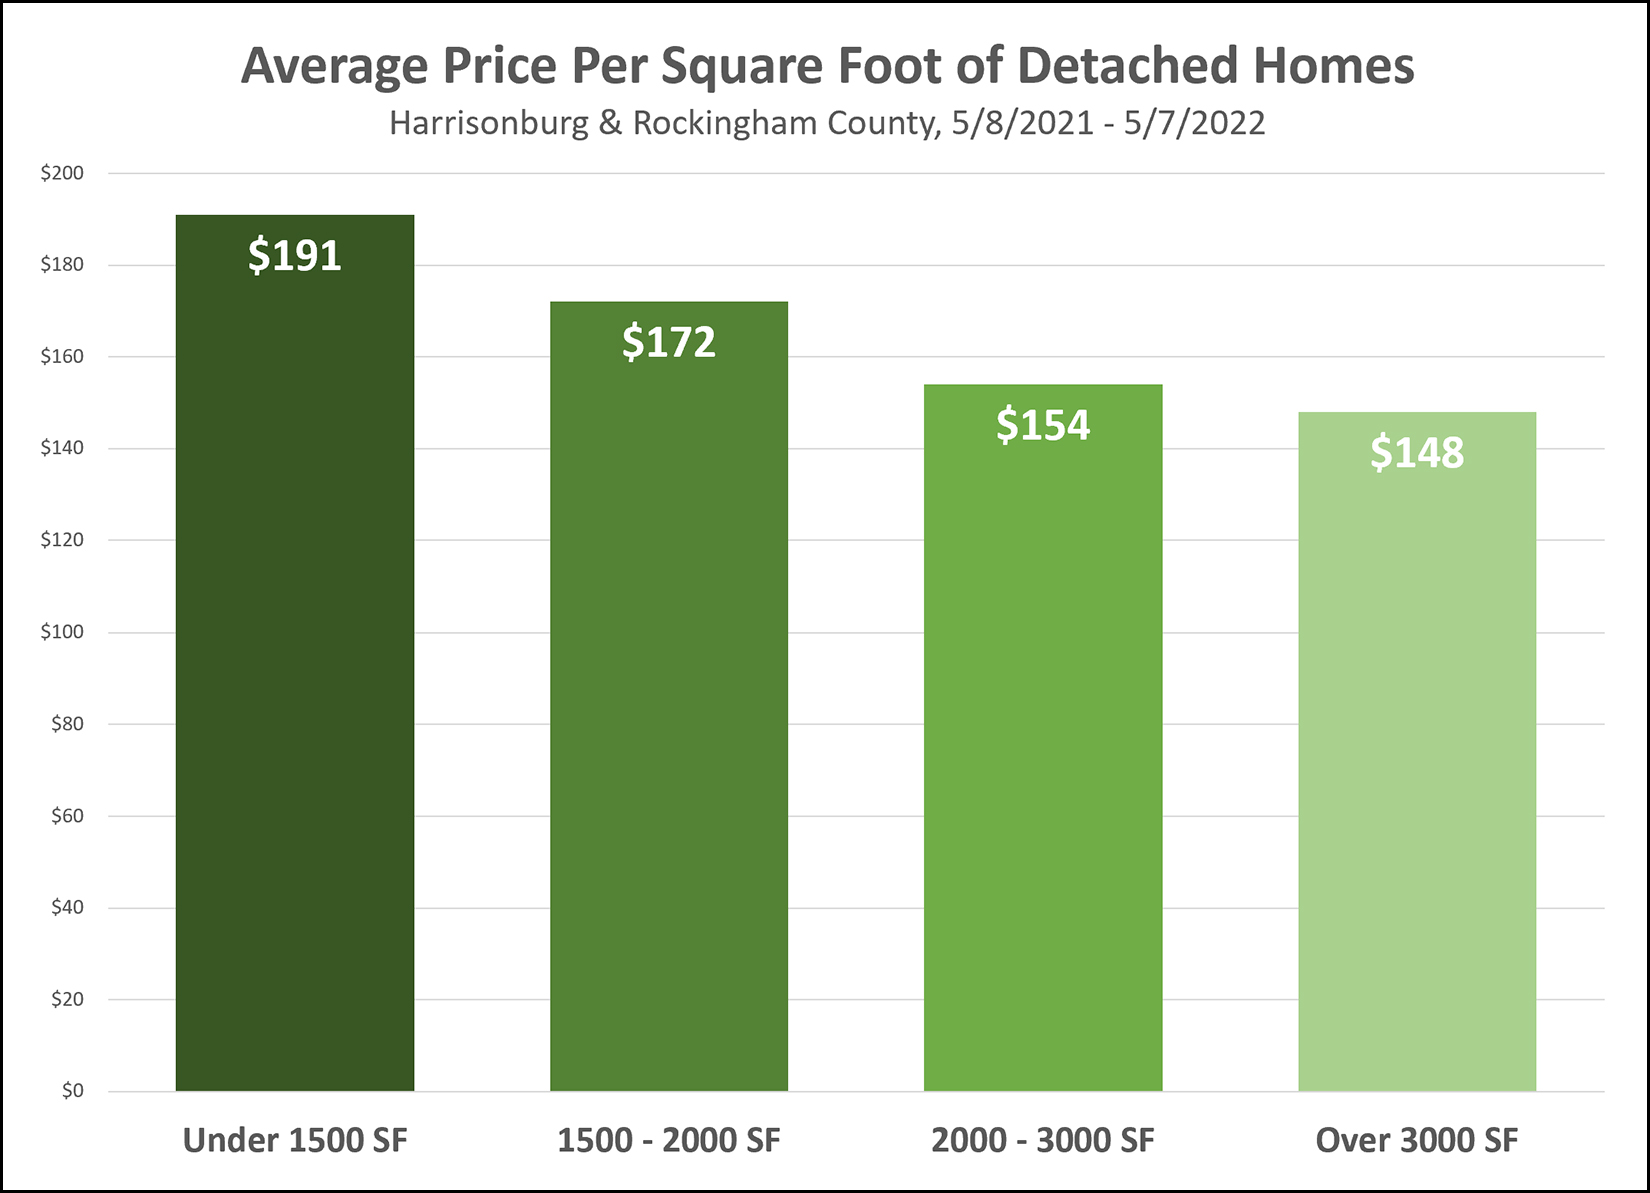 If all other attributes of two houses are the same or similar (age, condition, finishes, location, lot size) then we will almost always see the price per square foot being lower for the larger of the two houses if there is a decent difference in the sizes of the two houses. Stated differently, if we look at five homes that have sold in a neighborhood and we find the following... House 1 = 2,000 SF and sold for $168/SF ($336,000) House 2 = 2,050 SF and sold for $167/SF ($342,350) House 3 = 1,985 SF and sold for $168/SF ($333,480) House 4 = 2,025 SF and sold for $169/SF ($342,225) House 5 = 2,003 SF and sold for $167/SF ($334,501) ...and then if we looked at a sixth house in the neighborhood that is 3,000 SF, would it be reasonable to calculate the average price per square feet of the first five houses and then use that to calculate the value of the sixth house? Average PPSF of First Five Houses = $167.80 / SF Projected Value of Sixth House = 3,000 SF x $167.80 / SF = $503,400 So... is that reasonable? Will this sixth house sell for $503,400 while surrounded by houses that are selling for $330K to $345K? Probably not. Generally speaking, the larger the home, the lower the price per square foot. Thus, we can't reasonable use the PPSF of smaller homes to accurately predict the home value of a larger home. A seller would love to use the logic above to conclude that their home is worth $503,400 but buyers (and an appraiser) are not likely to agree. The reverse is also true... we can't use the PPSF of larger homes to predict the value of a smaller home. House 1 = 3,000 SF and sold for $152/SF ($456,000) House 2 = 3,050 SF and sold for $151/SF ($460,550) House 3 = 2,985 SF and sold for $150/SF ($447,750) House 4 = 3,025 SF and sold for $151/SF ($456,775) House 5 = 3,003 SF and sold for $151/SF ($453,453)...and then if we looked at a sixth house in the neighborhood that is 2,100 SF, would it be reasonable to calculate the average price per square feet of the first five houses and then use that to calculate the value of the sixth house? Average PPSF of First Five Houses = $151 / SF Projected Value of Sixth House = 2,100 SF x $151 / SF = $317,100 So... is that reasonable? Will this sixth house sell for $317,100 while surrounded by houses that are selling for $445K - $465K? Probably not. Generally speaking, the smaller the home, the higher the price per square foot. Thus, we can't reasonable use the PPSF of larger homes to accurately predict the home value of a smaller home. There is a place for using price per square foot for analyzing home value... but it depends on most attributes of all of the homes being very similar... location, age, lot size, finishes, and yes, square footage! | |
| Newer Posts | Older Posts |
Scott Rogers
Funkhouser Real
Estate Group
540-578-0102
scott@funkhousergroup.com
Licensed in the
Commonwealth of Virginia
Home Search
Housing Market Report
Harrisonburg Townhouses
Walk Through This Home
Investment Properties
Harrisonburg Foreclosures
Property Transfers
New Listings

