| Newer Post | home | Older Post |
Local Real Estate Market Starts to Pop in February 2018 |
|
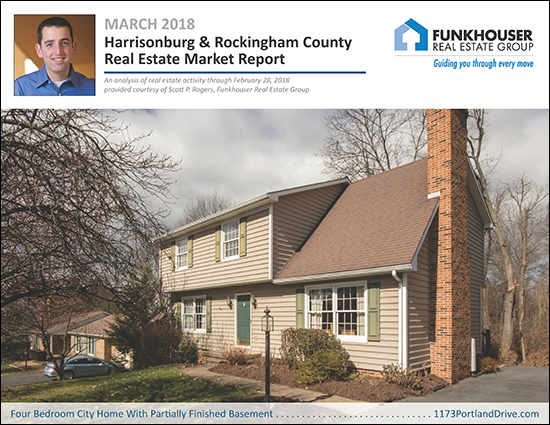 Find out about this newly listed (today!) City home at 1173PortlandDrive.com. I just published my most recent monthly market report, and as usual, you can read on for an overview, download the full report as a PDF, read the entire report with commentary online, or tune in to my monthly video overview of our local housing market...  OK -- now, let's dig into some of the main market metrics.... 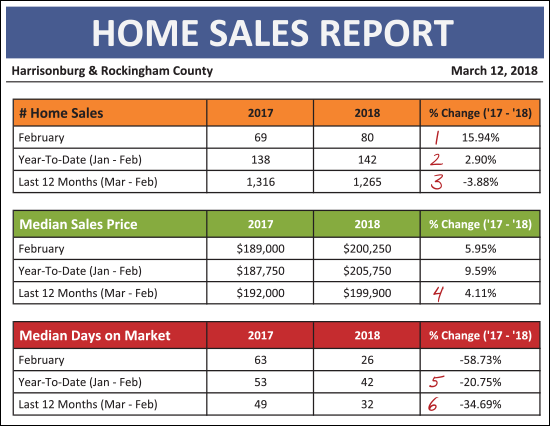 As shown above....
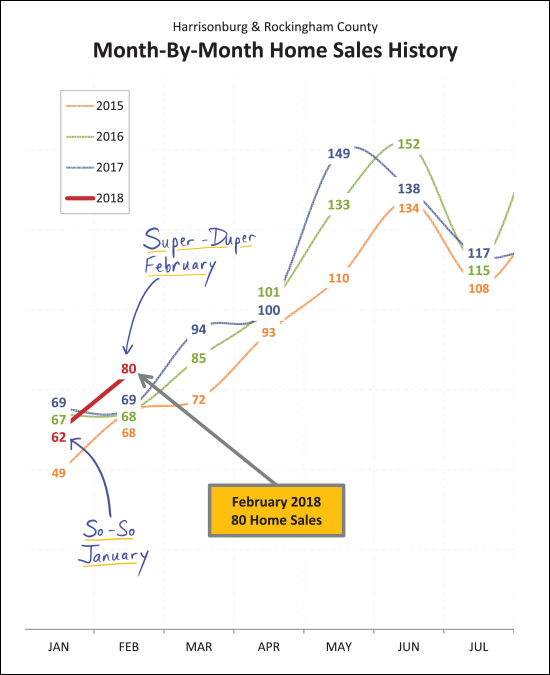
January 2018 wasn't the best January in the past few years, though it wasn't the worst either. It was in the middle of the pack, as shown above. February, however, was a strong month of sales -- jumping out ahead past the past three months of February. It seems likely we'll see between 90 and 100 home sales in March.
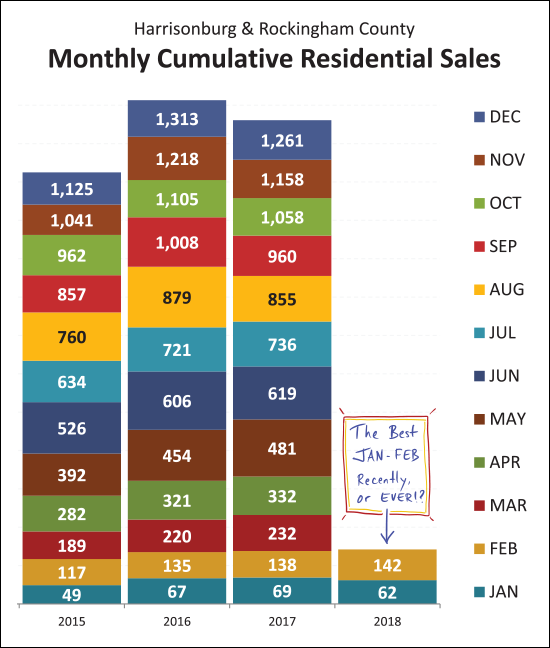
The graph above is actually a bit of a warning against too much exuberance over the BEST January-February combo we've seen in any recent year. Because, look carefully at last year -- you'll note that 2017 home sales were ahead of 2016 all the way through the end of July. So, for the first seven months of the year, it looked like we were poised to break even more records for the number of home sales in this area. And then in August and September of last year, we fell behind, and never caught back up. So -- it is exciting to see record numbers of sales in the combined first two months of this year -- but it in no way means that we'll see an actual increase in annual sales by the time December 31 rolls around.
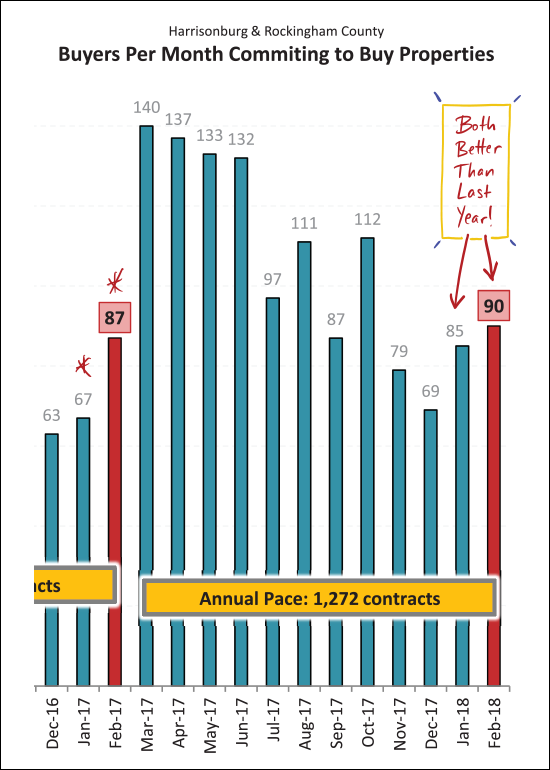
Having now brought you down to earth, I'll pump you up again. :-) The 85 and then 90 contracts seen in January/February of 2018 is a nice increase from last January/February when we saw 67 and then 87 contracts. So -- the faster (closed) sales pace may at least continue into March, and maybe April given the contracts signed to date.
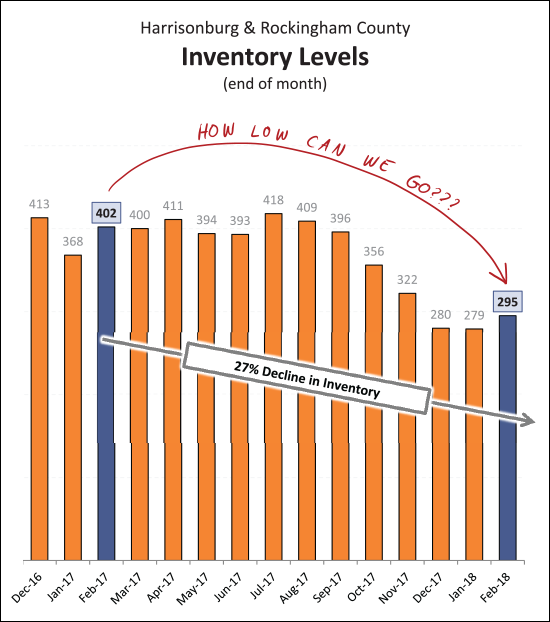
Oh yes, and don't forget about those sinking inventory levels. The decline in home sales we saw in our local market in 2017 is considered by many to have been at least partially caused by consistent declines in the number of homes listed for sale. We have seen inventory levels drop for the past few years -- and the 27% decline from 402 homes to 295 homes over the past 12 months certainly does not help provide enough homes for an increasing pool of buyers to purchase. We should (??!??) see an increase in these inventory levels as we get into the Spring market -- but that theoretical increase never substantially materialized last year.
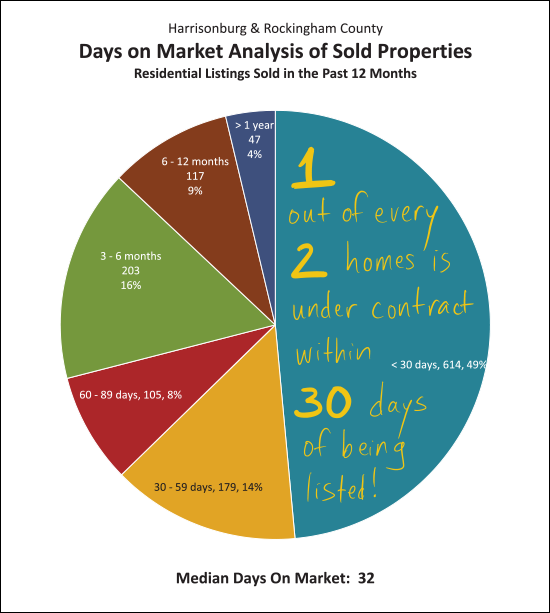
All of these market trends are tied up together, intertwined and interdependent upon each other. Here is another. One out of every two homes that sold in the past year (ok -- I rounded -- 49% if you need to know) went under contract within 30 days of being listed for sale. This low inventory environment is causing buyers to be extremely fast to view and then consider homes as they are listed for sale. OK -- I'll stop there for now. Again, you can download the full report as a PDF, read the entire report with commentary online, or keep reading my blog in the coming days for further commentary. AND -- if you're thinking of buying or selling soon --- SELLERS -- even though it is a seller's market in many price ranges right now, you must still focus on price, condition and marketing. For further reading on buying or selling in this area, check out.... Happy March! Recent Articles:
| |
| Newer Post | home | Older Post |
Scott Rogers
Funkhouser Real
Estate Group
540-578-0102
scott@funkhousergroup.com
Licensed in the
Commonwealth of Virginia
Home Search
Housing Market Report
Harrisonburg Townhouses
Walk Through This Home
Investment Properties
Harrisonburg Foreclosures
Property Transfers
New Listings

