| Newer Post | home | Older Post |
Contract Activity Cools Slightly After Strong Summer Surge in Home Sales in Harrisonburg and Rockingham County |
|
 Happy Monday Morning, Friends! We are just six days from the first day of Fall... and it's starting to feel like it! High temperatures are peaking in the 70's instead of the 80's this week... the leaves are starting to change colors... and we're back to having fun watching JMU football games...  My niece, Sofia, just started college at UNC Charlotte, so Luke and I were excited to go down to visit her and to take in the first JMU football game of the season. Here's looking forward to some further fun as the season continues! Go Dukes!!! Before we dive into the real estate data... as one last reminder of summer... I'm giving away a $50 gift card to Sweet Frog. Yes, I know, we can enjoy Sweet Frog all year round, but it's particularly tasty on a warm summer evening. So, if you're a fan of Sweet Frog frozen yogurt (and all the toppings!) click here to enter the gift card. And now, on to the latest in our local real estate market... 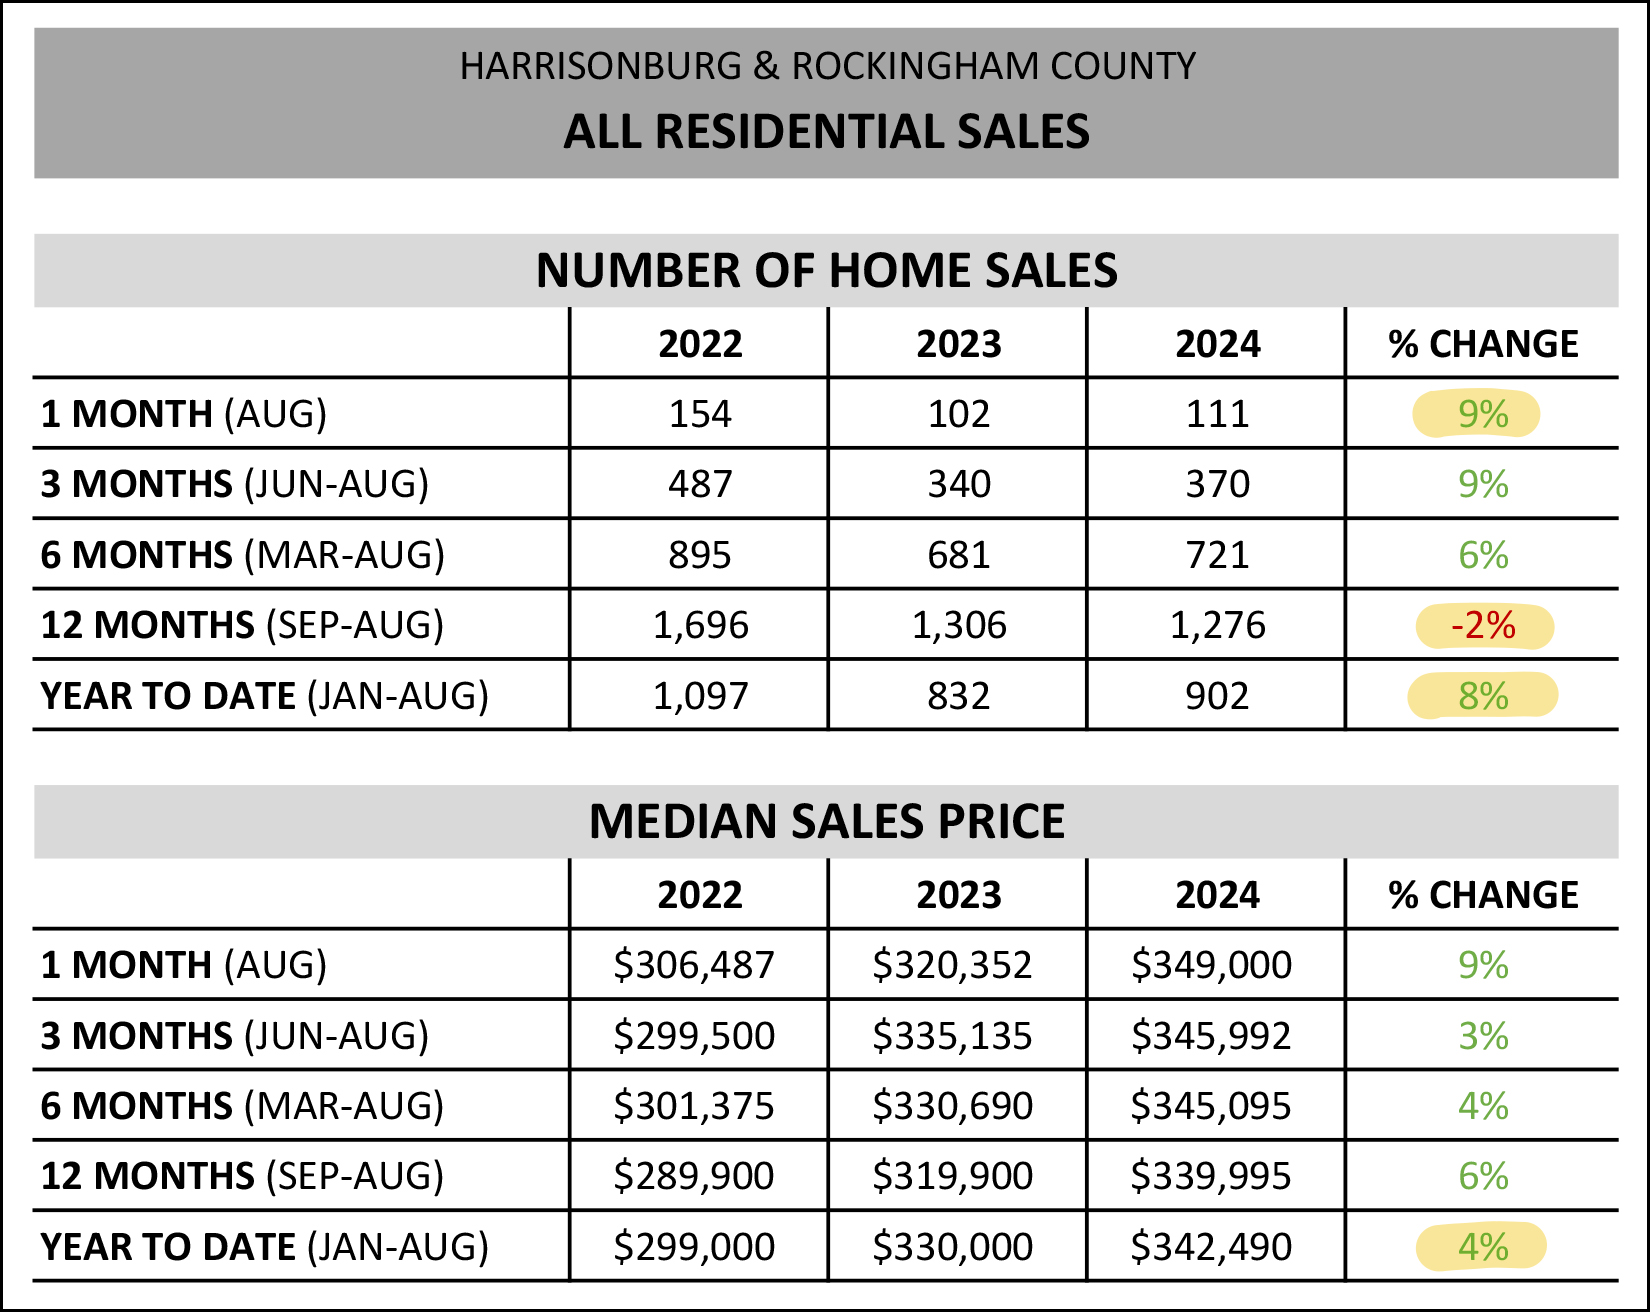 Above you'll see a basic overview of the amount of homes that are selling these days, and the prices at which they are selling. A few things to note... # Sales: We saw more home sales this August than last (+9%) and even though we've seen fewer home sales over the past 12 months compared to the prior 12 months (-2%) we are seeing an increase (+8%) in the first eight months of 2024 as compared to the same timeframe last year. So... more homes are selling this year than sold last year, and... Prices: In every time horizon I explored above (1M, 3M, 6M, 12M, YTD) I found an increase in the median sales price. I'll focus in on the year to date number, however, where we see a 4% increase in the median sales price when looking at homes selling in the first eight months of this year (median of $342,490) compared to the first eight months of last year (median of $330,000). As we continue, we'll want to see how the performance of different market segments compare to this market wide 4% increase in the median sales price. First up, detached home sales... 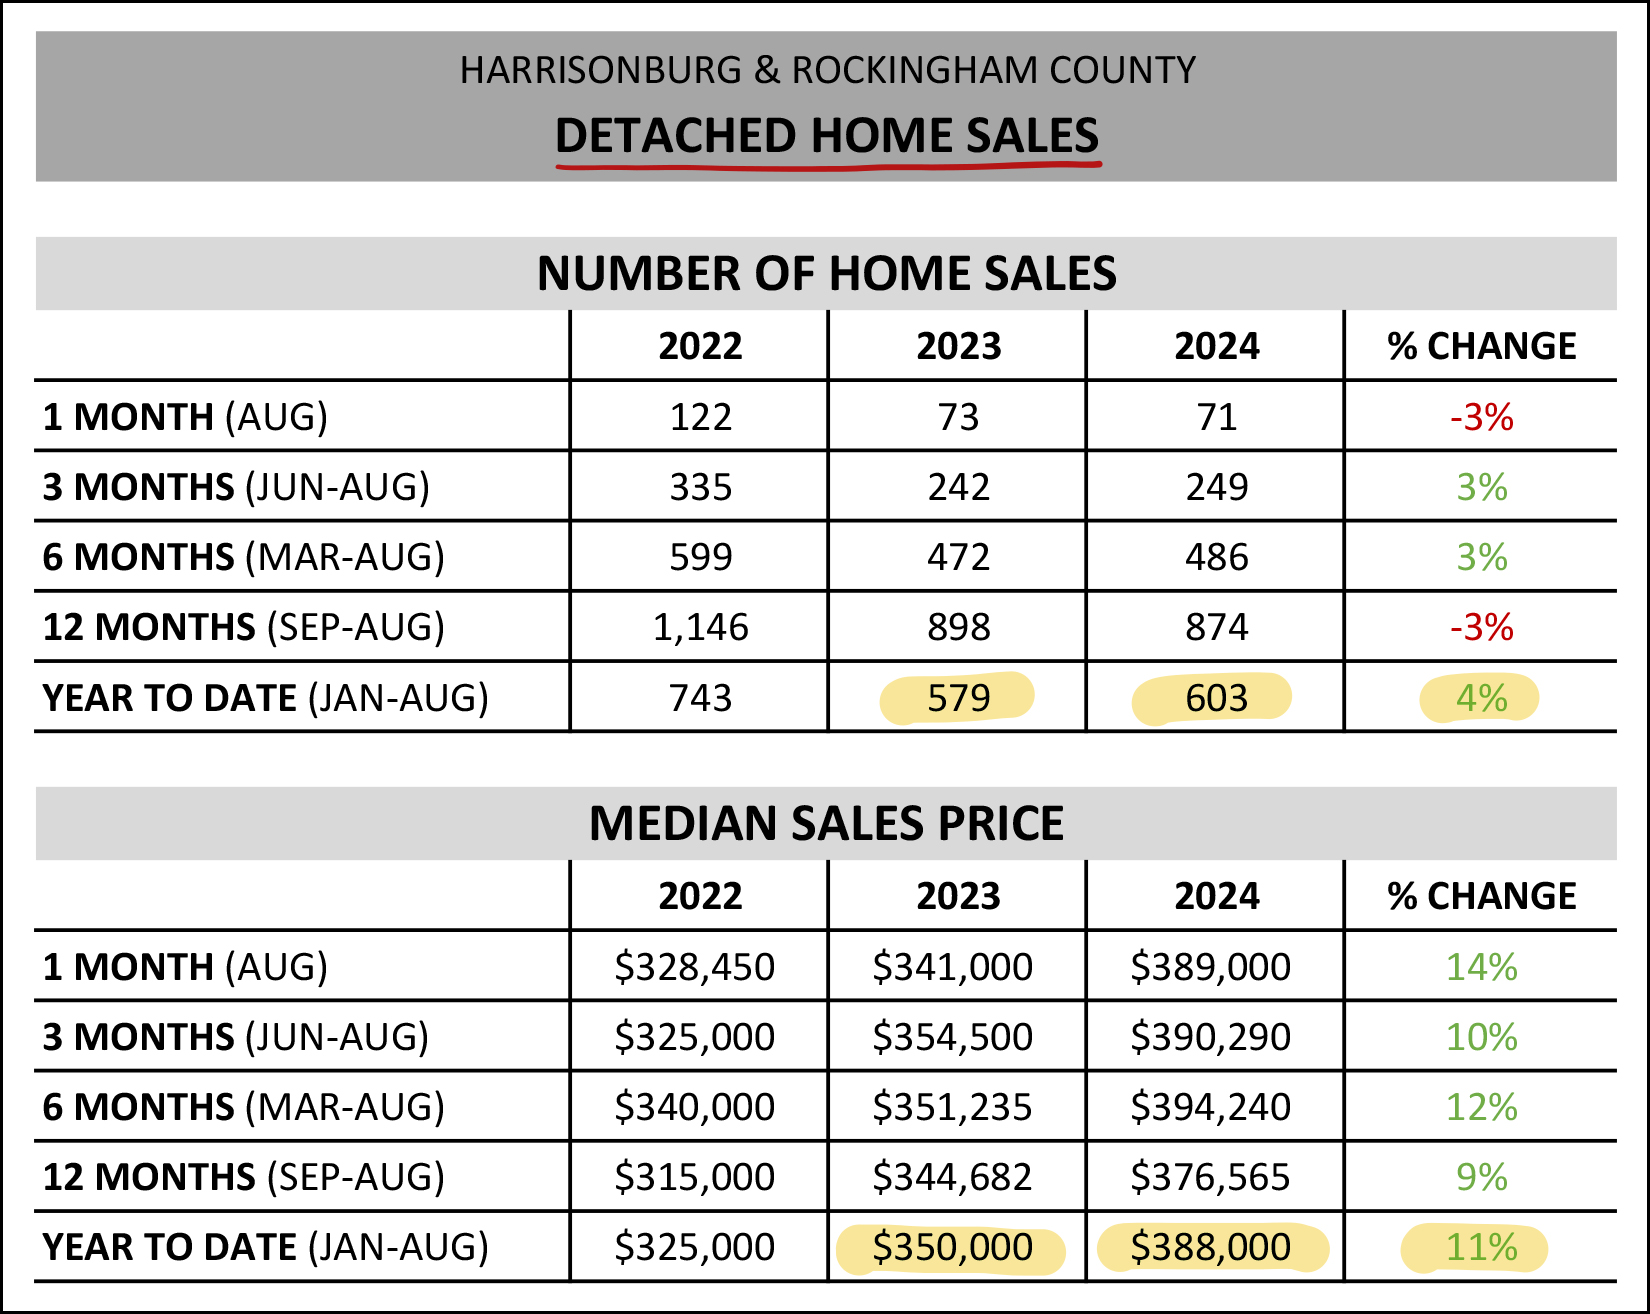 Interestingly... [1] Despite an 8% market-wide increase in home sales thus far in 2024... we're only seeing a 4% increase in the number of detached homes that are selling. [2] Despite only a 4% increase in the median sales price in the overall market (detached + attached) we're actually seeing an 11% increase in the median sales price of detached homes in 2024. As we continue through this report, you'll note a variety of charts and graphs that indicate that price growth is slowing to only 4%... but that is the overall market, whereas detached home median sales prices still seem to be climbing more quickly than the overall market. Dialing in now on one specific geographic area... the City of Harrisonburg... 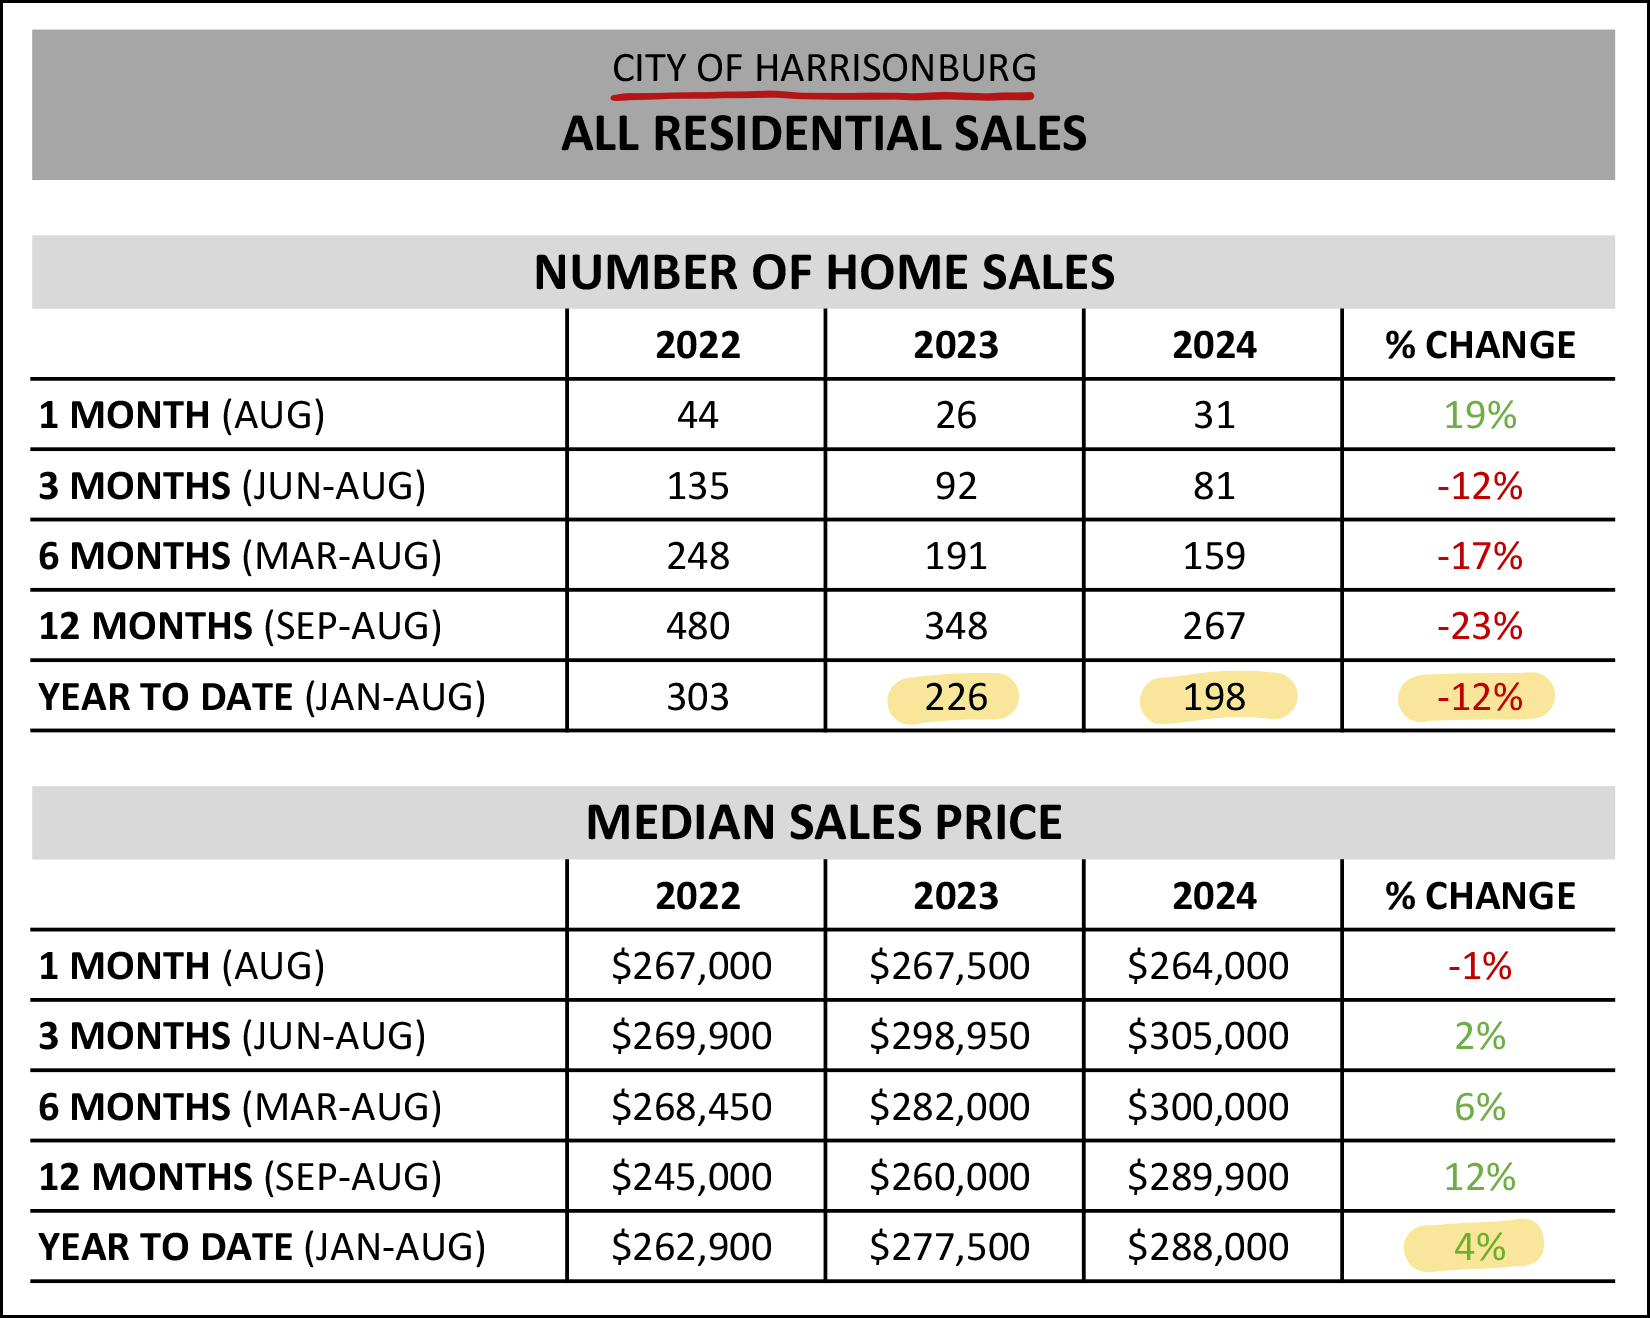 It has been increasingly difficult to find a house to buy in the City of Harrisonburg. As shown above, in the first eight months of 2022 we saw 303 home sales in the City, last year that dropped to 226 sales and this year only 198 sales. To be clear... this is almost entirely a supply side issue - there aren't enough property owners willing to sell their homes, and there isn't much new construction happening in the City these days. Despite that restriction in the market in the City of Harrisonburg, we are still seeing only a 4% increase in the median sales price when comparing the first eight months of this year to the first eight months of last year... and the median sales price in the City of Harrisonburg is still under $300K thus far in 2024. And how about out in Rockingham County? How are things going there? 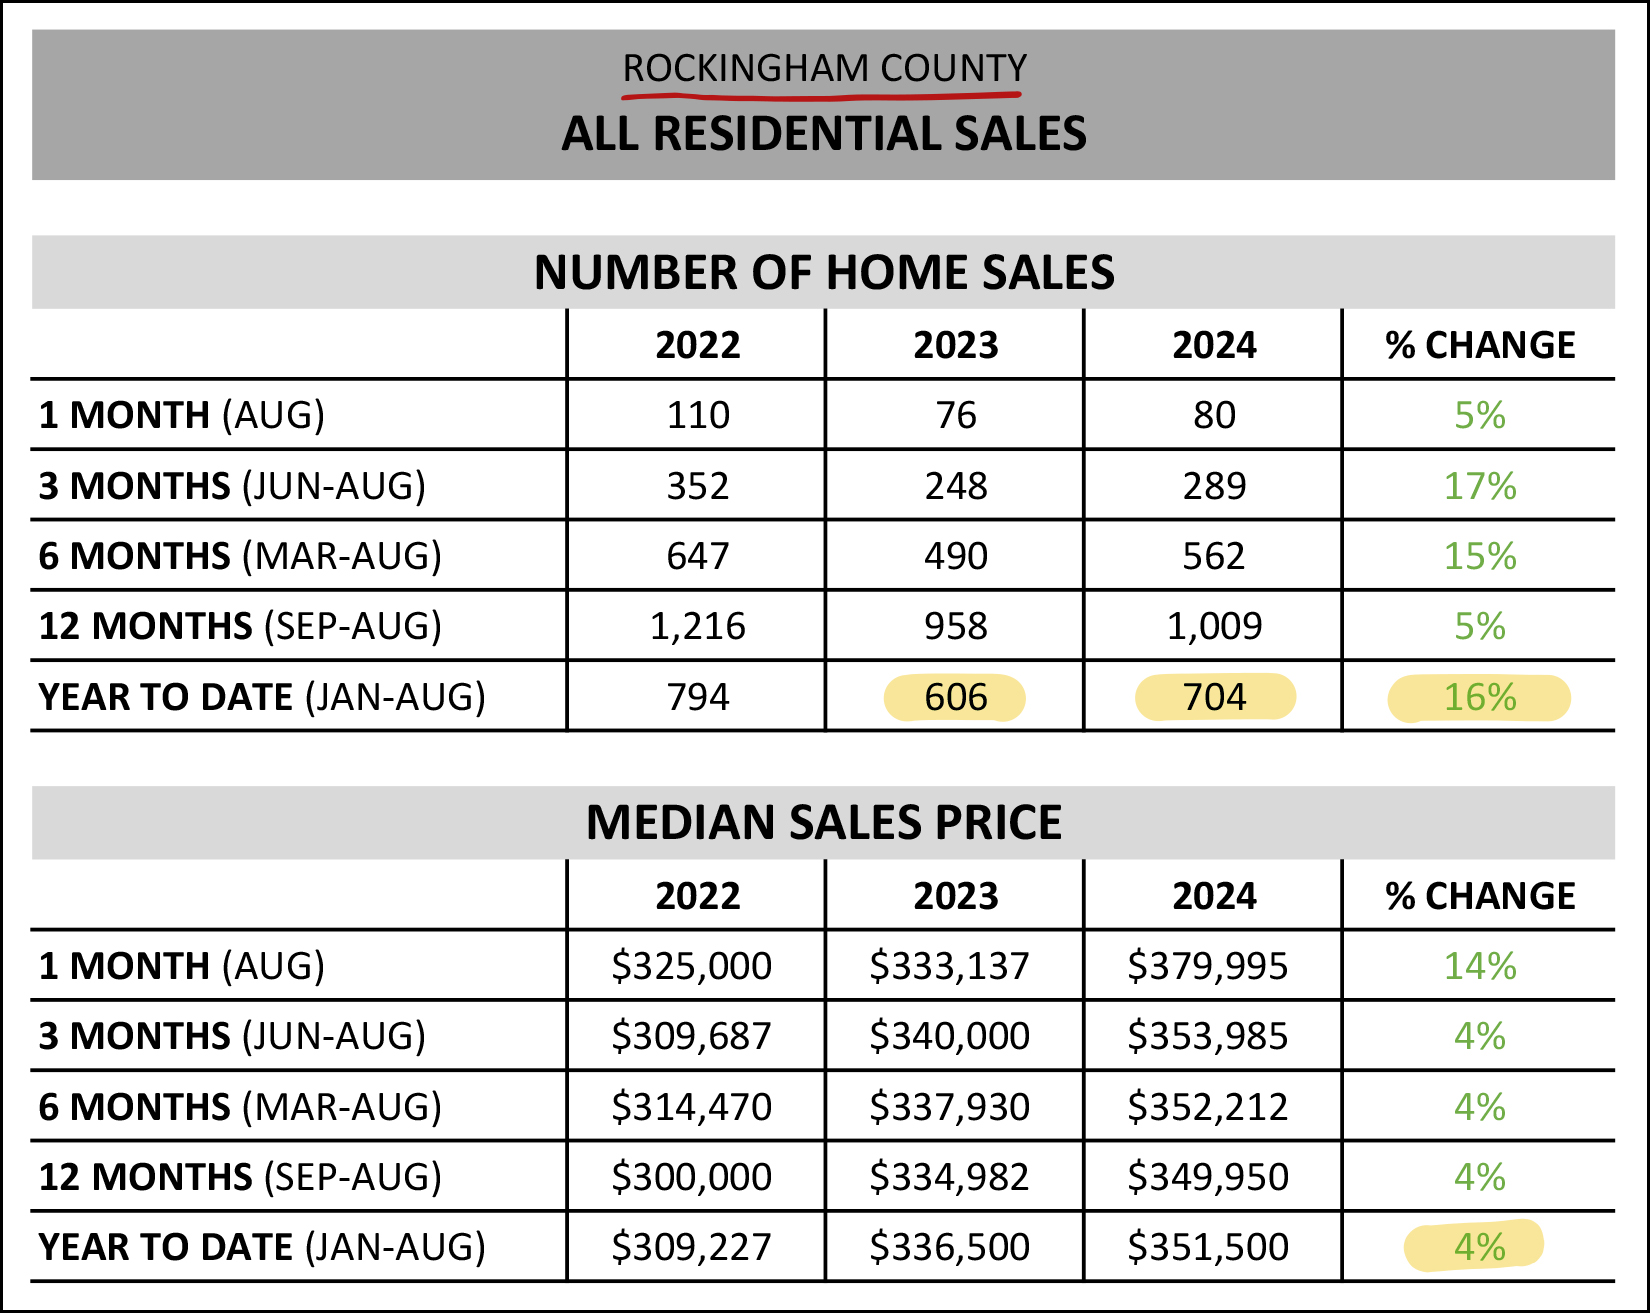 We are seeing a significant increase (+16%) in the number of homes selling in Rockingham County thus far in 2024 compared to in the same timeframe in 2023. You can't see it from the chart above, but a lot of that increase in the number of homes selling is a result of new homes being built in the County. Median prices, however, continue to rise in Rockingham County at that same 4% in the first eight months of 2024 compared to the same timeframe last year. New home construction... it's on the rise? Yes, indeed, it is... 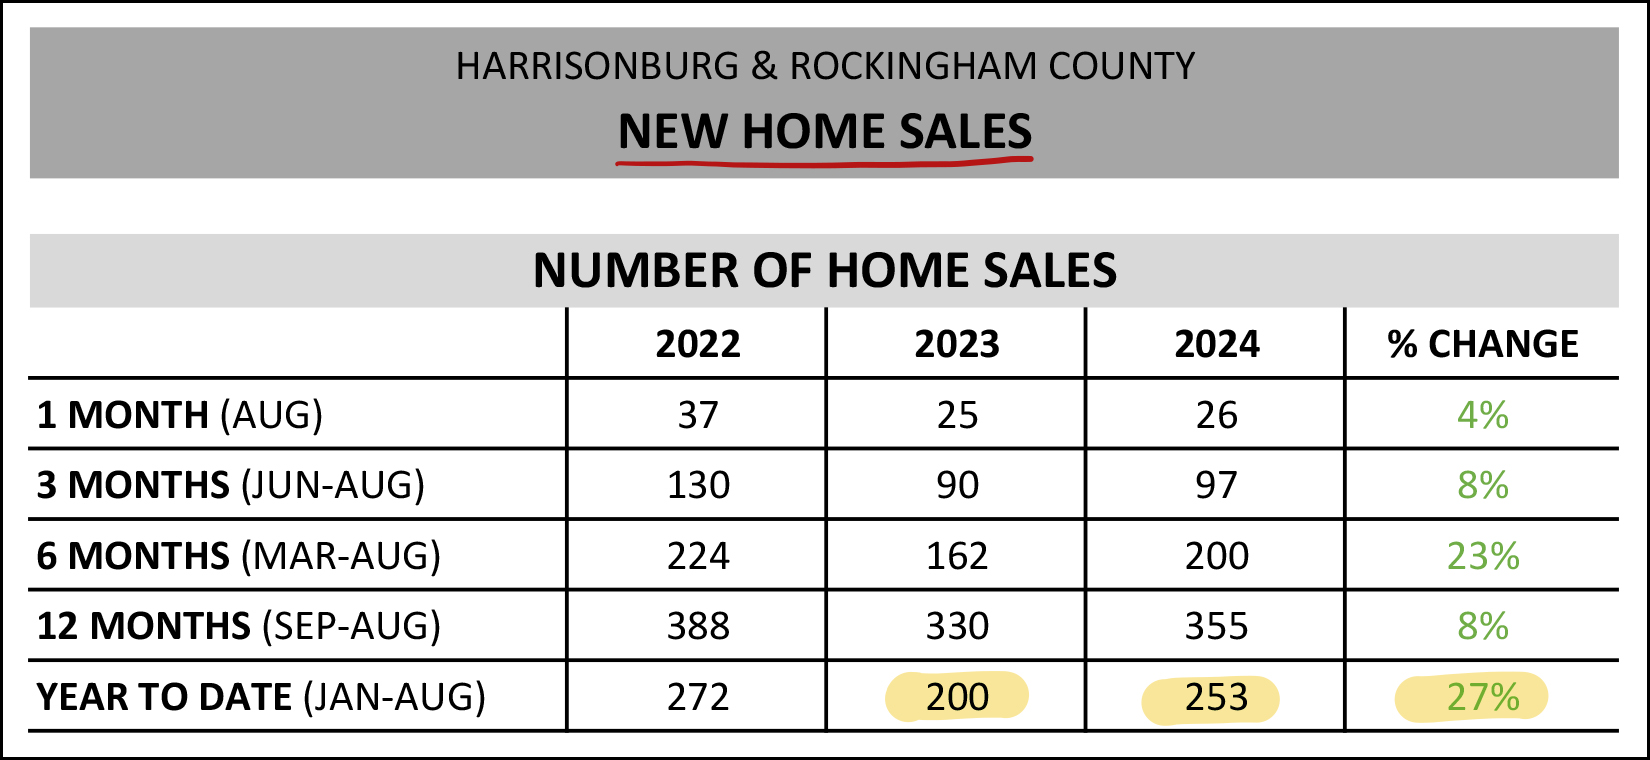 We've seen 253 new home sales thus far in 2024... which is a 27% increase from the first eight months of 2023... though interesting, it's slightly fewer than we saw two years ago, in 2022. I expect we will continue to see quite a bit of new home construction over the next few years... and we need it... as we continue to see high levels of demand from home buyers. So, if we're seeing a 27% increase in new home sales, how about those existing home sales? Are they also increasing at that pace? Ummm... nope... 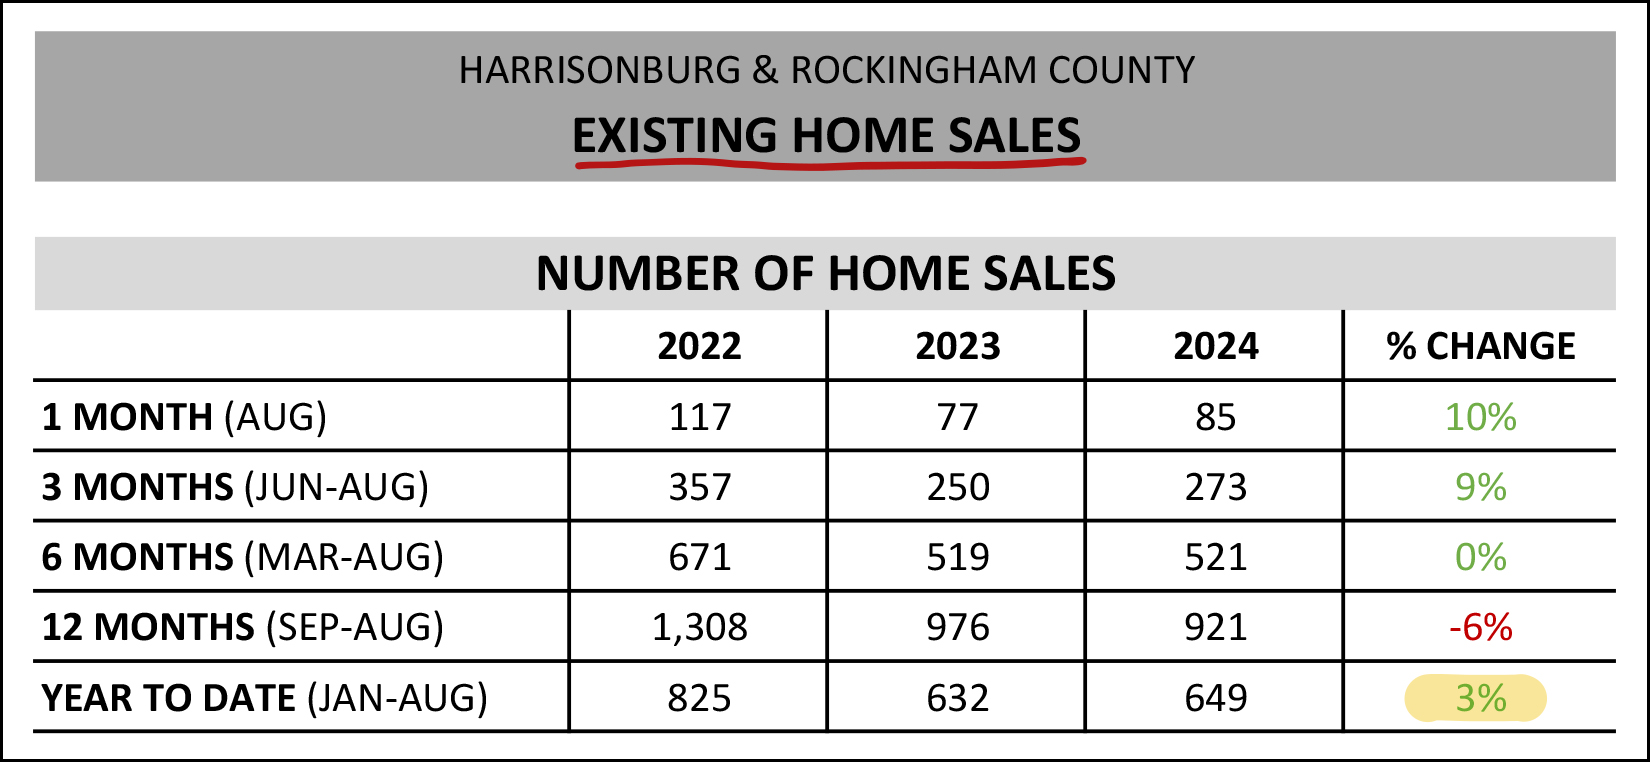 In contrast to the 27% increase in new home sales thus far in 2024... we have only seen a 3% increase in existing home sales. Lots and lots of homeowners are just staying put and not selling their homes. Now, let's get to some of the graphs, to get a clearer picture of some of the trends we have been discussing... 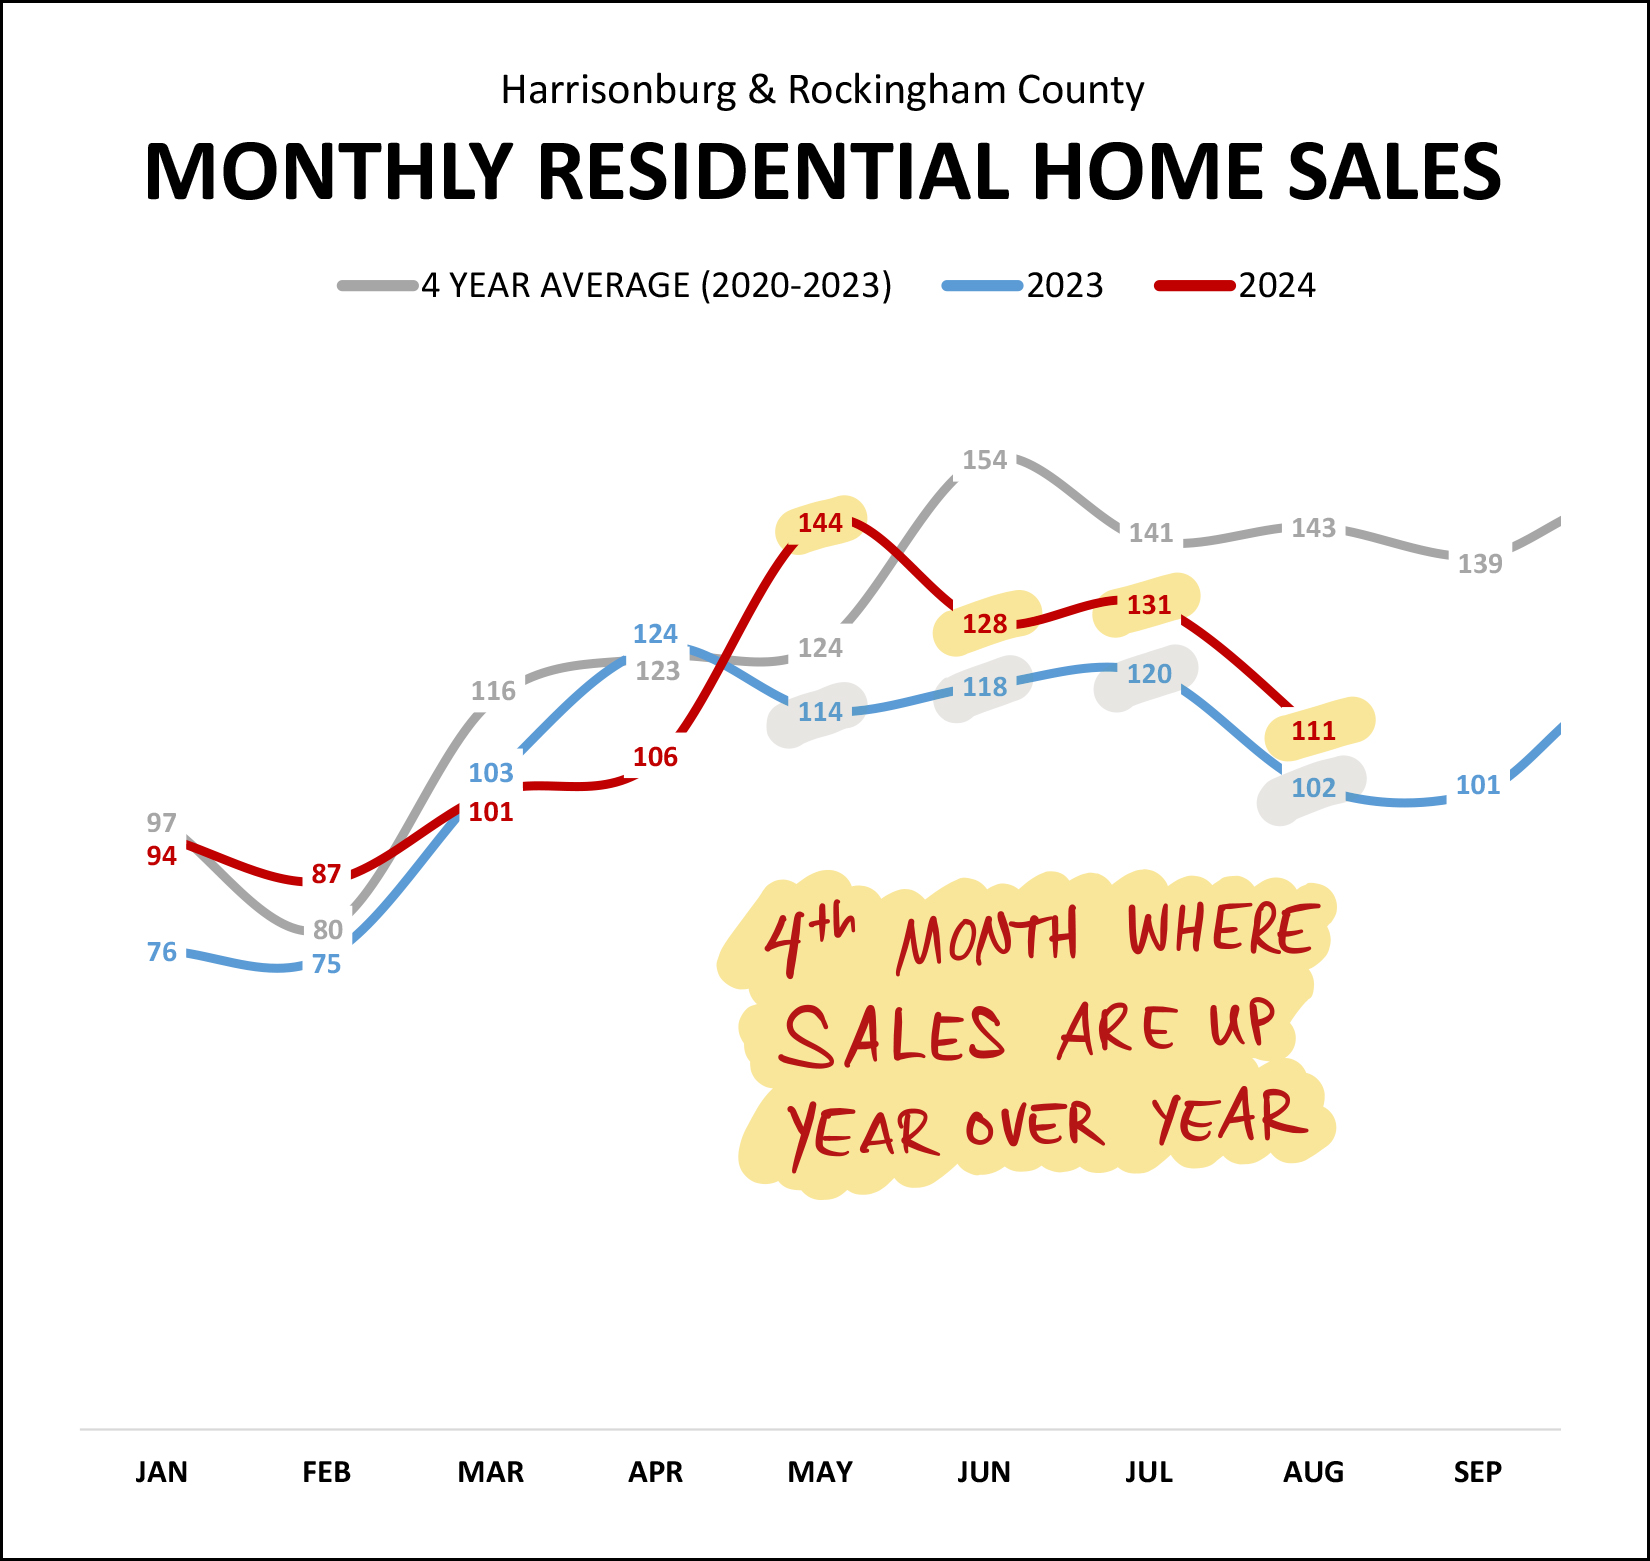 August marks the fourth month in a row with more home sales (closed home sales) than during the same month last year. This has been an active summer of real estate closings... though homes often go under contract a month or two before they make it to closing... so this busy summer of real estate closings was the result of a busy late Spring and early Summer of contracts, which we'll see shortly. To put this year in the context of the past two years... 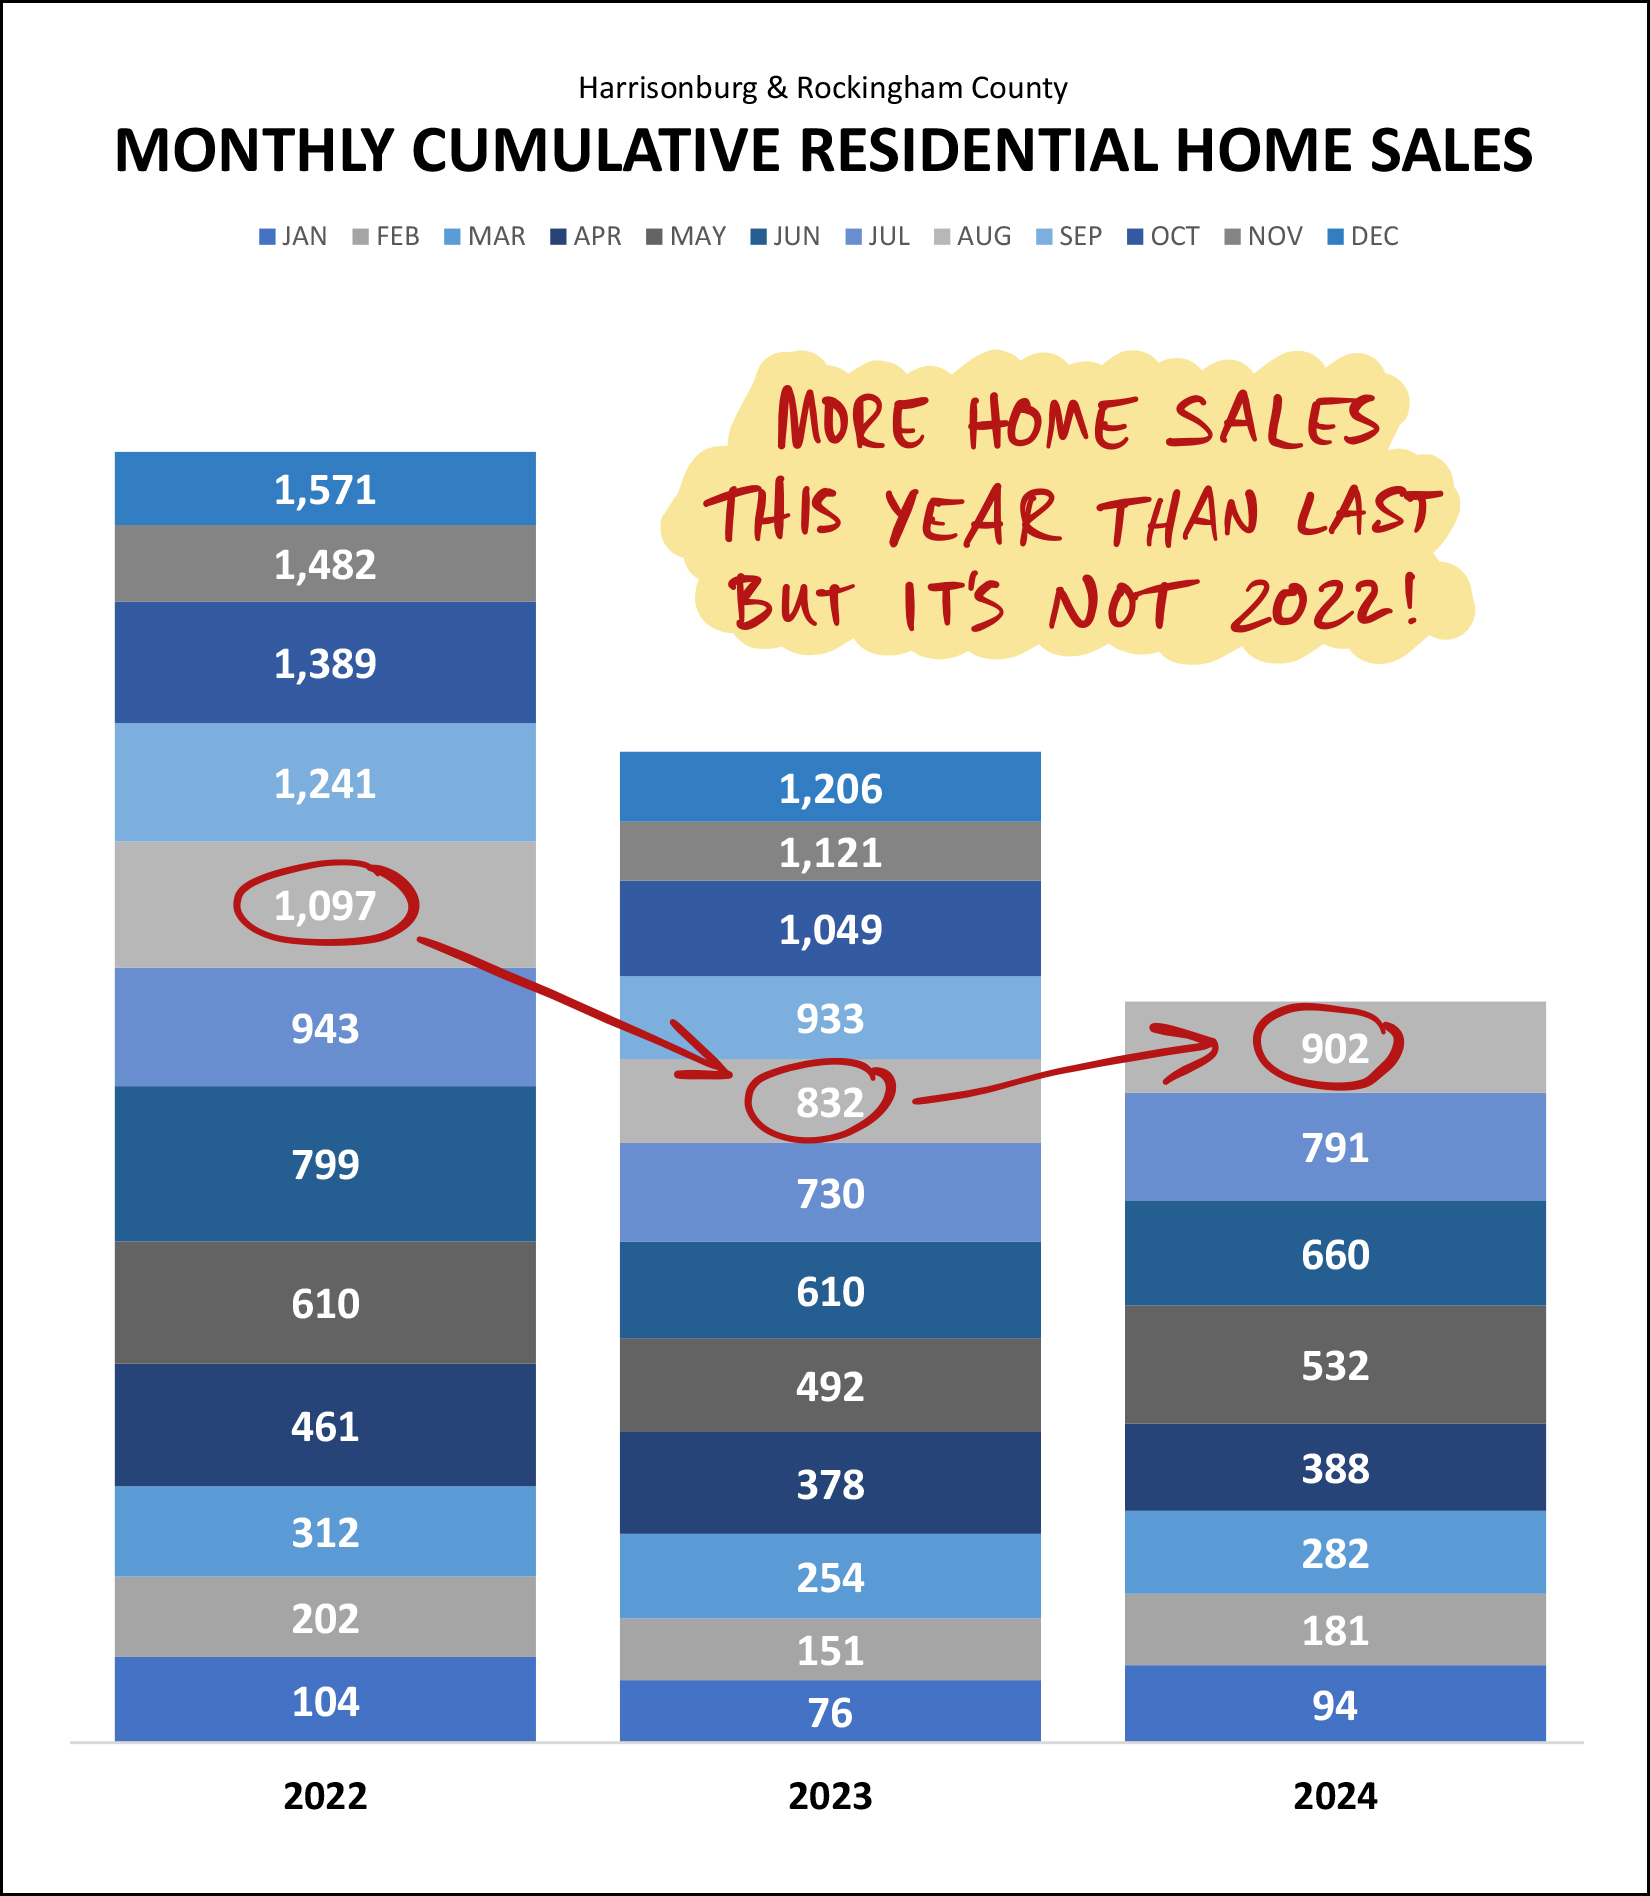 Home sales in 2024 are definitely exceeding 2023 levels... but pale in comparison to 2022. I expect we might see some further upward momentum in home sales later in 2024 if or when we see further relief in mortgage interest rates. More on that later. Here is an illustration of the two overall trends we're seeing right now in Harrisonburg and Rockingham County... 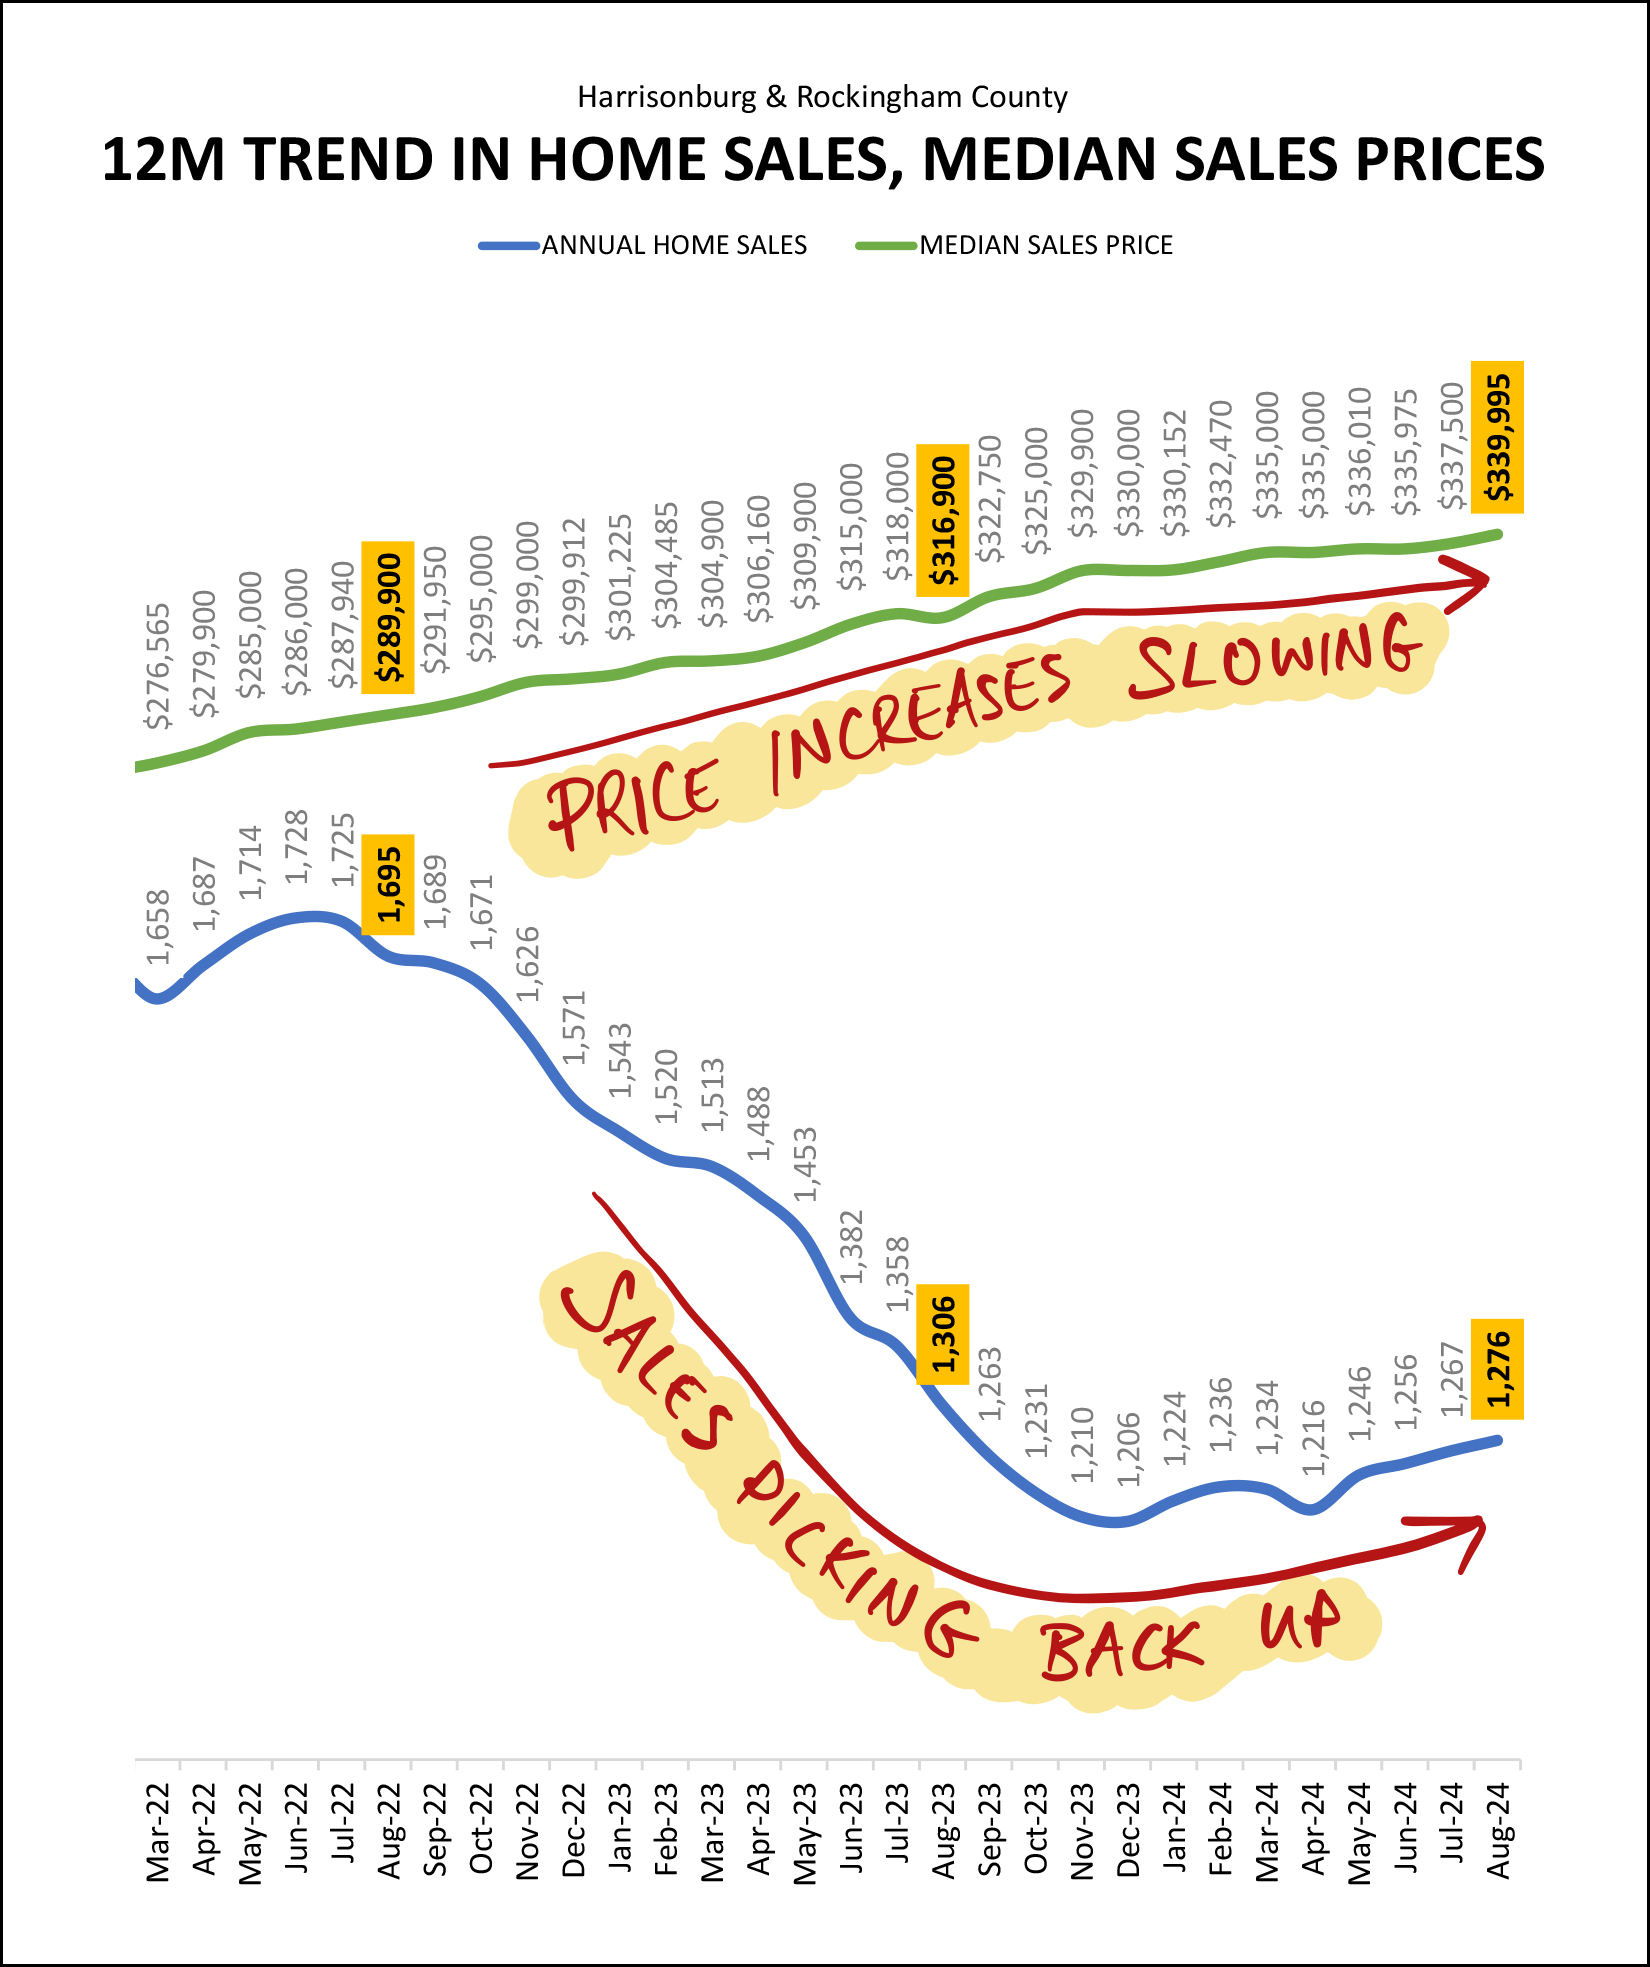 First off, at the top, home price growth is slowing. Testing your reading comprehension and short term memory... do you recall that the overall market is seeing only a ___% increase in the median sales price while the detached home segment of the market is seeing an ___% increase in the median sales price? ;-) Overall Market = 4% increase; Detached Homes = 11% increase. And... that second line (the blue one) at the bottom... shows us that aver steady declines from over 1,700 sales a year down to about 1,200 sales a year, we are now seeing some overall increases in the number of homes selling in our market. Back to those detached homes for a moment... 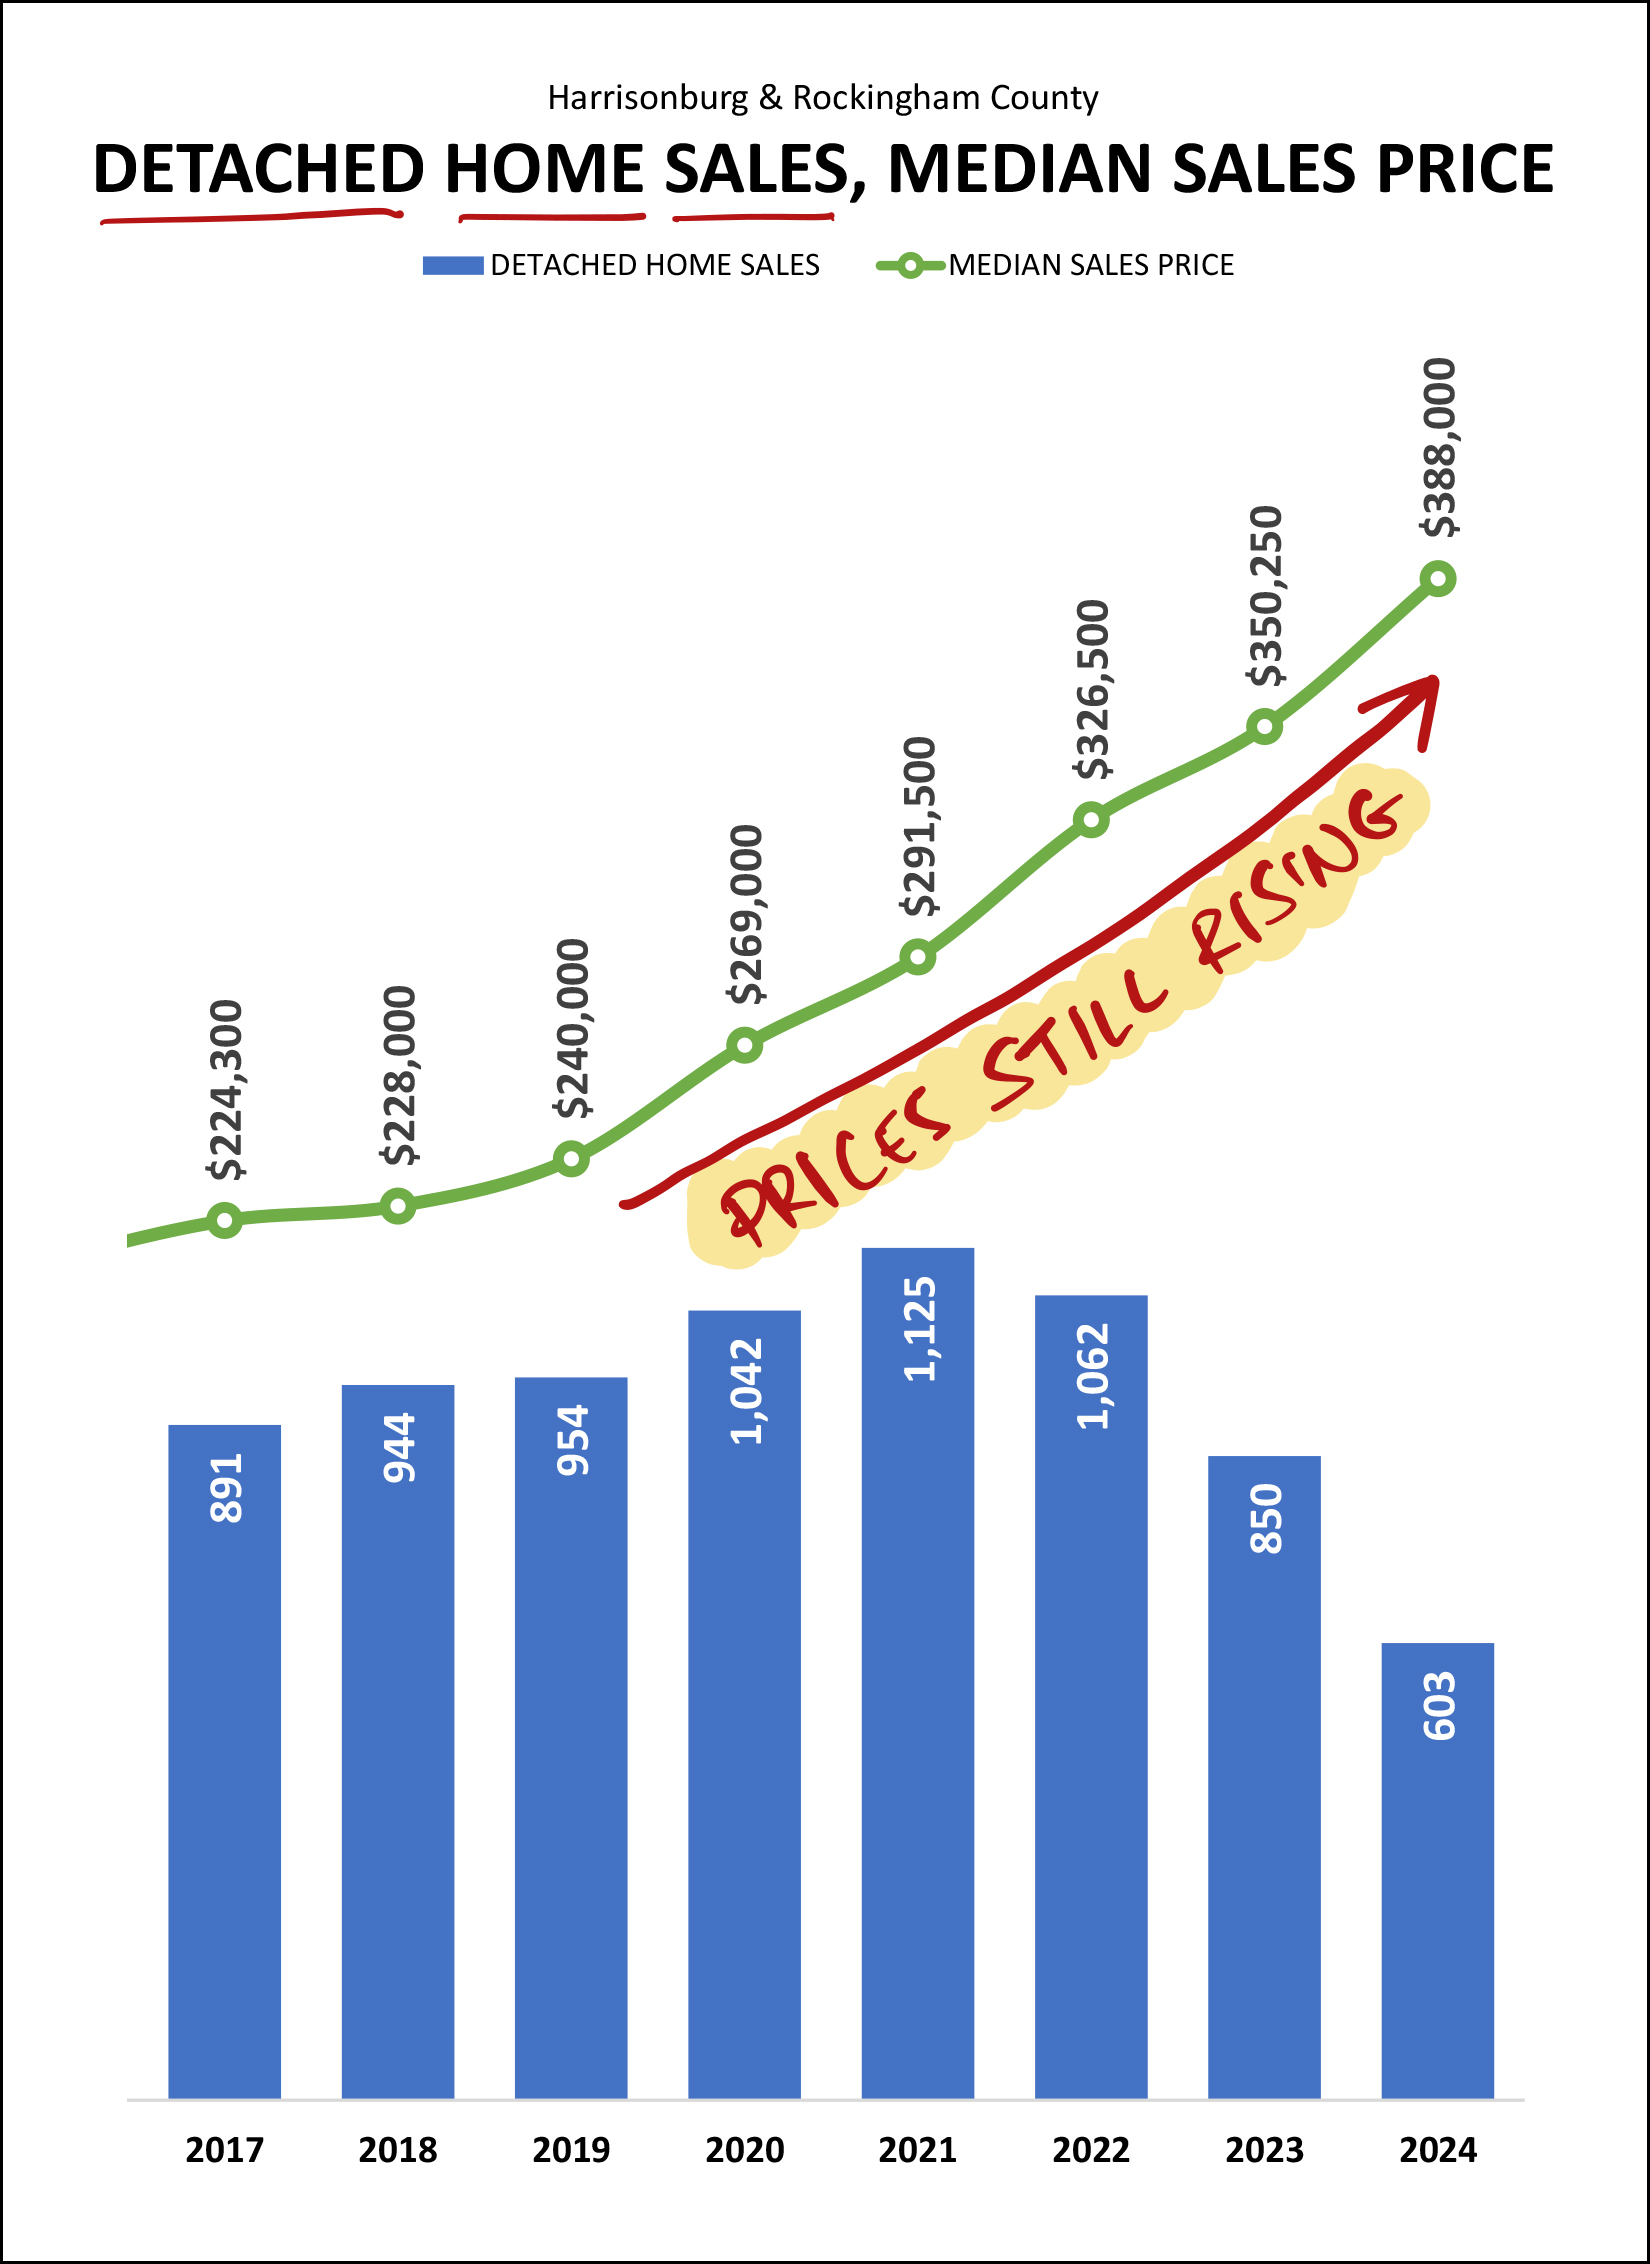 Here's you'll note the *absence* of a flattening out of the median sales price line in green. While the overall market is only seeing a 4% increase in median sales prices in 2024, thus far this year detached homes have been selling at prices that are 11% higher than last year. Earlier I talked about a busy summer of closings which was a result of earlier contract activity. This next graph shows current contract activity, which is a predictor of home sales activity over the next month or two... 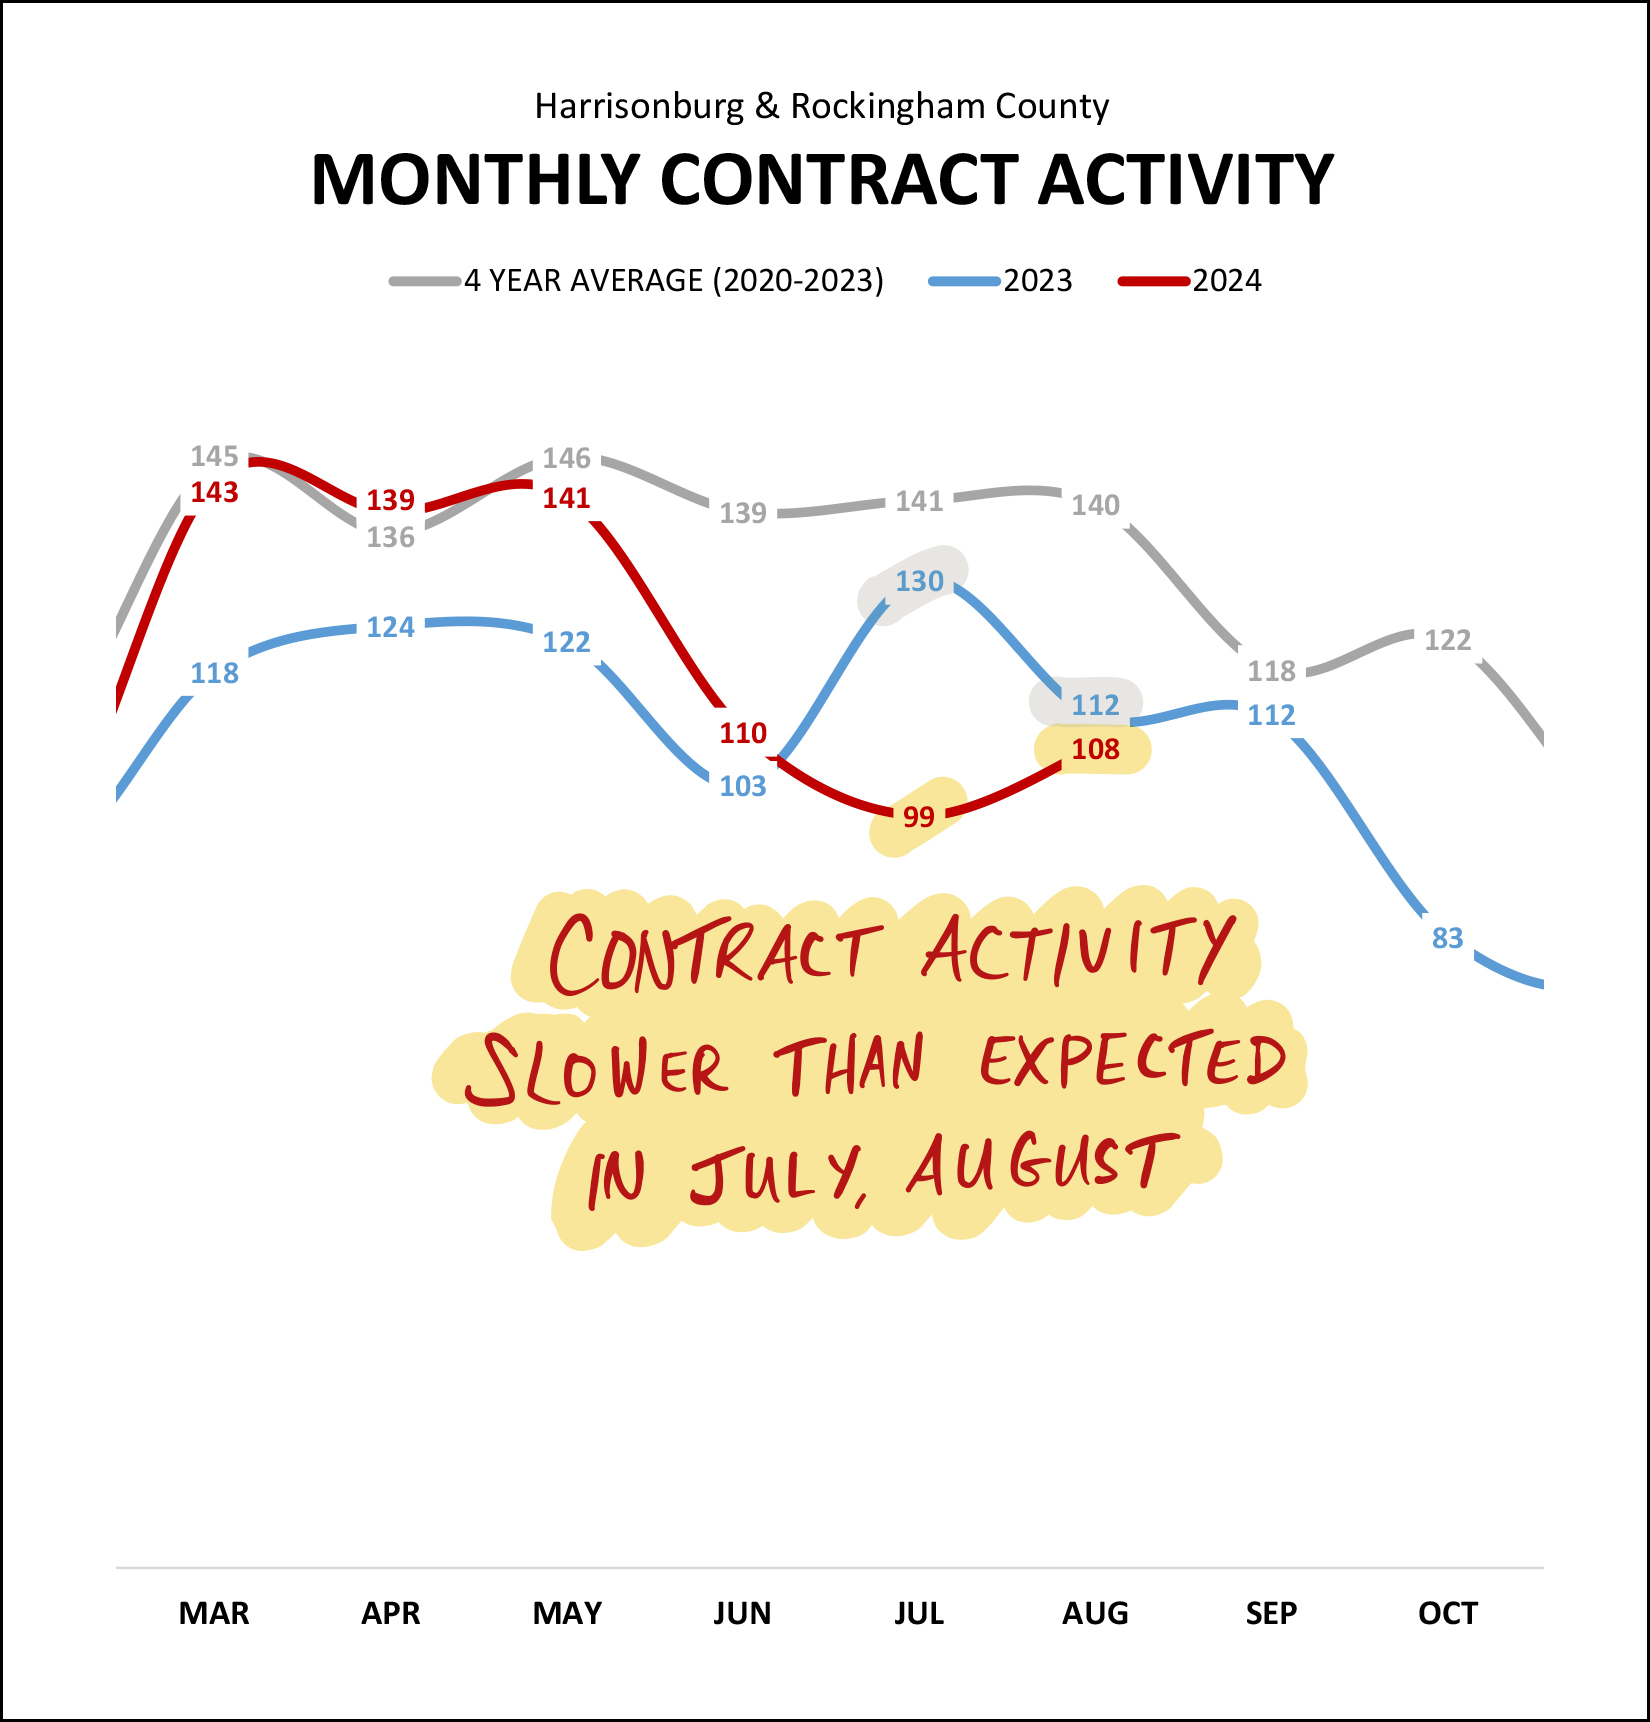 On the left side of the graph above you can see quite a few months of much higher contract activity this year (red line) than last year (blue line) -- particularly in March, April and May. But then, contract activity declined in July and August to levels below where we were a year ago. Looking ahead, we will most likely see a similar number of homes going under contract in September as we did in August, before contract activity likely starts to decline even further in October. This recent slow down in contract activity has also shown up in the pending sales metric, which tracks how many homes are under contract at any given point... 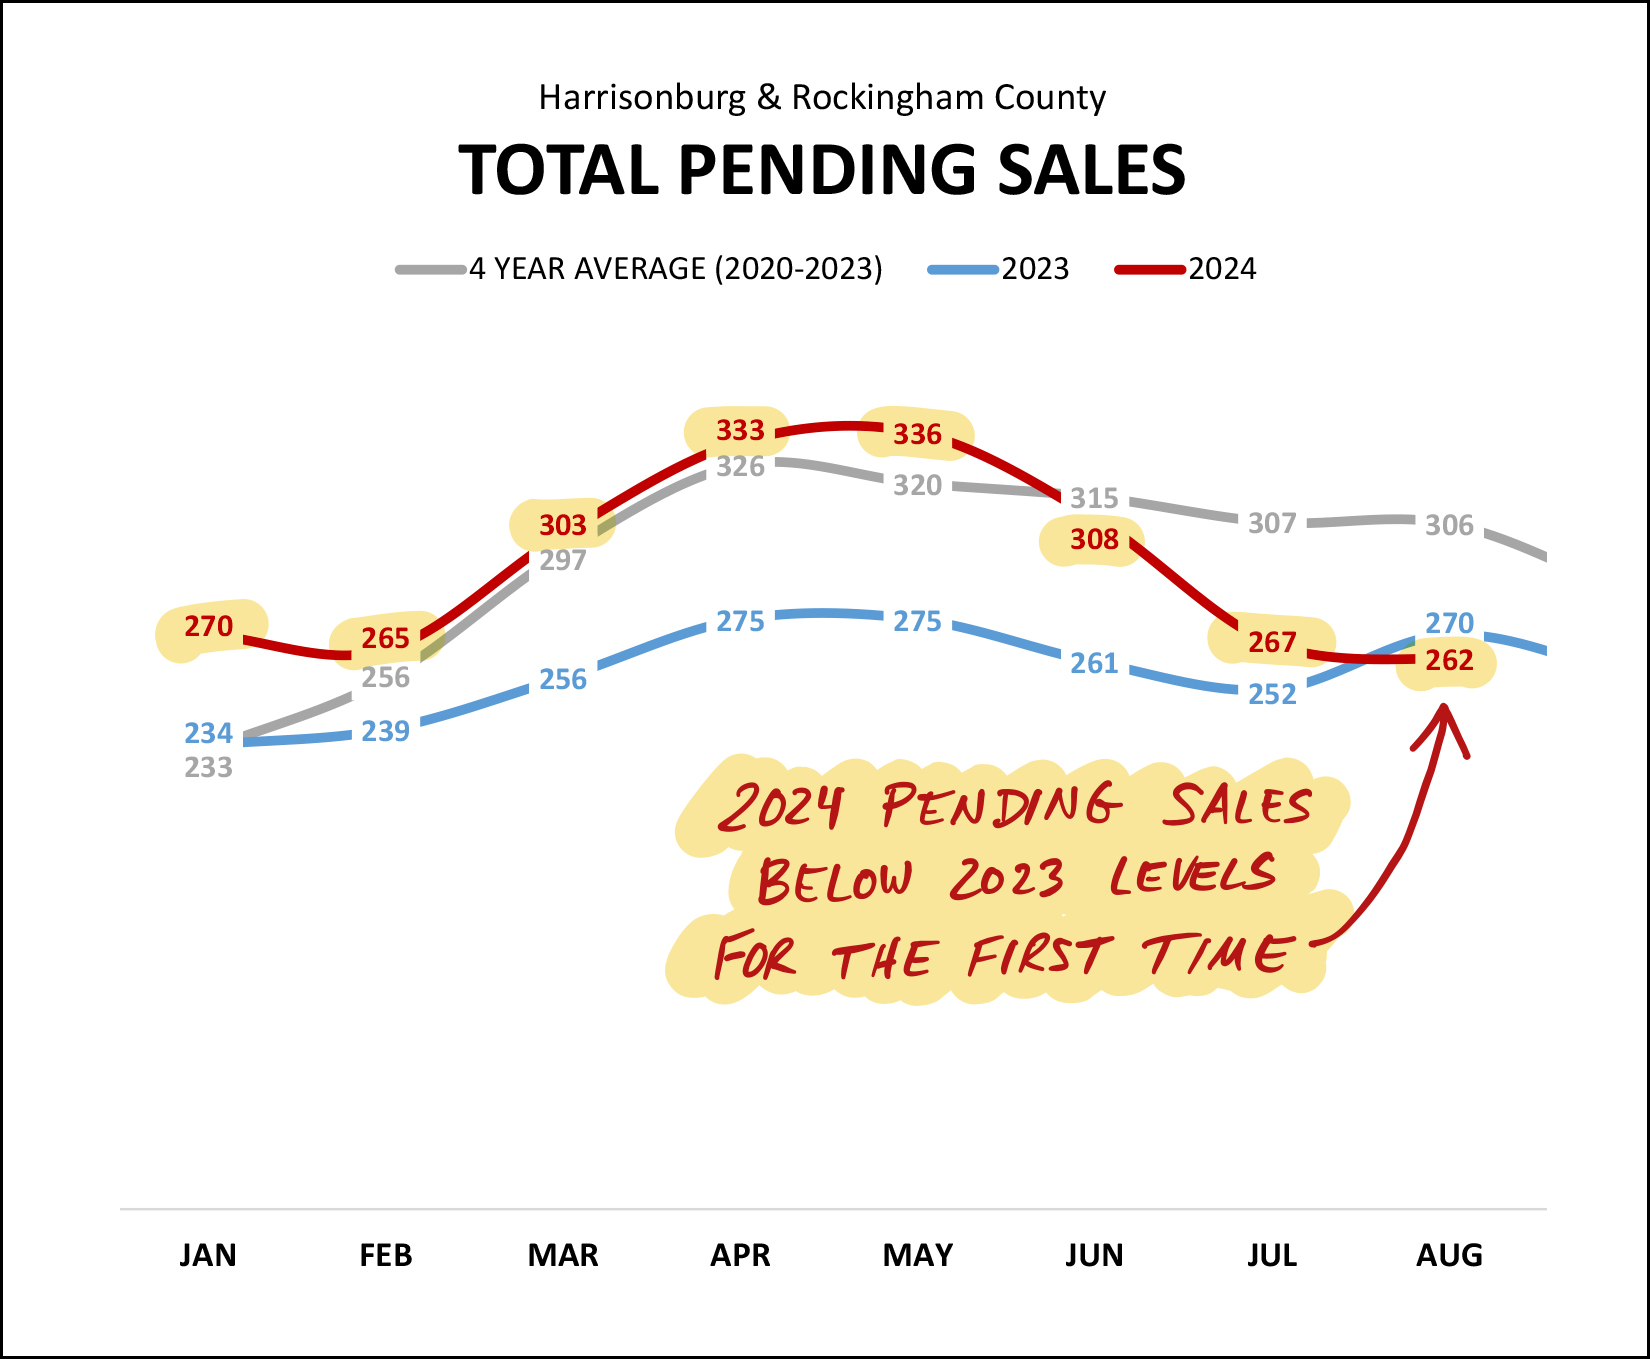 After seven months of riding high above 2023 levels, we have now seen pending sales drop below 2023 levels in August. This is mostly a result of slower months of contract activity in July and August. It's certainly possible that we'll see pending sales pop back up again as we work our way through September and October... but the 2023 and 2024 trajectories have crossed as of the end of August. But wait... if pending sales are declining, that must mean inventory is rising? 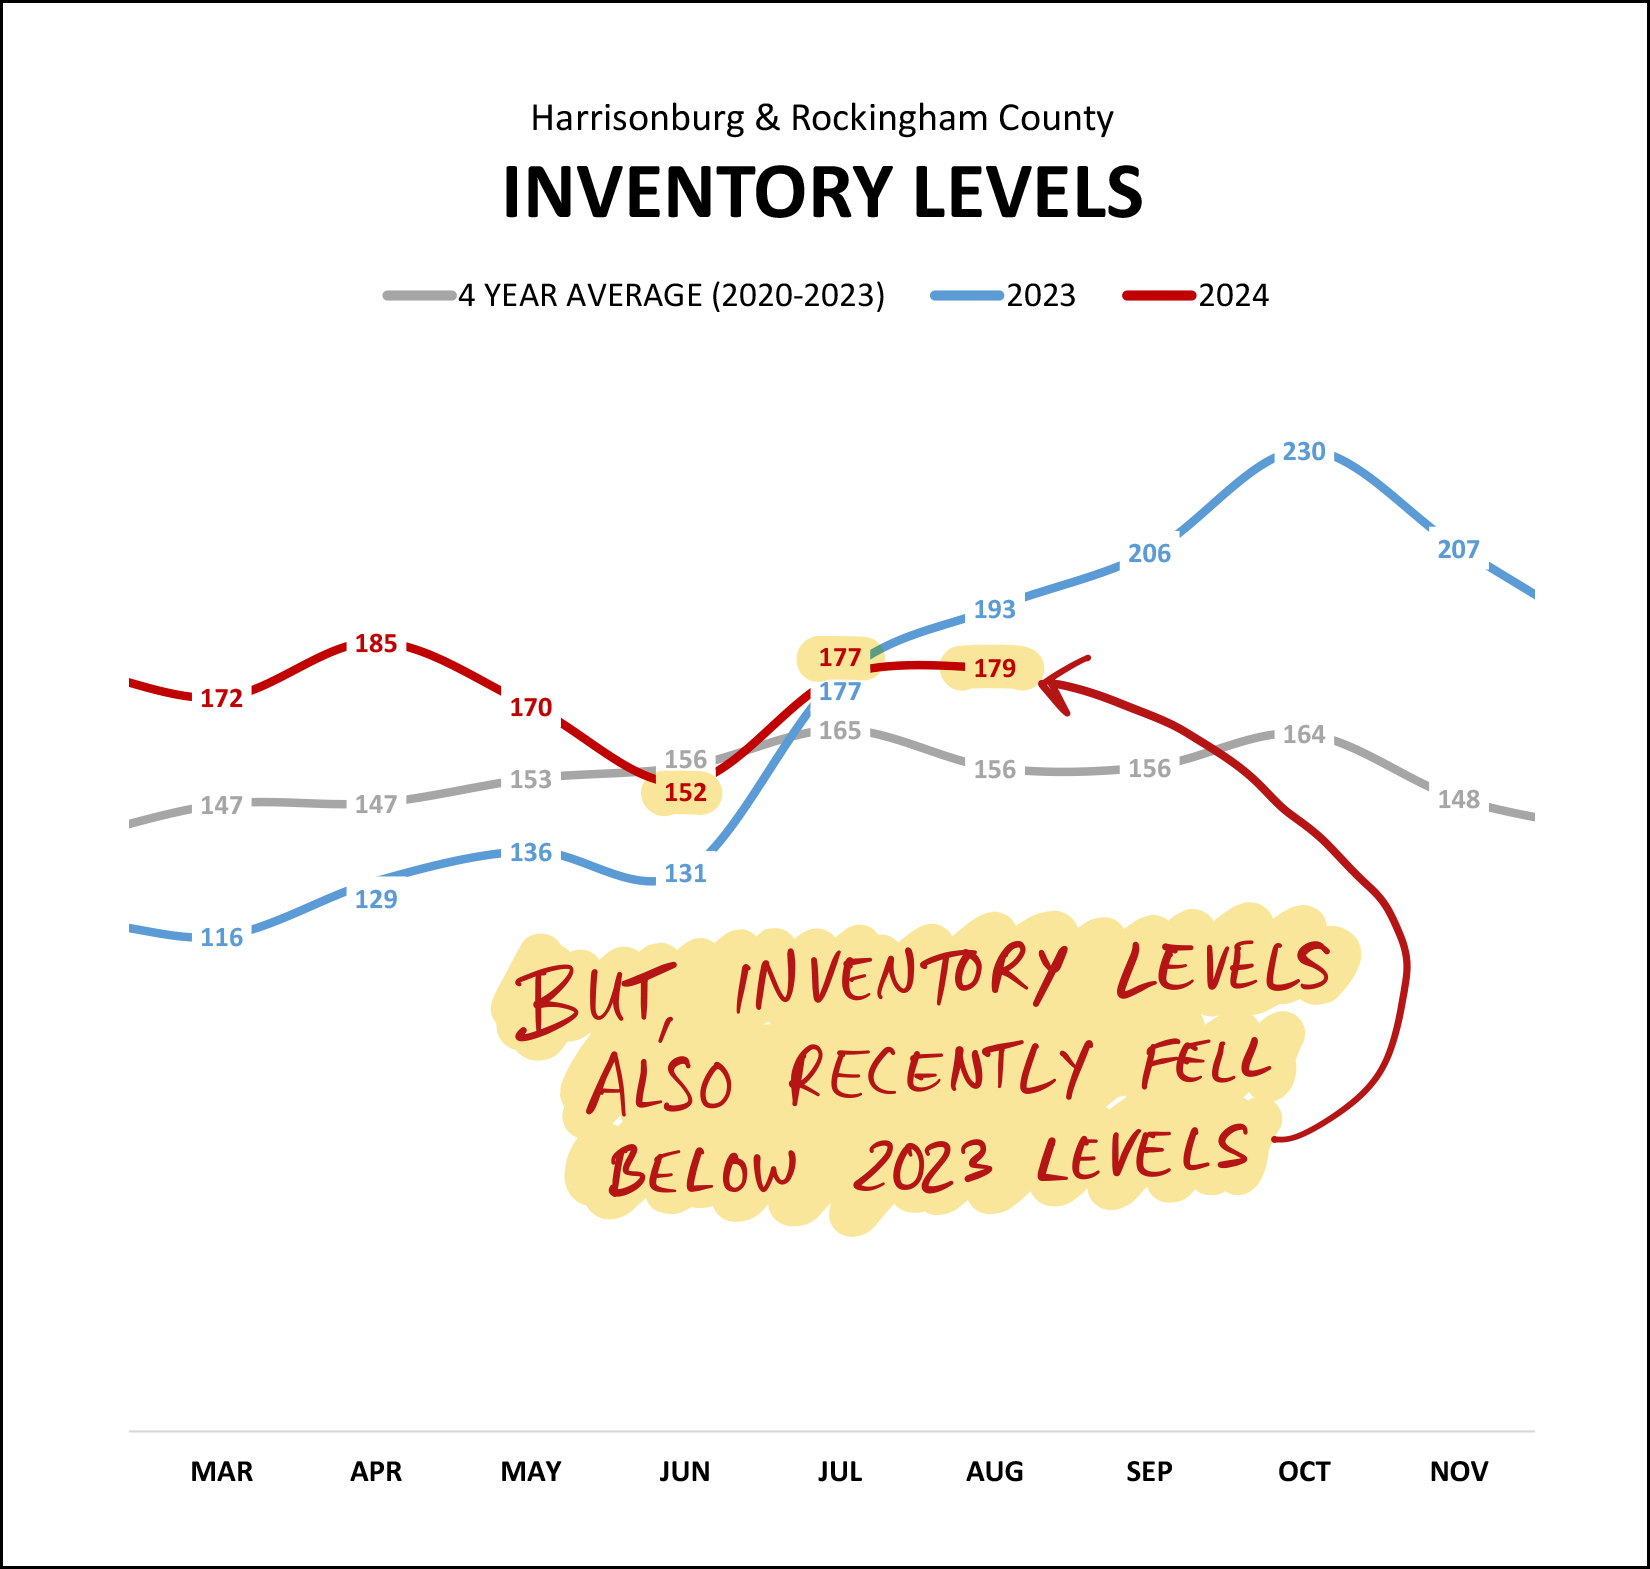 Sorta kinda. Inventory levels dropped to their lowest levels at the end of June... but rose again in July and remained steady at that point in August. Of note... inventory levels consistently climbed last year between June and October... but that was during the exact same timeframe when mortgage interest rates were climbing to their highest levels in 20 years. I do not expect that we will see inventory levels climb that high in September and October this year. But speaking of climbing... will days on market start to climb soon? 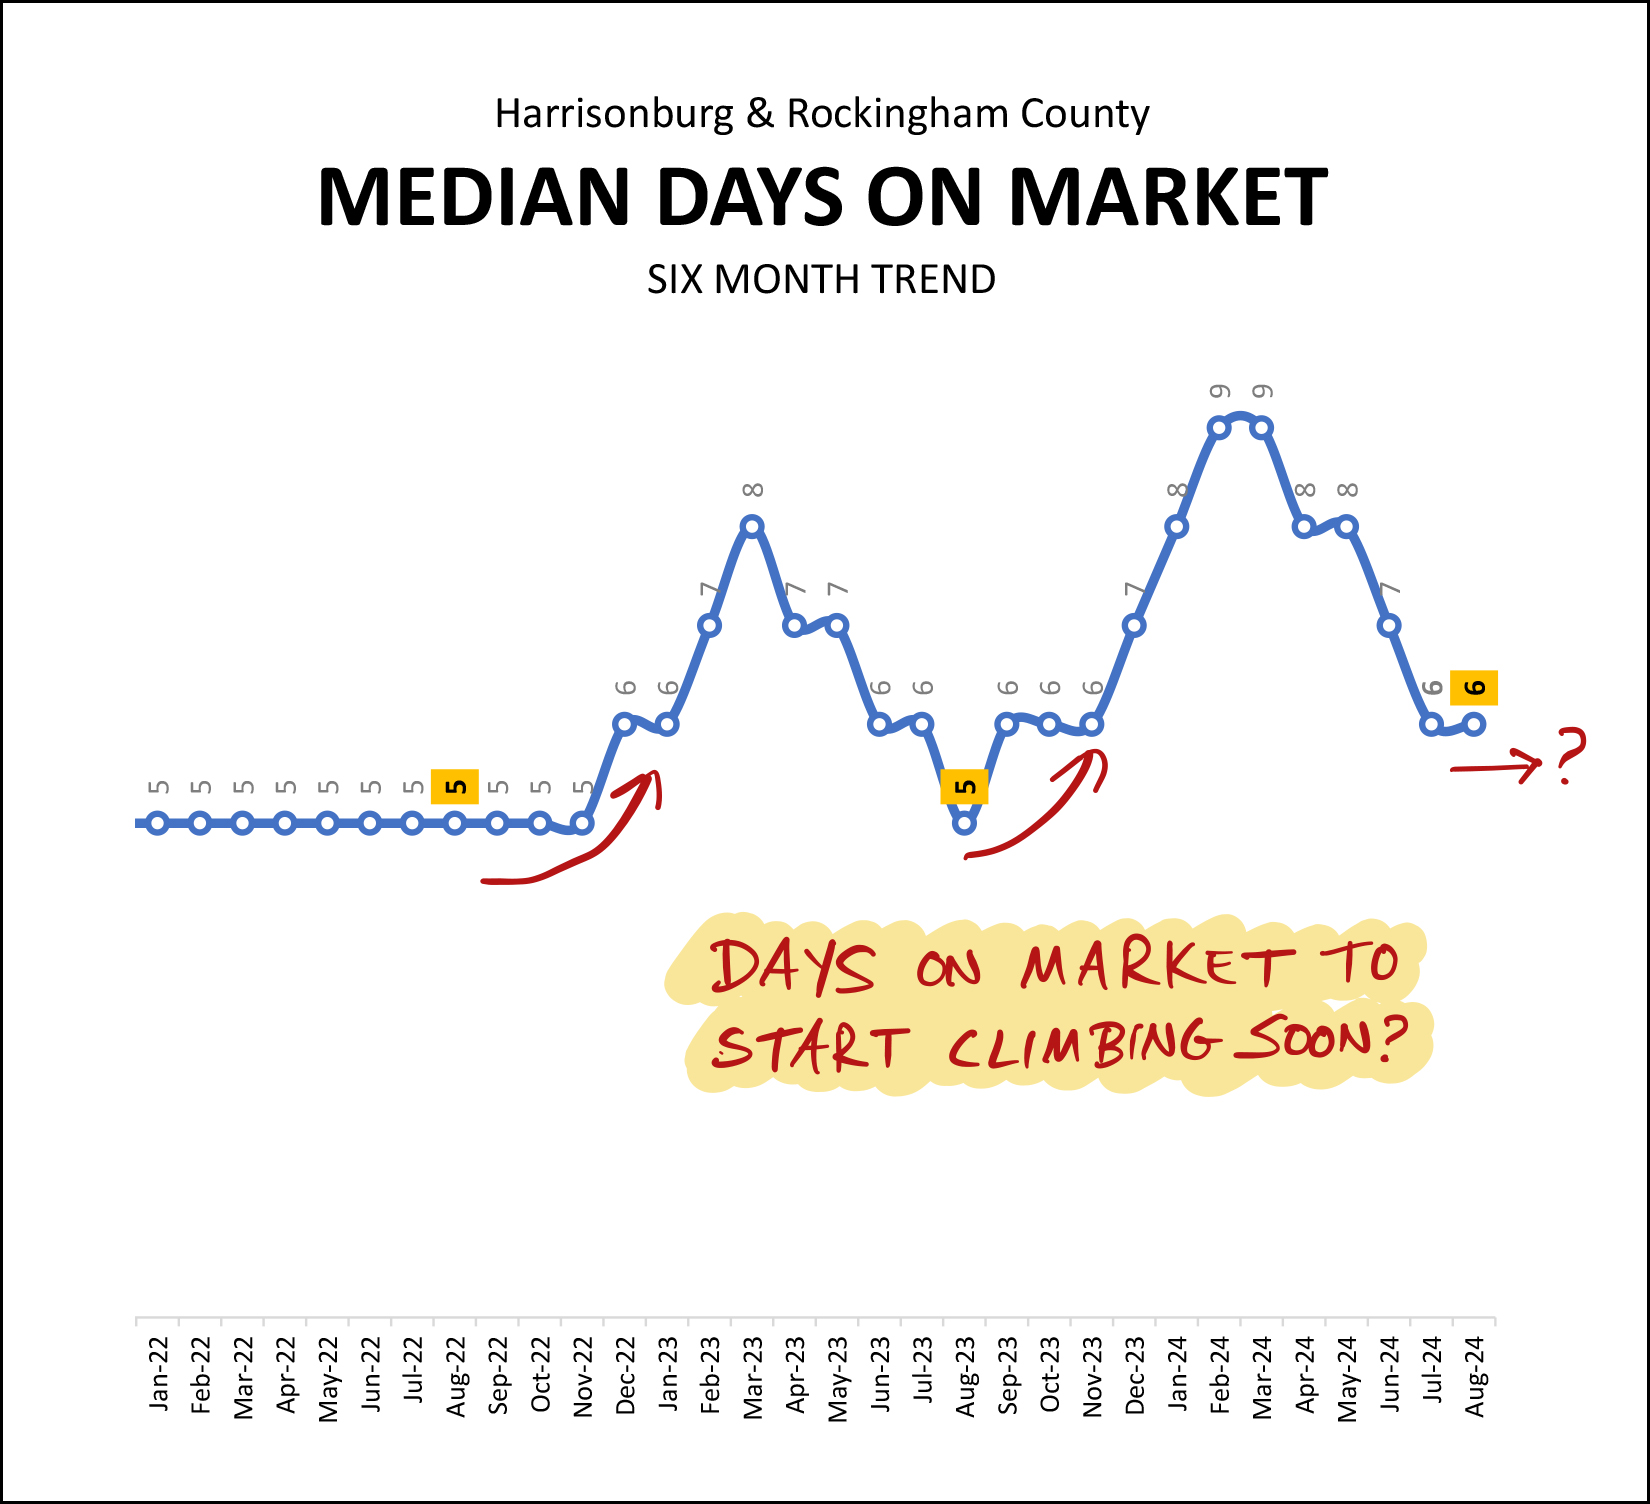 After quite a few years of absurdly, consistently low median days on market, we have seen some variability in this metric over the past two years. That pace at which homes go under contract (days on market) slowed during each of the past fall/winter seasons, so perhaps we'll start seeing that again in 2024. Finally, that one little (or big) number that seems to have been having an oversized impact on the housing market over the past few years... mortgage interest rates... 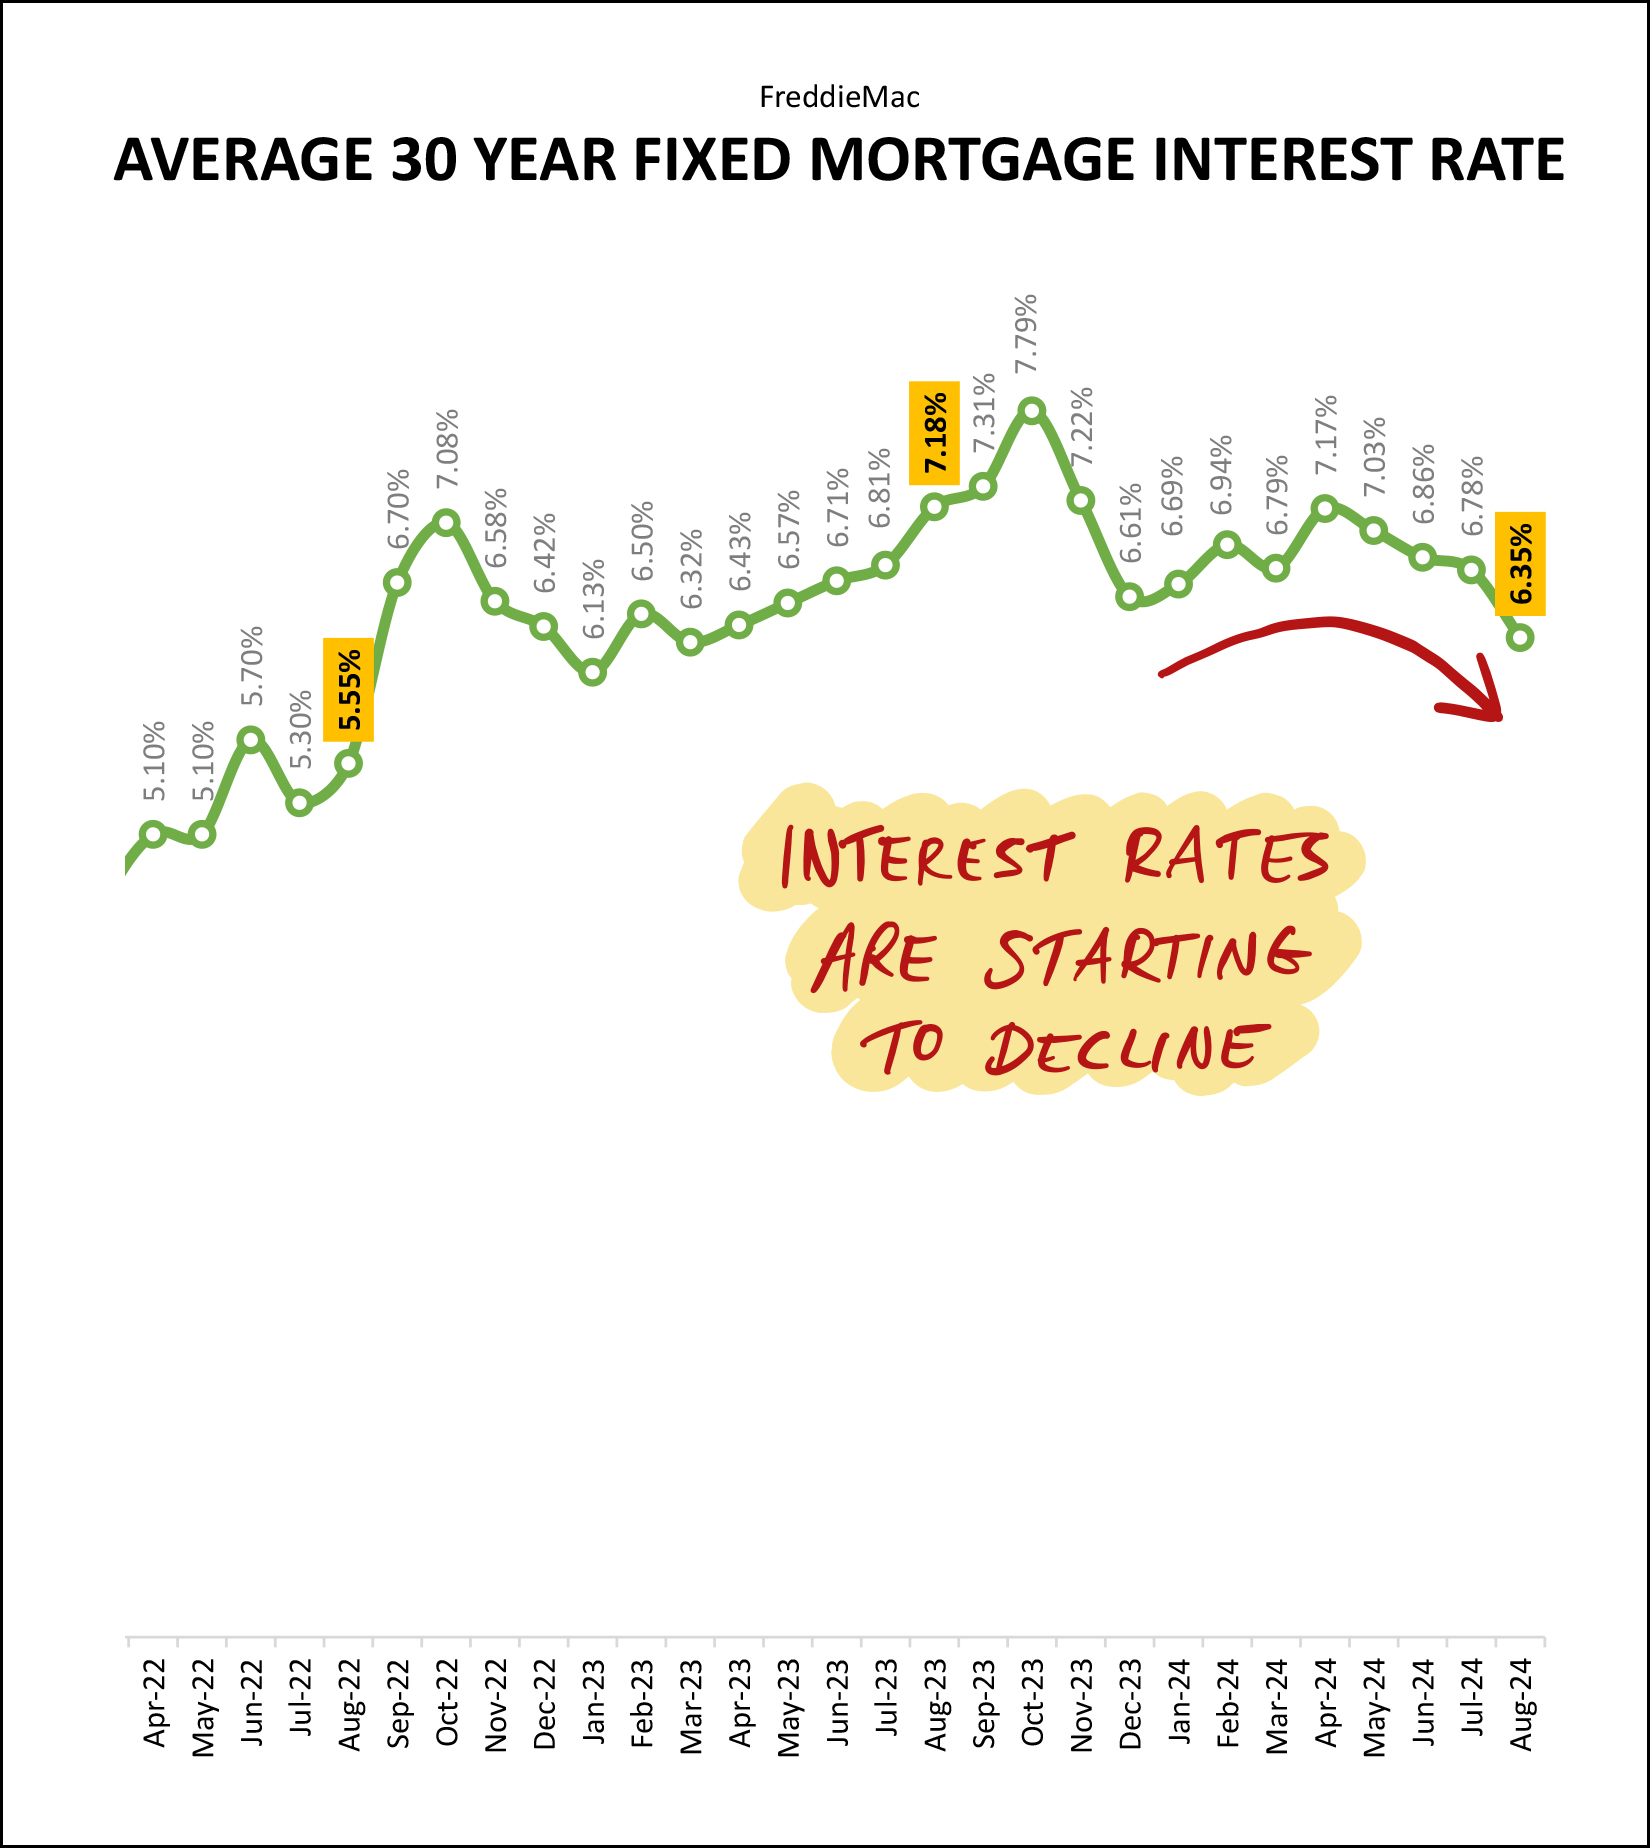 After peaking at 7.79% last October (the highest level in 20+ years) we have started to see some relief in mortgage interest rates -- particularly over the past three to six months. As of June, the average 30 year fixed rate mortgage had fallen below 7%, and now we're closer to 6% than 7%. The Federal Reserve might be announcing a rate cut this Wednesday... though some say that the recent anticipation of that rate cut has already been priced into adjustments in mortgage interest rates. So, let's play a bit of up and down in 2024...
So, as we look ahead at the final three and a half months of the year (yes, that's all that remains) here are a few things to keep in mind... Home Buyers - Many segments of the local market are still rather competitive (multiple offers) but plenty of homes aren't going under contract within two days. Get preapproved now, go see houses quickly when they hit the market, and be prepared to make a rapid, but thoughtful decision about whether to make an offer. Home Sellers - Some, but not all, houses are going under contract quickly. The more broadly appealing your home is to buyers (based on size, location, house features, lot features, etc.) the more quickly we are likely to receive offers. If there are some attributes of your home that disqualify broad segments of the pool of potential buyers, then we are likely to have a longer wait for an offer... and we might have to adjust your list price more than the market data would otherwise suggest in order to inspire a buyer to make an offer. The data and observations I have presented in this market report are a high level overview of our overall market. If you're getting ready to buy or thinking about selling, we should be chatting more specifically about your segment of the market -- what you will be buying, or selling. Feel free to reach out anytime with questions or to set up a time to meet. You can contact me most easily by phone/text at 540-578-0102 or by email here. Recent Articles:
| |
| Newer Post | home | Older Post |
Scott Rogers
Funkhouser Real
Estate Group
540-578-0102
scott@funkhousergroup.com
Licensed in the
Commonwealth of Virginia
Home Search
Housing Market Report
Harrisonburg Townhouses
Walk Through This Home
Investment Properties
Harrisonburg Foreclosures
Property Transfers
New Listings

