| Newer Posts | Older Posts |
City Housing Inventory Levels Stabilizing, At Extraordinarily Low Levels |
|
 Perhaps inventory levels (number of houses for sale) can only go so low in the City of Harrisonburg. As shown above, inventory levels are "stabilizing" around 100 homes for sale. This is still a significant decline from where we have been over the past six years, but at least the trajectory is not still declining. What would it take for this inventory level to start rising again?
There is no easy way to turn this trend around -- and to have more options for City home buyers -- and until this does change, it can be quite challenging for buyers to find a home they want to purchase in the City. So, if you are looking to buy a home in the City, be ready to patiently wait for the right opportunity to come along, and then be ready to act quickly! Stalk homes for sale @ NewListingsInHarrisonburg.com. | |
Higher End Harrisonburg Area Homes Selling Well in 2018 |
|
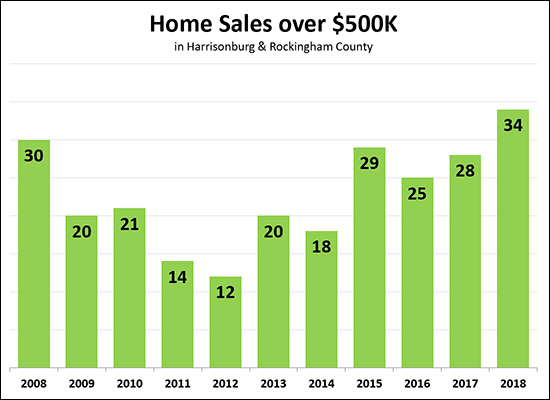 We're only 10.75 months through the year and it has already been a record setting year for higher end home sales in Harrisonburg and Rockingham County. As shown above, there have been 34 home sales over $500K thus far this year -- which is more than were seen in any full year in the previous 10 years. Of note -- there were 39 home sales over $500K in 2006 (not shown) -- and only time will tell if we can beat that this year. 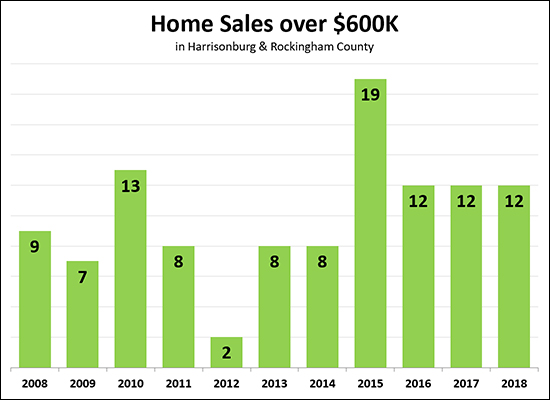 Above, I have narrowed the market a bit, looking only at home sales over $600K. We have seen 12 such sales thus far in 2018, which already matches the full year of sales seen in 2016 and 2017. It seems relatively unlikely that we'll get up to 19 sales as were seen in 2015. As a side note -- only one buyer per month is paying over $600K for a home in Harrisonburg and Rockingham County, at least as recorded in the MLS. 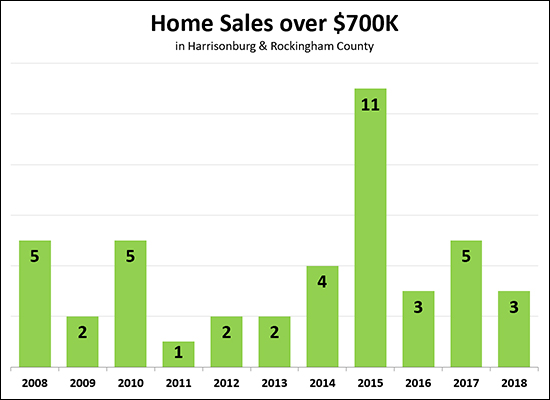 And -- one last look. The over $700K market looks likely to finish out within what would seem to be a normal range of 2 to 5 sales per year. Looking back, clearly, 2015 was an absolutely crazy year for these high end home sales. | |
Is October, Or Even November, Too Late In The Year To List Your Home For Sale? |
|
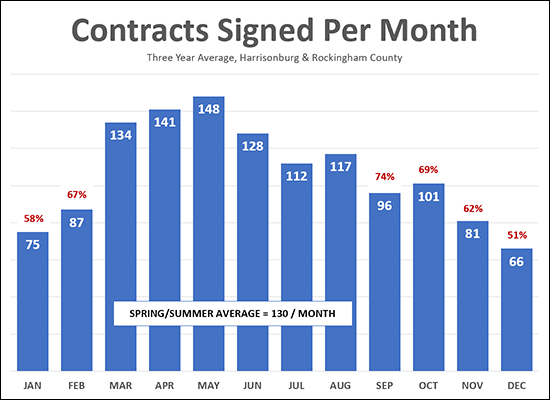 I believe this question is best answered by evaluating when buyers make an actual buying decision -- which is when they sign a contract. The data above shows when buyers sign contracts -- calculated by averaging data from the three most recent years. As can be seen, the busiest buying season is March through August when an average of 130 buyers per month make a buying decision. The remaining six months of the year (September through February) show anywhere between 51% and 74% as many buyers as the average of 130 per month seen in the busiest six months of the year. So -- listing your home on November 1st (for example) is not a terrible idea -- we'll see 62% as many buyers signing contracts in November as compared to the average busy month. That said, in the following month (December) we're likely to only see half as many buyers as compared to the average month. | |
Monthly Housing Cost For Median Priced Home Climbs |
|
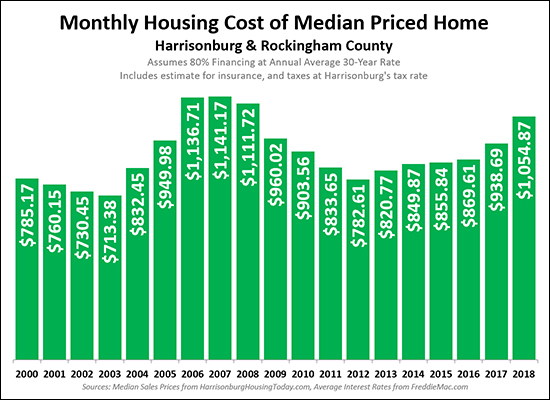 It costs more now than it did a few years ago to buy a home in Harrisonburg and Rockingham County, which should come as no surprise since...
The analysis above shows the combination of all of these factors -- the cost of a mortgage payment (principal, interest, taxes, insurance) based on a buyer financing 80% of a median priced home at the prevailing mortgage interest rate at the time, and with the prevailing real estate tax rate. We have now climbed above $1,000 per month on this metric -- which is the first time we've seen this since 2006 - 2008. Over the next few years, it seems likely we will see a continuation of this trend, as sales prices and mortgage interest rates are both likely to continue to slowly increase. | |
The Median Sales Price of Single Family Homes Has Risen 2 Percent in 2018 |
|
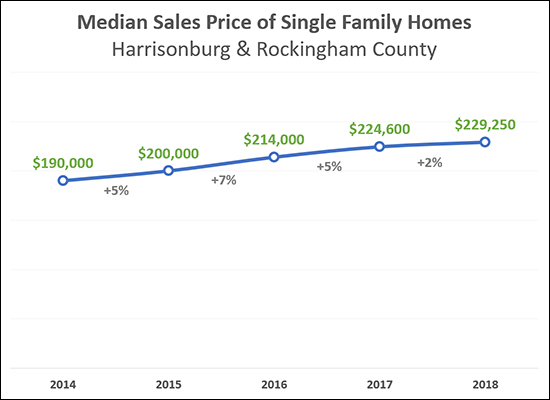 The housing market is hot, right? Home values are rising quickly, right? Well, sort of, but maybe it's not exactly like that. As shown above -- over the past three years (between 2014 and 2017) the median sales price of single family homes has increased by 5%, 7% and then 5%. But during 2018 the median sales price has only increased 2% as compared to 2017. The increases in single family home sales prices seems to be slowing in 2018. If you thought home values had risen much more than 2% over the past year, it may partly be a result of the overall residential sales price having increased 8.42% over the past year (read more here) but that is mostly a result of a change in WHAT is selling (more single family homes) as opposed to a change in the prices for which those properties are selling. So -- if you could have sold your home for $300K last year, perhaps you can sell it for $306K this year (+2%) and you probably can't sell it for $324K this year (+8%). | |
Are Local Home Sales Prices Actually 8 Percent Higher This Year Than Last? |
|
 I'm going to say yes, but no, and mostly no. Keep reading -- this is important, as it can give us an indication of whether our local housing market is heating up too quickly. OK -- at first glance, it would seem that home prices have increased 8.42% over the past year...  But let's look closer -- breaking home sales down into two categories...
Here's where things get confusing -- if the median sales prices of all properties has increased 8.42%, why are we only seeing a 3% (+/-) increase in each of the two categories?   So, wait, what? Single family home sales prices are up 3.03% this year -- and duplex/townhouse/condo sales prices are up 3.77% this year -- but when you throw all of the data together it somehow appears as if prices have risen 8.42% over the past year??!!?? How can this be?? It turns out it's all about how many of each type of property are selling...  As shown above -- last year only 70% of home sales were single family homes, with 30% being duplex/townhouse/condo sales. This year, that ratio has shifted, and 75% of home sales have been single family homes, with only 25% being duplex/townhouse/condo sales And therein lies the answer. When single family homes sell for around $230K and duplexes/townhouses/condos sell for around $165K -- if there is a shift in how many of each property type sells (relative to the other) then the median sales price for the combined ALL residential sales will adjust more than sales prices of each property type are actually adjusting. So -- Sellers: You are likely to be able to sell your home for 3% more than you would have last year -- NOT 8% more. Buyers: You are not being expected to pay 8% more for homes this year than last. Everybody: Let's not be disappointed that we're not seeing an 8% increase in home prices -- let's be happy with 3%. An annual increase of 3% is (historically) normal, and seems to be quite sustainable. An annual increase of 8% (especially if back to back with another similar year) would likely mean that home sales prices are adjusting upwards too quickly and they may have to come back down at some point. So -- good news, bad news, but in my book, mostly good news! Home prices have risen 3% over the past year -- not 8%. | |
Home Sales Slow Slightly in September But Prices Still On The Rise |
|
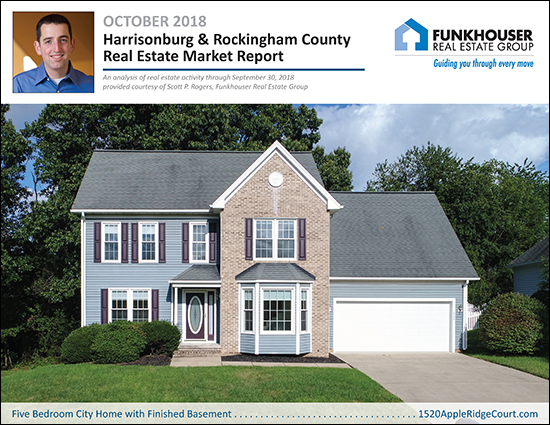 Before we dive into this month's market report, check out this featured home in Stone Spring Village by visiting 1520AppleRidgeCourt.com. Now, on to our local real estate market -- I just published my most recent monthly market report, and as usual, you can read on for an overview, download the full report as a PDF or tune in to my monthly video overview of our local housing market... VIDEO OVERVIEW: Click here to watch (and listen) to my overview of the market. Now, let's take a look at some the trends we're currently seeing in our local housing market... 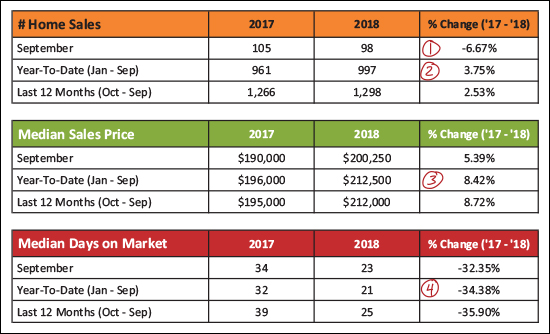 As shown above...
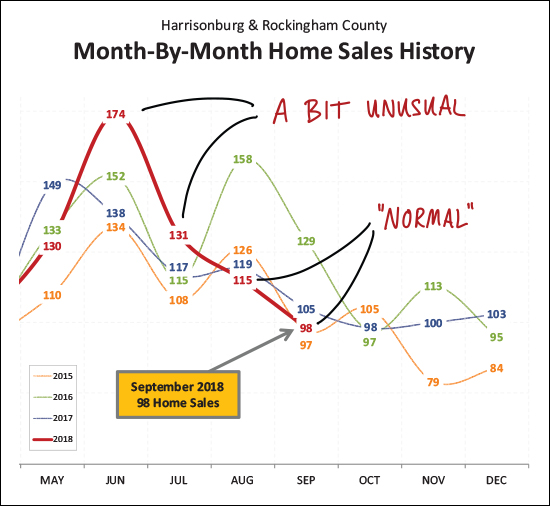 Looking backwards a bit -- the crazy months of sales we saw in June and July of this year were a bit unusual -- way out of the norm. The slower months of sales seen in August and September were much more "normal" -- even if a bit slower than usual. 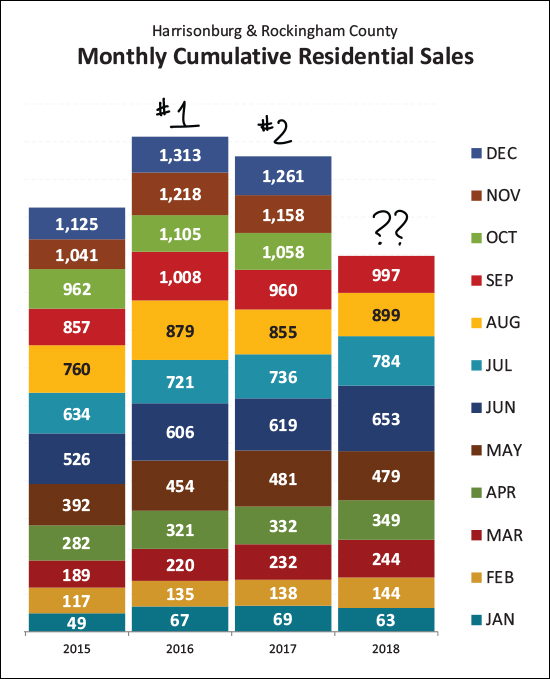 Two years ago was a rock star of a year of real estate sales. After only 1,125 home sales in 2015 -- the local market saw a huge increase to 1,313 home sales in 2016. And then -- 2017 -- darn, we slipped a bit. It's hard to say at this point where 2018 will fit into the mix. I am guessing we'll beat last year's 1,261 home sales -- but probably won't make it all the way up to 2016 levels. 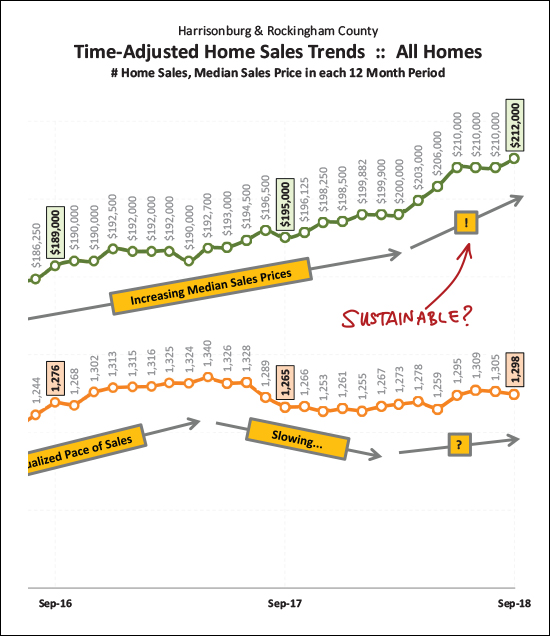 So -- as shown above with a green line -- sales prices have sort of been escalating a bit lately. Less than a year ago we had just cleared a $200K median sales price -- and now we're way up to $212K. Hmmm -- doesn't seem sustainable. What gives? Read on. 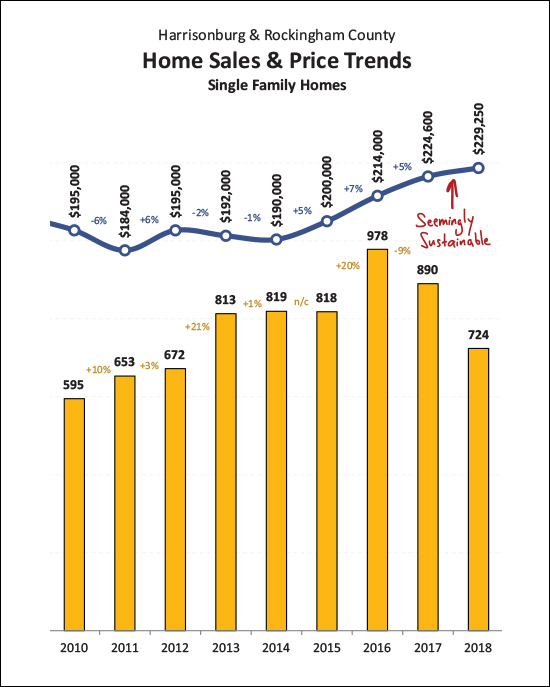 If we dial it back a bit and just look at single family homes (not duplexes, condos, townhouses -- all of which are prime real estate investor targets) we see a much (!!) more modest increase in the median sales price. An increase from $225K to $229K over a one year period seems to be a much more reasonable increase in the local median sales price -- and one that seems like it could be sustainable. This calms my nerves a bit after having seen that sharp rise in the overall median sales price. 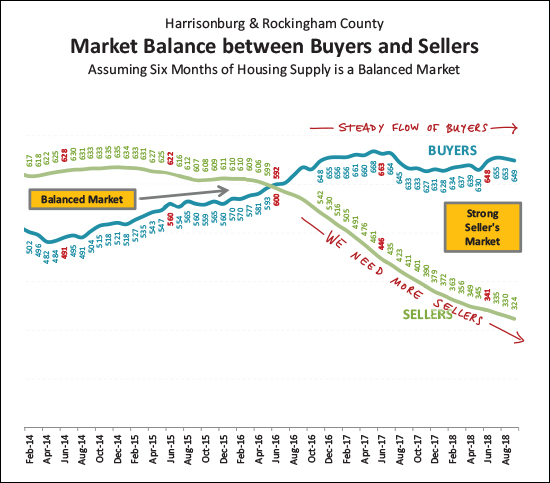 So -- how's the market, you might ask? Pretty balanced? Not at all! There are a steady flow of buyers in the local market -- and an ever smaller group of sellers. We desperately need some new sellers in the market -- preferably who aren't also buying -- which often will mean we need to see some new construction. 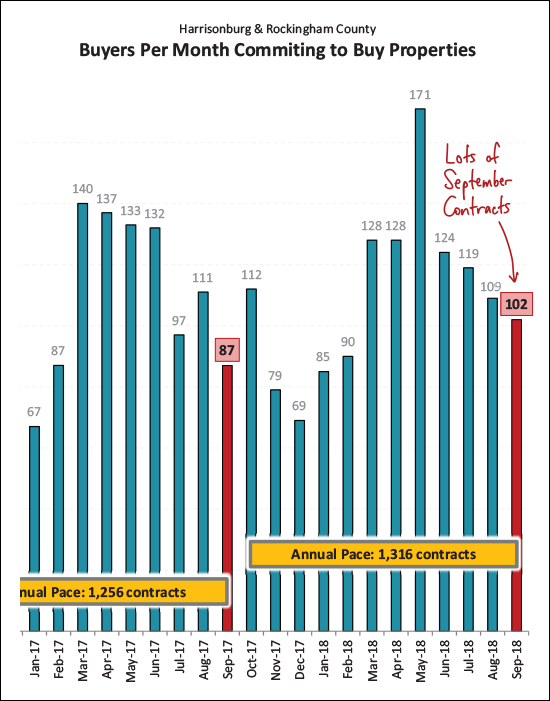 Looking ahead, we might see a bit of a pop in October home sales after all! September contracts were strong -- and markedly higher than last September. In fact, contracts over the past year (1316) were a good bit higher than the previous 12 months (1256). October sales figures might look better than expected! 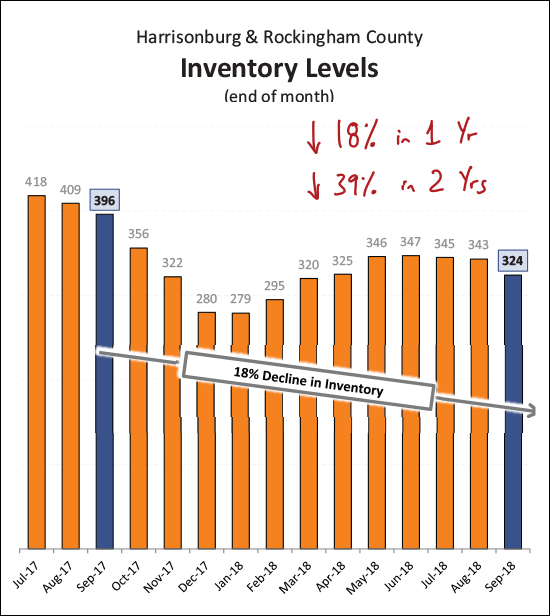 And here is that inventory issue - visualized slightly differently. Today's buyers have 18% fewer choices as compared to a year ago -- and 39% fewer choices as compared to two years ago! What is a buyer to do these days? I'll pause there, for now. As usual, you can download the full report as a PDF, or tune in to my monthly video overview of our local housing market And a few tips for anyone thinking of buying or selling soon -- SELLERS -- even though it is a seller's market in many price ranges right now, you must still focus on price, condition and marketing. For further reading on buying or selling in this area, check out.... | |
Early Indications Show Many Home Buyers Contracted in September |
|
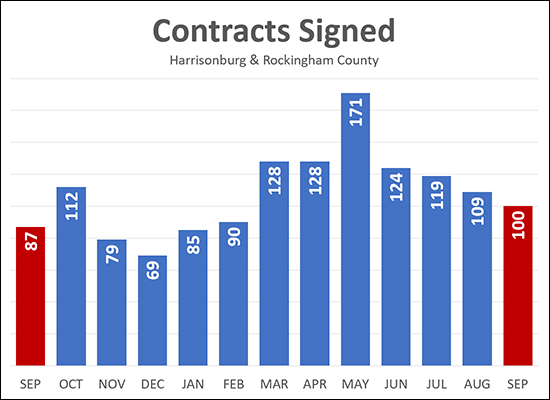 Home buying activity slowed for the fourth straight month in September 2018 -- but -- it was 15% higher than it was last September! As shown above, 100 buyers signed contracts to buy homes in September 2018, a slight decline from 109 the previous month, but an increase over last September. If last year is any indication, we may see an uptick in buying activity in October before things then cool down between November and February. | |
Starting vs Finishing With A Price When Analyzing The Market Value Of Your Home |
|
 It is always my recommendation that we finish with a price when we conduct a market analysis of your home -- but sometimes it can be helpful to work the other way around as well. FINISHING WITH A PRICE - With this approach we start with analyzing how your home compares to recently sold properties to determine its value. We are typically looking for homes that have sold in the past six months (or up to 12 months if needed) and are looking for homes that are in a similar location, with a similar structure (one-story, two-story, basement vs. not, etc.), of a similar age, and with similar finishes if possible. We then make adjustments to the sales price of those comparable properties to bring its attributes more in line with your home, and then the adjusted sales prices of those comparables will usually point to a potential market value (or value range) for your home. So, we start with your house, evaluate comparables, and finish with a price -- or market value -- at the end of the process. Sometimes we'll also then contextualize that potential value with currently active (or under contract) listings to see if they also support our theory on market value. STARTING WITH A PRICE - We might also start this process with a price, instead of finishing with a price. In this scenario, we're starting by saying that we think (or hope) that your home is worth $X and we evaluating (broadly, not narrowly) whether market data (both sold properties and active listings) can support that theory on market value. We might work through the process in this direction because the first method is not leaving us with a clear picture of value based on very few properties being similar to the house that you will sell. We might also start with a price if you have a price in mind for your house, and would only sell if you are able to obtain that price. Regardless of whether we are working through the market analysis to determine a price (finishing with price) or to try to affirm a price (starting with a price) it is important for us to have some candid conversations about market value before we put your house on the market. If we both have a clear understanding of market realities, then we will (hopefully) not be too terribly surprised by the feedback from the market once your house is listed for sale. | |
Do Home Sales in Massanutten Resort Increase In The Fall |
|
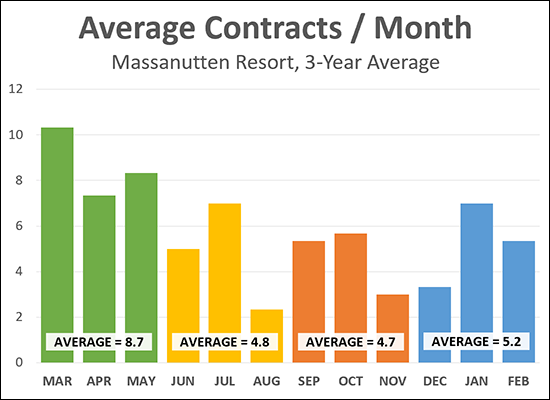 It turns out that leaves aren't the only thing falling in Massanutten in the Autumn months -- home sales are also falling -- though only slightly. The analysis above is to answer the question of one of my clients who had heard that home sales usually show a strong up tick in the Fall at Massanutten Resort. The data above is showing the average number of contracts signed per month over the past three years. Here's what I'm finding:
Every year is certainly going to be different, but it would seem that the only up tick seen in Massanutten home sales in the Fall is when comparing that contract activity to the typically slow pace of buyer activity in August. | |
Local Housing Market Cools, Slightly, in August 2018 |
|
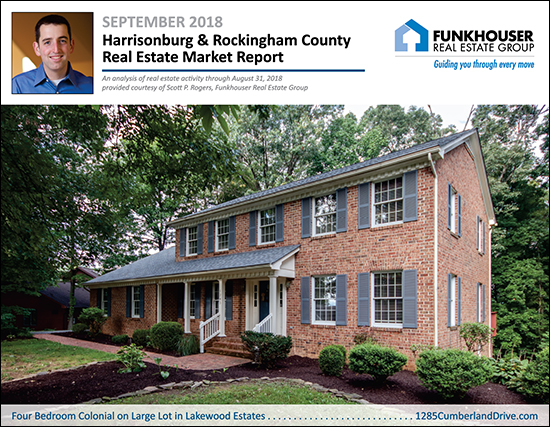 First, learn more about this new listing in Lakewood Estates by visiting 1285CumberlandDrive.com. Now, on to our local real estate market -- I just published my most recent monthly market report, and as usual, you can read on for an overview, download the full report as a PDF or tune in to my monthly video overview of our local housing market... Now, let's take a look at some the trends we're currently seeing in our local housing market... 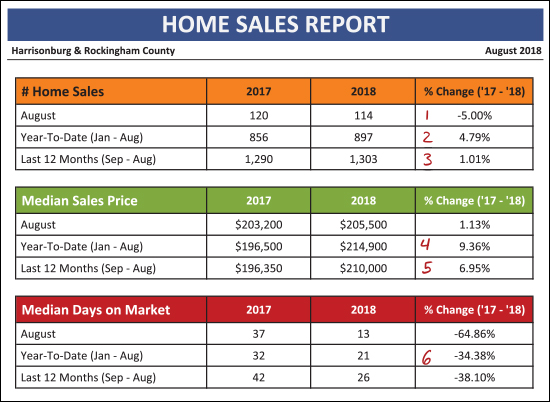 As shown above...
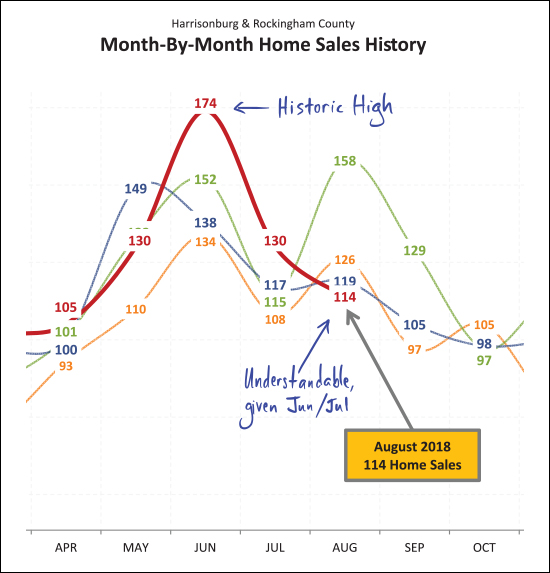 After an extraordinarily robust month of sales in June (174 -- third highest month ever) home sales slowed a bit in July, but remained (at 130) higher than in any recent July. It should be no surprise then that home sales cooled (even if temperatures did not) in August. Perhaps many summer buyers bought earlier in the summer this year than last. In the chart above, orange = 2015, green = 2016, blue = 2017 and red = 2018. So... Jun + Jul + Aug in 2016 = 425 summer buyers Jun + Jul + Aug in 2017 = 374 summer buyers Jun + Jul + Aug in 2018 = 418 summer buyers 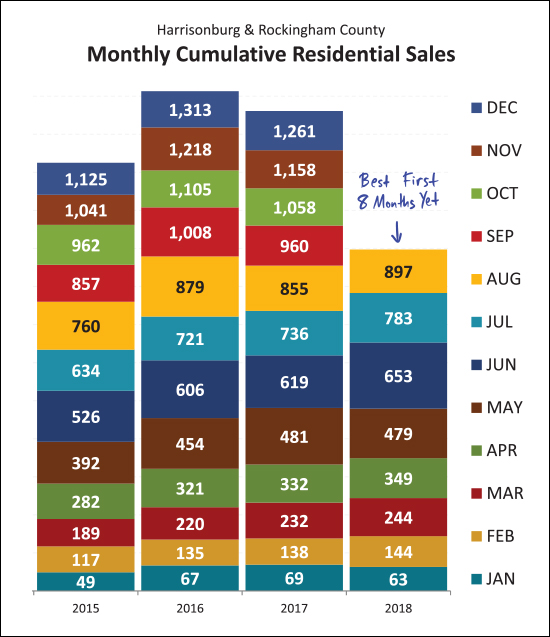 We have seen 897 home sales in the first eight months of the year -- this is more home sales than we've seen in any recent first eight months of the year. At this point, we seem poised to see another 1300+ year of home sales -- which we have only seen one other time in the past decade. 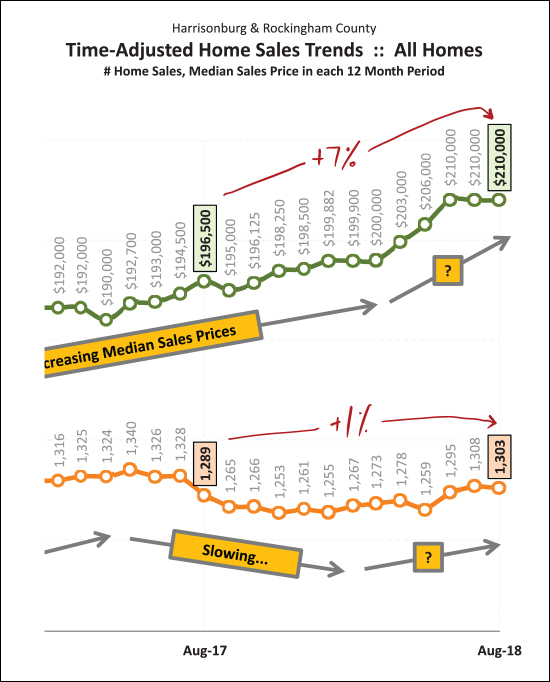 Looking at a rolling 12 month data window -- we see that there has been a net 1% increase in the pace of home sales per year (up to 1303/year) and a 7% increase in the median sales price (up to $210K) over the past year. The median sales price escalated quickly from $200K to $210K this Spring but now has stayed put at $210K for the past few months. 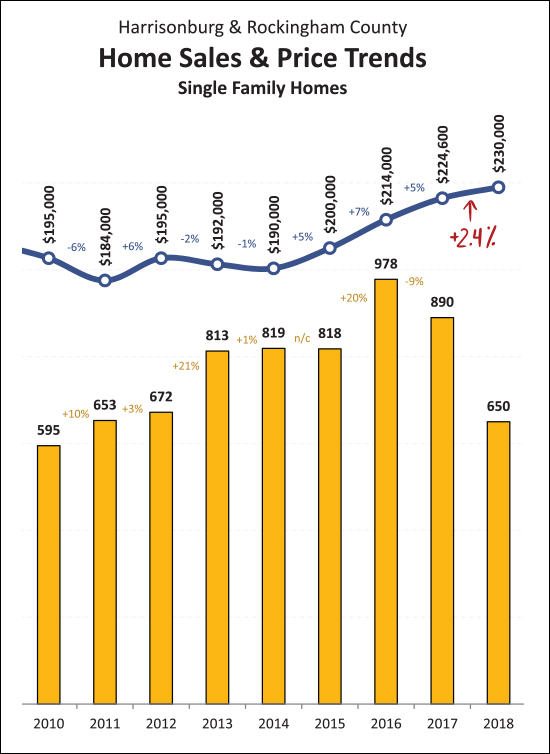 I have never been happier to see such a modest increase in prices as I am to see the 2.4% increase in the median sales price of single family home as shown above. The 7% increase in median sales prices shown on the prior graph reflects not just increases in home values but perhaps a shift in which homes are selling. By looking at only single family homes (excluding duplexes, townhouses and condos) we can (sometimes) get a better sense of actual changes in home values. Here we see that single family home sales prices have increased only 2.4% over the past year. 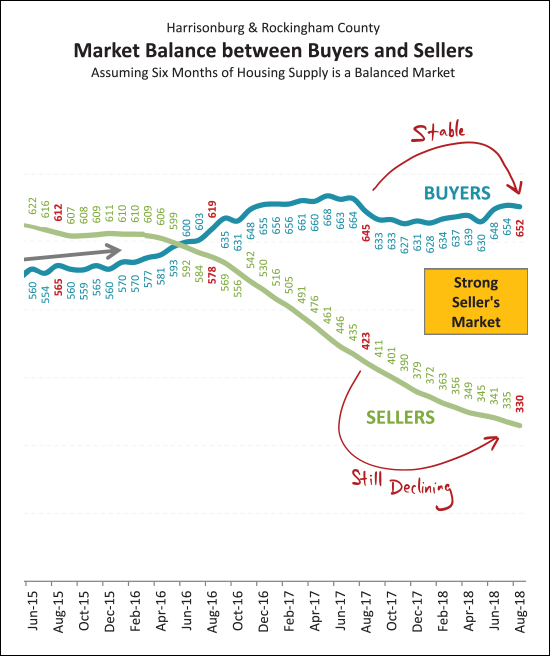 The balance (or imbalance) between buyers and sellers doesn't show any signs of shifting any time soon. After multiple years of increasing buyer activity we are now seeing a relatively stable number of buyers in the market -- around 650 every six months. But at the same time, inventory levels continue to decline -- making it an even stronger seller's market -- with the usual disclaimers of "in most areas, in most price ranges, for most property types, etc." 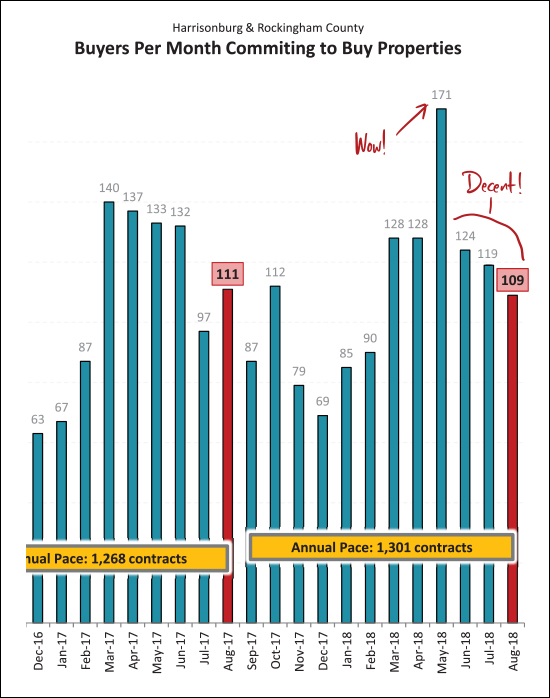 The huge month of sales in June 2018 was foretold by the enormous month of contracts in May 2018. Since that time, we've seen relatively normal months of contract activity. The 109 contracts signed in August 2018 is pretty much in line with the 111 contracts we saw last year. Looking forward, we're likely to see a dip in contract activity in September, possibly a spike in October, before much lower contract numbers between November and February. 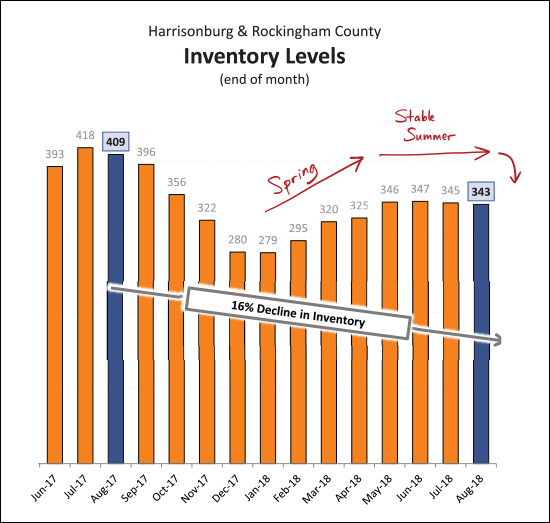 If you thought inventory levels have been low recently, you haven't seen anything yet. After a 16% year over year decline, we're about to head into the Fall and Winter where we inevitably see fewer homes on the market. It seems likely we'll dip below the 300 homes for sale mark again as we did last December and January. An increase in new construction is likely the only thing that can break this drought of listing inventory. 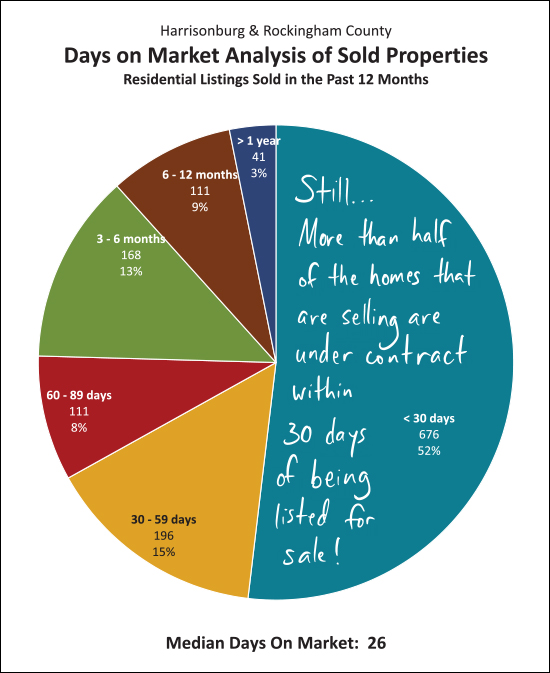 This is absolutely no consolation at all to any home seller who has had their home on the market for 2, 3, 4, 6 or 10 months -- but for sellers about to put their homes on the market, you have a decent chance of selling your home quickly -- again, depending on price point, location, features, finishes, condition, marketing, etc. But, as shown above, slightly more than half of the homes that sold in the past year were under contract within 30 days of being listed for sale. 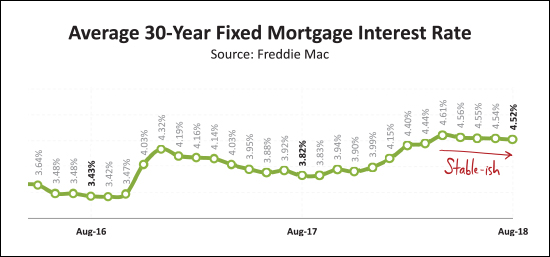 Yes -- interest rates have risen over the past year -- by about 0.75%, which we shouldn't minimize. That said, at 4.5% -- which seems to be where we are hovering for the moment -- this doesn't seem to be drastically changing buyer behavior or housing affordability. OK -- I'll stop there for now. Again, you can download the full report as a PDF, or tune in to my monthly video overview of our local housing market And a few tips for anyone thinking of buying or selling soon -- SELLERS -- even though it is a seller's market in many price ranges right now, you must still focus on price, condition and marketing. For further reading on buying or selling in this area, check out.... | |
Townhouse Sales Trends in Harrisonburg and Surrounding Areas |
|
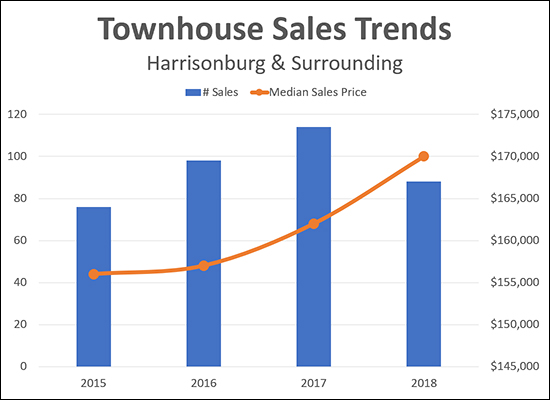 This is a somewhat limited analysis, but I think it can be helpful to understand what we're seeing in changes in demand for new-ish townhouses in the City of Harrisonburg and just surrounding. The analysis above includes the following townhouse developments of properties built since 2000:
As shown on the chart, there are an increasing number of sales happening in these developments (88 sales in 2018 is for the first eight months of the year) and the median sales price is rising -- more quickly now than a few years ago. I expect sales of this type of townhouse to continue to be strong over the next few years -- though if we see a large number of new construction townhouse developments coming online it could affect the pace of sales in resale townhouse developments. | |
Fall Is Not The Worst (Nor The Best) Season For Selling Your Home |
|
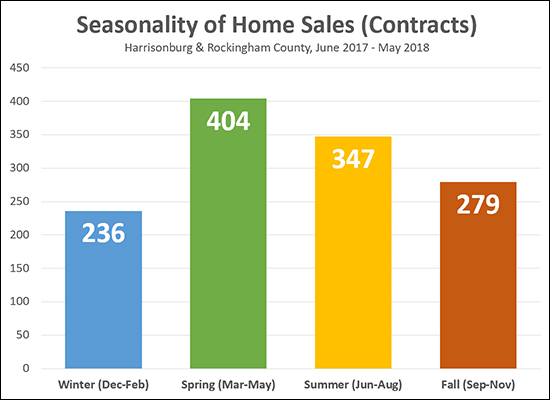 As is likely no surprise -- the busiest time for home sales (contracts) is SPRING -- followed by SUMMER. Fall, though, is the third best -- ok, also the second worst -- season for home sales. Of note, the data above reflects the timeframe during which properties went UNDER CONTRACT -- not when they closed. Plenty of the Summer contracts turned into Fall closings -- but the 279 figure is a reflection of how many buyers made buying decisions (signed contracts) between September and November of last year. So....if you want to sell your home (and close on it) in 2018, you should be thinking about getting it on the market sooner rather than later. Fall is definitely a better time to sell than Winter! | |
Fewer and Fewer Homes For Sale in the City of Harrisonburg |
|
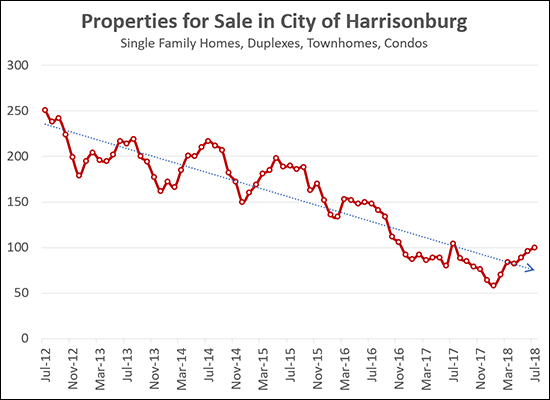 Home buyers looking to purchase in the City of Harrisonburg are finding fewer, and fewer, and fewer options at any given time. As shown above, inventory levels have been steadily dropping over the past six years -- from over 200 homes for sale to less than 100 homes for sale. Now, of note, this is not an indication that fewer homes are selling in the City -- but rather, that with as fast as homes are selling in the City, there are a smaller number available for sale at any given time. Buyers in the City, thus, are finding themselves in competitive offer situations more often, or are having to make decisions much more quickly when a house of interest is listed for sale. Learn more about our local housing market in my most recent monthly market report -- click on the image below to read it. | |
Local Home Sales and Prices Surge in July |
|
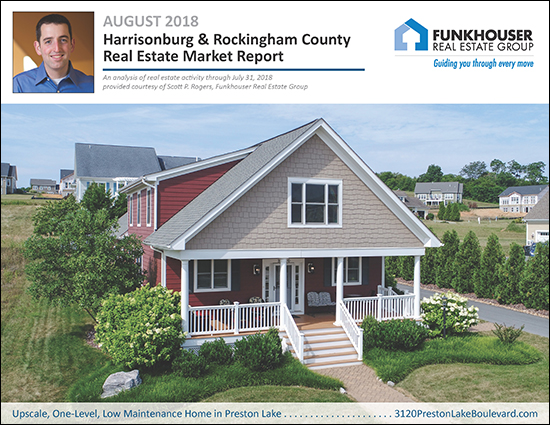 First, learn more about this fantastic home (my dad's house), via a 3D Walk Through and more by visiting 3120PrestonLakeBoulevard.com. Now, back to our local real estate market -- I just published my most recent monthly market report, and as usual, you can read on for an overview, download the full report as a PDF, read the entire report with commentary online, or tune in to my monthly video overview of our local housing market... Now, let's take a look at some the trends we're currently seeing in our local housing market... 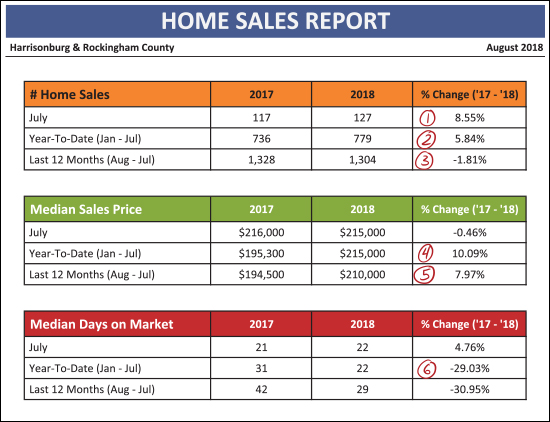 As shown above, it has been an exciting month -- and year -- in our real estate market...
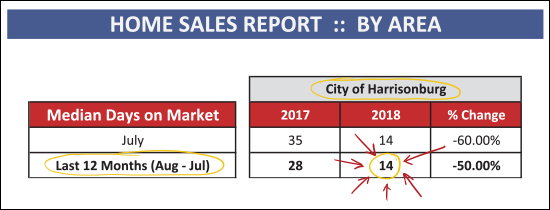 OK -- this one is a random snippet. Above you will find a STARTLING statistic about the housing market in the City of Harrisonburg -- not including Rockingham County. When we look at all homes that sold in the past 12 months, in the City, half of them were under contract within 14 days of being listed for sale! Wow! 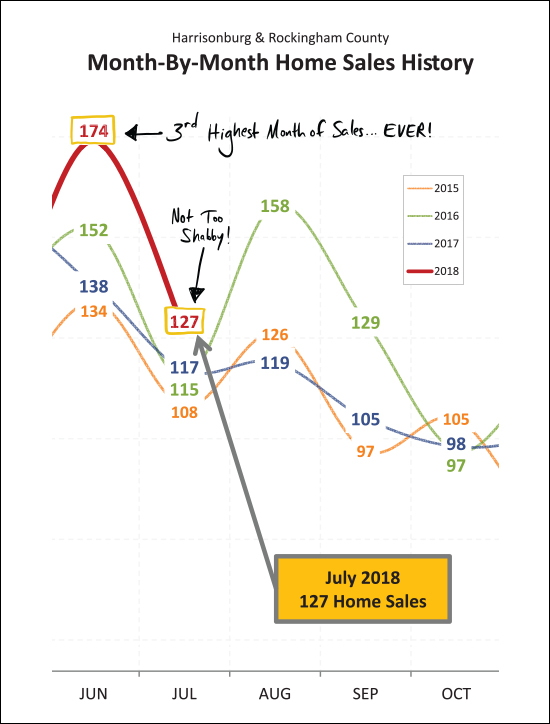 Back to the big picture -- June 2018 home sales (all 174 of them) was the third highest month of home sales we have ever seen in our local market -- topped only by two summer months back in 2005 and 2006. I thought we'd see home sales drop off in July, as a result, but we had the best month of July sales in recent years -- with 127 home sales! Next month I'm not expecting we'll pop back up to August 2016 levels -- we're more likely to be in the 120 - 130 range for sales in August. 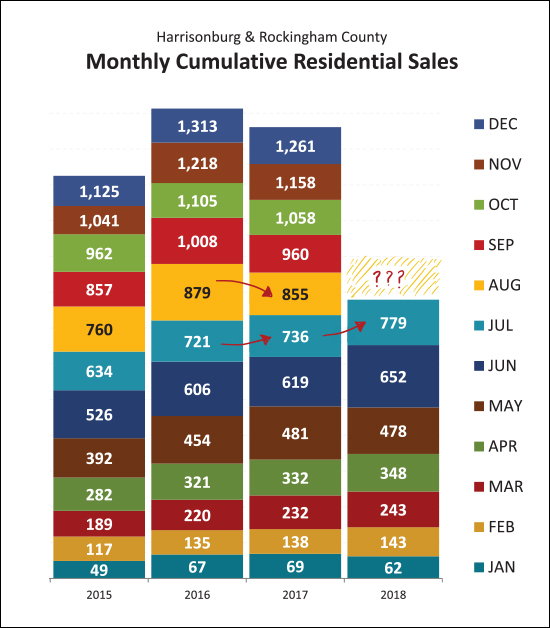 August, oh August, that magical month. Last year at this time (end of July) we had seem more home sales (in 2017) than during that same timeframe the prior year (2016). And then, August. After August passed, 2017 never caught back up -- and ended up being a slower year than 2016 when all sales were accounted for. So -- what will happen this August? Will we keep on pace with 2017? Or even with 2016? Will we fall behind again? Stay tuned. 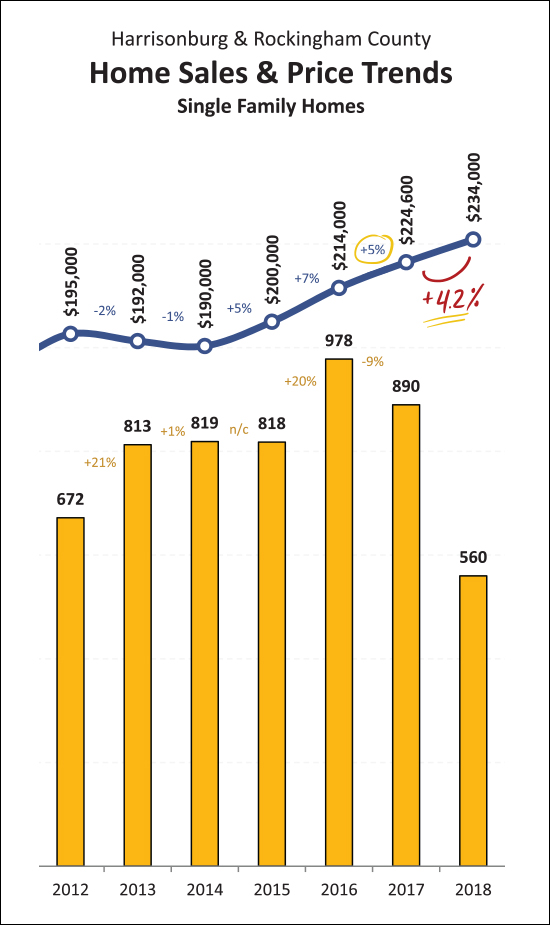 When I see the YTD market-wide median increasing by 10%, I get a bit worried -- wondering if these are sustainable increases. Then, however, when I look at single family home sales alone, I am (at least a bit) reassured. You'll note that thus far the median sales price has increased only 4.2% between 2017 and 2018. This is much more in line with (or close to) long-term historical averages, and makes me think that the strong seller's market might not be leading to unsustainable price increases. Why, might you ask, is the single family detached market a better indicator of changes in market value? Mainly because it is not as easily affected by the number of investors engaging in our market. When the market gets hot we often see lots of investors buying properties -- often townhouses or other attached dwellings -- which can affect price trends. Most single family home purchases are made by folks who actually intend to live in the properties. 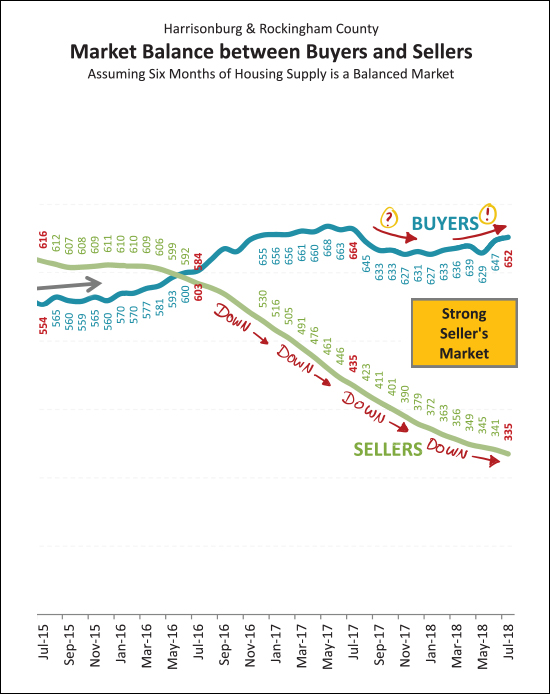 Which would you rather do, buy or sell in the current market? The answer should be "sell" -- given the strong seller's market we're currently experiencing. A few things to note above -- first, there are still plenty more buyers in the market than there are sellers. Second, the number of sellers in the market continues to decline (and decline, and decline). Third, after a brief slow down in buyer activity, the pace seems to be increasing again. 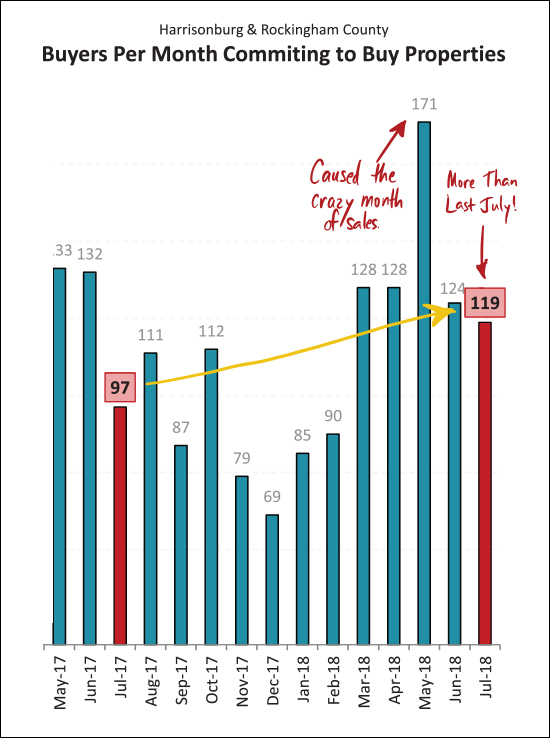 What comes next for our local market? Looking at contract activity (above) we can see the pop in May 2018 that lead to a wild month of June sales. Looking, then, at July -- we actually see a sizable increase from last July -- so maybe we'll have a stronger than expected month of sales in August after all!? 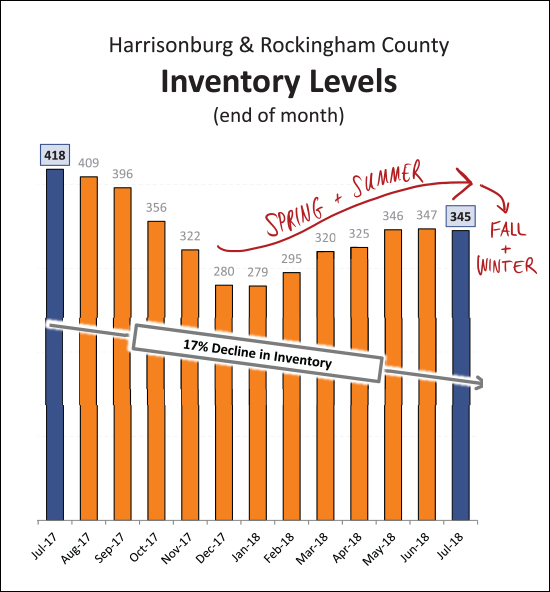 If you're buying soon, you might have already passed the time in our local market cycle when you would have the most options from which to choose. That's not to say that plenty of new listings won't be coming on the market in the next 30 / 60 / 90 days -- they will -- but inventory levels have likely peaked and will start to decline as we (eventually) head into Fall and Winter. 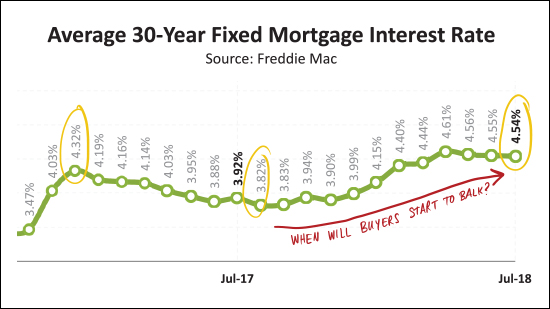 Lastly, how about those interest rates? We were actually close to 4.5% about 20 months ago -- but then dropped below 4% again. Now, over the past year, we have seen steady increases to where we are currently hovering around 4.5%. I have not seen this playing a major role in whether buyers are willing and able to buy -- but I do wonder if buyer activity (or interest or capability) would start to be affected if the interest rates rose to 5% or 5.5%. OK -- I'll stop there for now. Again, you can download the full report as a PDF, read the entire report with commentary online, or tune in to my monthly video overview of our local housing market One last note for anyone thinking of buying or selling soon -- SELLERS -- even though it is a seller's market in many price ranges right now, you must still focus on price, condition and marketing. For further reading on buying or selling in this area, check out.... | |
Prices of Single Family Home Sales Relatively Close to Harrisonburg |
|
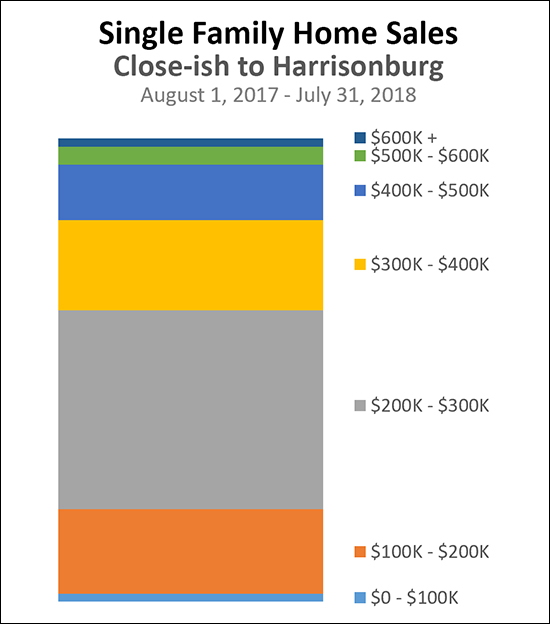 Here is a break down of a year's single family home sales by price range:
A reader asked the following in response to my analysis earlier this week of all home sales in Harrisonburg and Rockingham County... "These stats don't seem to portray the same market in which I hunted unsuccessfully for months in the 200-300k range and, ultimately, felt pushed to purchase far beyond my comfort zone amid intense competition. How does the picture change if you include only detached single family properties? (i.e., are the numerous sales of sub-100k student townhome units skewing things?) I'm just trying to understand why my experience seems to have differed so greatly from the market reality." This is an excellent point. When we look at a large amount of data (all sales in Harrisonburg and Rockingham County) the large number of home sales in a particular price range can obscure some market realities that are hiding just below the surface. In the case of the buyer commenting above, the reason that she found very few options in the $200K - $300K price range relates to property type, location, size, age and features. Property Type - Indeed, the original analysis includes all property types, including townhouses and condos. Under $100K, this includes many student rentals. Between $100K and $200K, this includes many townhouses, some of which are rental properties. Between $200K and $300K this also includes quite a few townhouses. In the new analysis (above) I have only included single family detached homes. Location - Rockingham County is a large county. It's actually the third largest county in Virginia, behind Pittsylvania and Augusta. Many buyers looking to be close-ish to Harrisonburg aren't going to be looking at homes in Broadway, Elkton or Massanutten, based simply on location. In the new analysis (above) I have only included areas close-ish to Harrisonburg, as shown below. 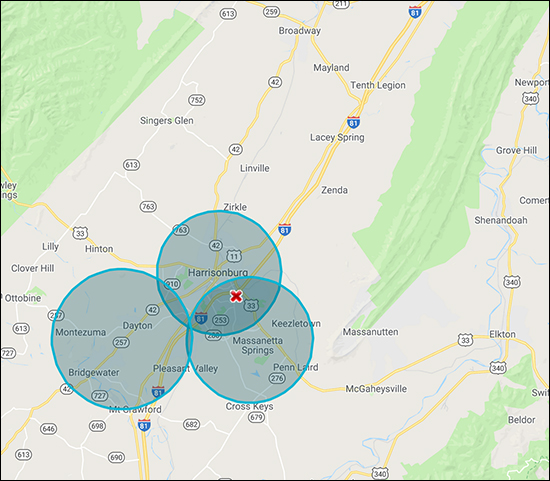 Size - It's easy to look at the data above and wonder how there could really be 182 homes that sold between $200K and $300K, in the geographic area bounded above, and to not (as a buyer) have thought any or many were good options. A whole lot of this has to do with the size of the home -- many buyers need more than X bedrooms, or more than X square feet. When we start putting some lower bounds on the space needed in a house, we quickly narrow down the number of viable homes. Age - The age of a home doesn't narrow things down quite as quickly as the size of a home, but it makes an impact. Many buyers are going to be significantly less excited about buying a 60 or 80 or 100 year old home as compared to buying a home that has been built in the past 10 to 20 years. Features - Then, when we start adding on needs (garage, basement) or wants (open floor plan, level lot), we narrow it all the way down to a relatively small number of homes that often match exactly what a buyer is hoping to buy. So -- when you look at the large number of homes selling in a given price range, don't think that all of those homes will be homes that will be viable options for you and your family. Once we add some of your additional (reasonable) criteria, the options will start constricting, often rather quickly. | |
Fewer Than 1 In 4 Home Buyers Spend Over $300K |
|
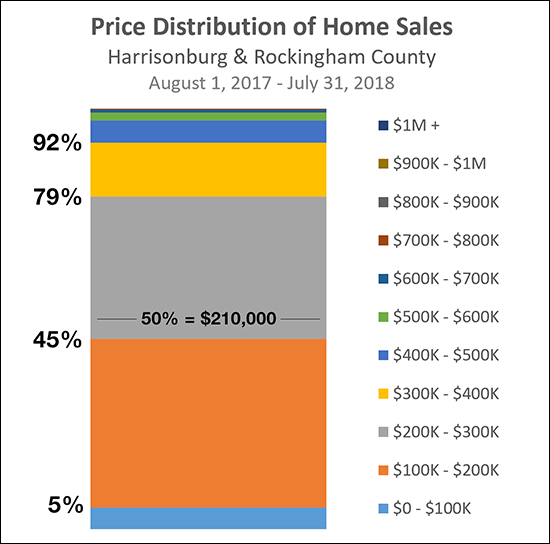 So much that can be unpacked here...
| |
Housing Inventory Levels May Have Peaked For The Year |
|
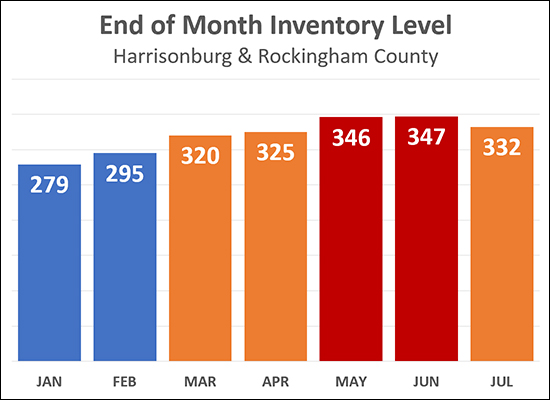 The number of options that you have today, as a buyer, may be the most options you'll have at any given point between now and the end of the year. As shown above, inventory levels (the number of active listings in the MLS at the end-ish of each month) climbed through the first six months of the year, but seemed to peak in May/June and now would appear to be starting to decline again. Now, certainly, there will be new listings over the next five months of this year -- so there will be some new inventory options -- but the total inventory available at any given point is not likely to increase again until next Spring. | |
Should You List Your Home in August or September or October? |
|
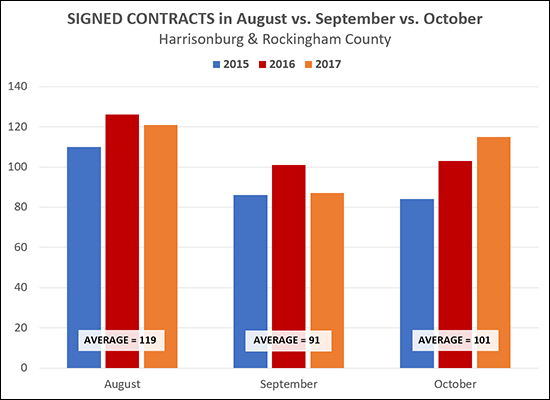 Generally speaking, you should list your home sooner rather than later. As shown above, we are likely to see a declining number of buyers signing contracts between August and September - though then a slight increase again in October. If you are getting ready to put your house on the market in August, let's talk soon to start discussing market value and any preparations you need to make in your home before putting it on the market. | |
With Few Homes On The Market, You May Have To Compromise A Bit |
|
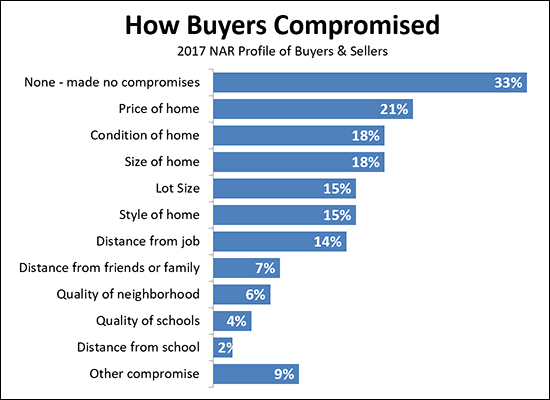 The odds are, you'll have to compromise on SOMETHING when you are buying your next home. The question becomes -- what are you you willing to compromise on? The easiest (at first) sometimes seems to be price -- you still get everything you want, you just have to pay more for it. But if you're drawing a firm line on price, then likely some other need or want will have to be imagined differently. Above is a breakdown of what buyerscompromised on based on the the 2017 Profile of Home Buyers and Sellers from the National Association of Realtors. | |
| Newer Posts | Older Posts |
Scott Rogers
Funkhouser Real
Estate Group
540-578-0102
scott@funkhousergroup.com
Licensed in the
Commonwealth of Virginia
Home Search
Housing Market Report
Harrisonburg Townhouses
Walk Through This Home
Investment Properties
Harrisonburg Foreclosures
Property Transfers
New Listings

