| Newer Posts | Older Posts |
Housing Inventory In Short Supply Under $200K, $300K |
|
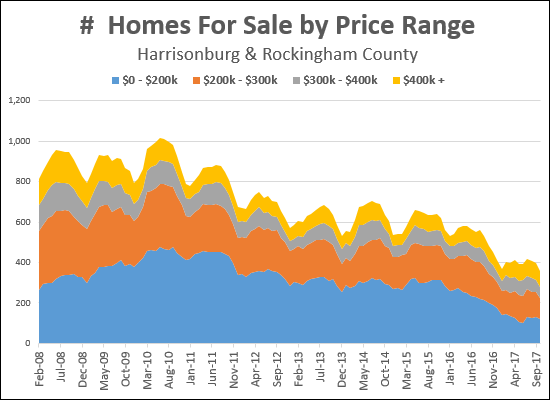 No new news here -- I've been saying it for some time -- fewer and fewer options exist for buying a home in our city/county for less than $200K, and even under $300K. But this visualization (click here for a larger version) was inspired by a comment from Brad - thanks Brad! We know that housing inventory, overall, is at a 10+ year low right now, but Brad observed that not all price ranges are created equal. As (somewhat clearly) shown above, the $300K - $400K and $400K+ price ranges have maintained a relatively stable/healthy supply over the past ten years -- and the under $200K and $200K-$300K price ranges have been the most significant declines. | |
The mid sized homes that ARE being built |
|
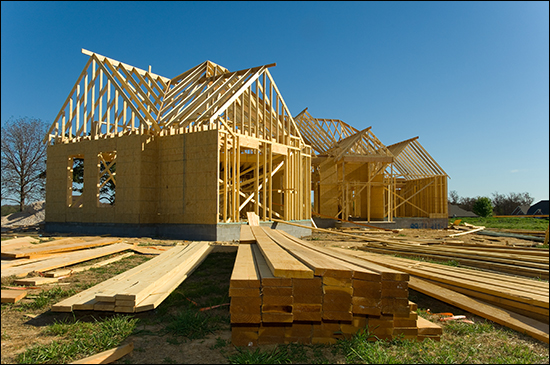 Last week I spent some time discussing the market need that I perceive for mid sized detached homes in or near the City of Harrisonburg. I went further, to suggest that these might be 1750 - 2150 SF homes for less than $300K. Thinking further about it over the weekend, I think it is important to note that there are actually SOME homes being built that meet these criteria. Below are the three homes that sold with these specs thus far in 2017.... 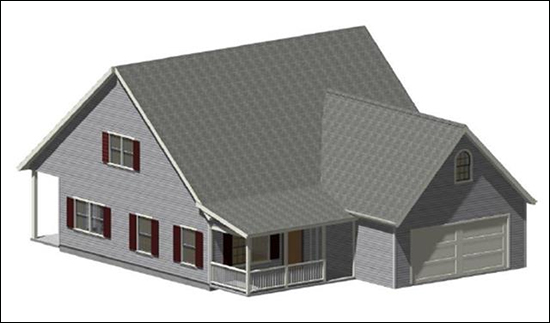 1240 Cottage Lane (just outside Harrisonburg) 3 BR / 2.5 BA / 2336 SF / $275,230 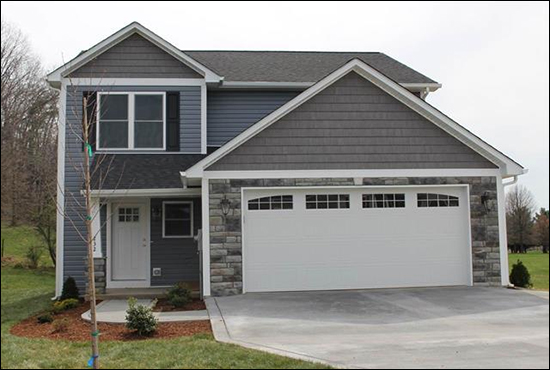 246 Dylan Circle (Bridgewater) 4 BR / 2.5 BA / 1818 SF / $247,000 [no photo available] 395 Acme Company Street (Broadway) 3 BR / 2.5 BA / 2257 SF / $277,000 And if we relax the criteria a bit, down to 1600 SF, we pick up a few more.... 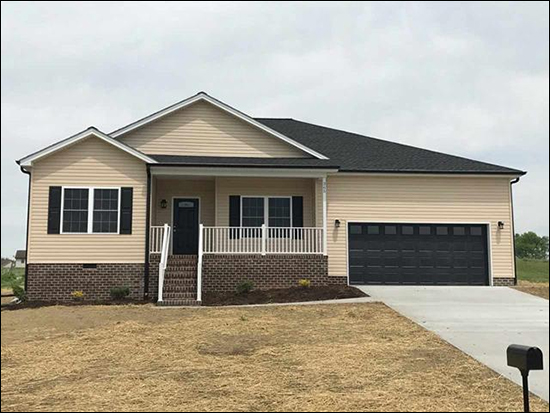 365 Coyote Run (Broadway) 3 BR / 2 BA / 1600 SF / $$222,500 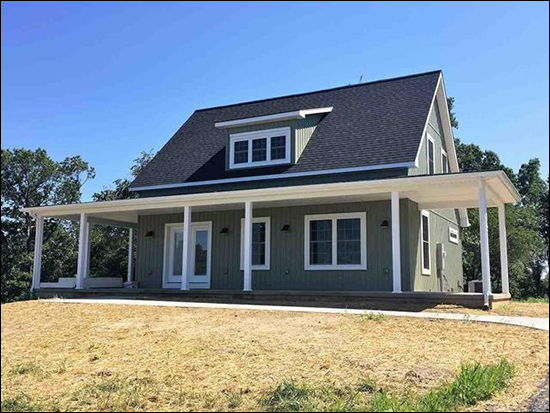 2587 Calico Drive (Broadway) 3 BR / 2.5 BA / 1639 SF / 5 Acres / $249,100 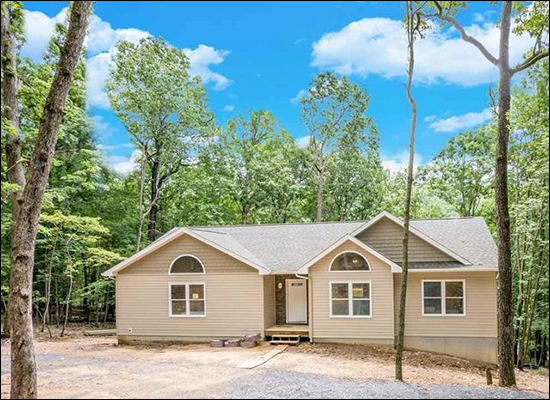 190 Grouse Drive (Massanutten) 3 BR / 2 BA / 1700 SF / $287,500 So, clearly, none in Harrisonburg proper, and most quite a ways from Harrisonburg -- and most importantly, VERY FEW homes at all that are being built and sold in this price range (under $300K) with these specs (1600+ or 1750+ SF). Switching, then, to what is currently available -- we find three options under $300K with 1750+ SF for buyers currently in the market.... 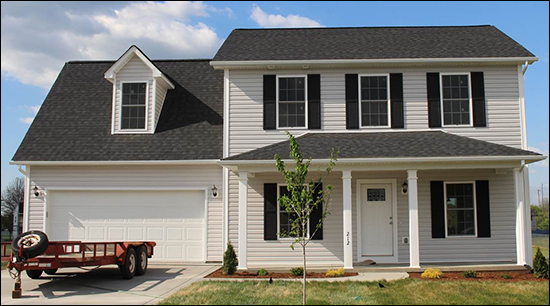 265 Dylan Circle (Bridgewater) 4 BR / 2.5 BA / 1808 SF / $246,900 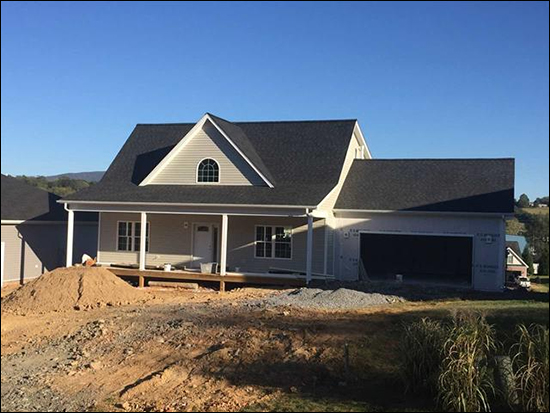 4150 Tanners Court (just outside Harrisonburg) 3 BR / 2 BA / 1830 SF / $279,900 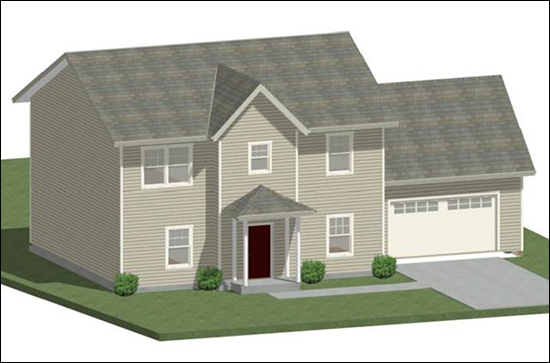 1250 Cottage Lane (just outside Harrisonburg) 4 BR / 2.5 BA / 2266 SF / $299,400 So, indeed, extremely limited options for new homes under $300K with 1750+ square feet in or near Harrisonburg. This brings me back to my same conclusions as I mentioned last week, and I'll mention again here....
| |
Who cares if home sales are slowing down |
|
 The pace of home sales is down 5% this year as compared to last year. But here's an interesting perspective offered up by one of my clients.... Who cares if home sales are slowing down!? As he points out -- the number of homes selling each month might be of more interest to the Realtor profession than the buying and selling public. What an interesting point! He then goes on to call out several data points that are much more important to him, and that he suspects (I agree) are more important to homeowners:
Indeed -- these three indicates are great benchmarks for the health of our local real estate market, and ultimately, he's right -- if prices are going up, inventory levels are low, and foreclosures are infrequent -- it doesn't matter quite so much whether home sales are slightly slower this year than last. So, chew on that for a bit. Home sales being higher than the previous year (at any given point) is not a necessary ingredient for a healthy real estate market. Read more about our local (slower-than-last-year) real estate market in my most recent monthly market report by clicking on the cover of the report below.... | |
Townhouses (and duplexes and condos) finally increasing in value |
|
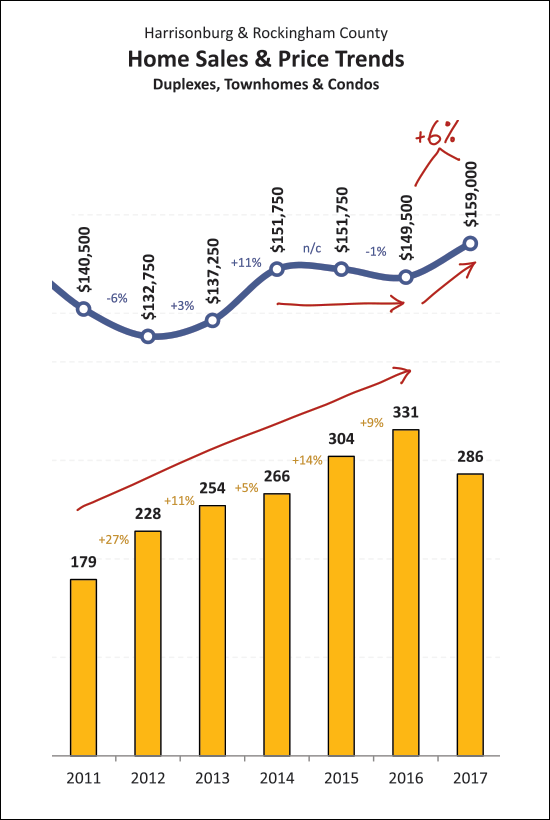 We've been waiting a few years for this. Attached homes -- townhouses, duplexes and condos -- have not seen much of a change in median sales price over the past three years. In fact, the median sales price declined slightly in 2016 after staying unchanged at $151,750 between 2014 and 2015. But now, we're seeing a (YTD) median sales price of $159,000 -- which is 6% higher than last year. This is a welcome sign of some price recovery in the "attached dwelling" category -- and in some ways it is just surprising that it took so long, as there has been a steadily increasing demand for these types of properties over the past six years. The number of these properties selling per year has increased from 179 in 2011 up to 331 last year -- which is an 85% increase. Read more about our local real estate market in my most recent monthly market report by clicking on the cover of the report below....  | |
Low Inventory Levels Lead to Slowing Home Sales in September 2017 |
|
 Find out more about this beautiful Barrington home shown above here. I just published my most recent monthly market report, and as usual, you can read on for an overview, download the full report as a PDF, read the entire report with commentary online, or tune in to my monthly video overview of our local housing market...  OK -- now, let's break down a bit of this data.... 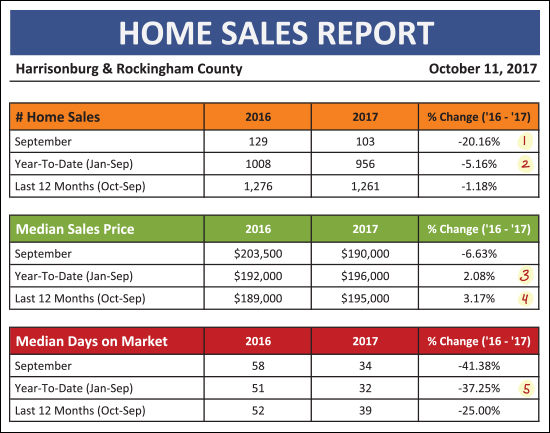 As shown above....
In summary, I believe slower sales are a result of lower inventory levels, not a result of lower buyer interest. If buyer interest were waning, we would be seeing level or declining median sales prices, and increasing time on market, neither of which are happening in the current market.
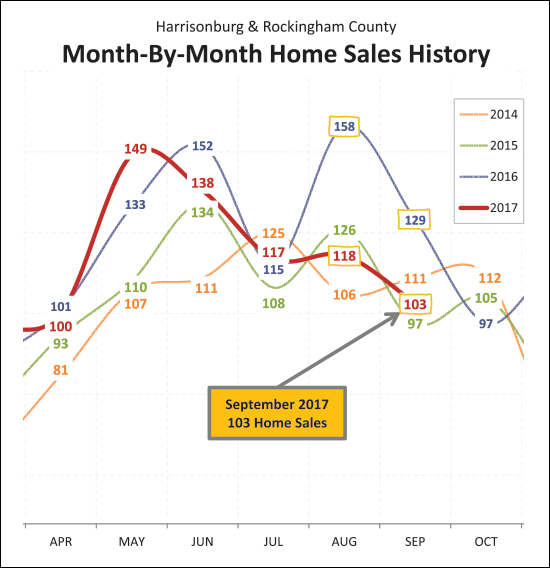
As shown above -- we saw a LOT of home sales last August and September -- a total of 287 sales. This year, during the same two months, there have only been 221 home sales. This decline of 66 home sales (Aug/Sep to Aug/Sep) has put 2017 a good bit behind 2016 when it comes to year-to-date home sales -- and it does not seem likely that the final quarter of 2017 will somehow close that gap.
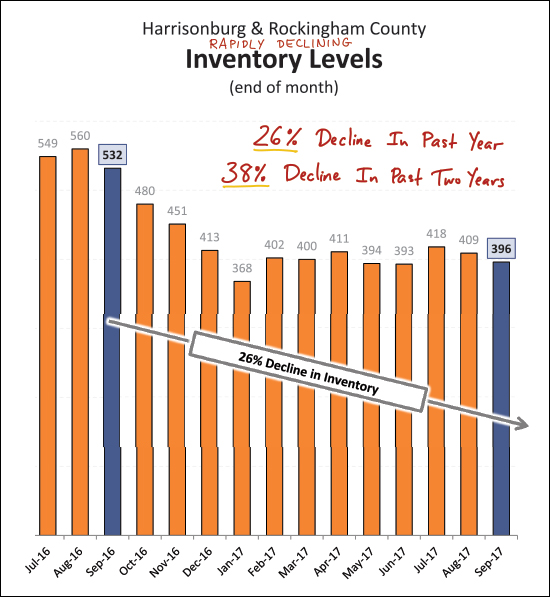
Above you will see what I'm referring to when I say that inventory levels are falling at a pace that is causing home sales to decline. Today's buyers have 26% fewer choices than buyers one year ago -- and 38% fewer choices than buyers to years ago. We knew that this would eventually cause sales to decline, as buyers won't just buy anything if it does not meet their needs now and into the future.
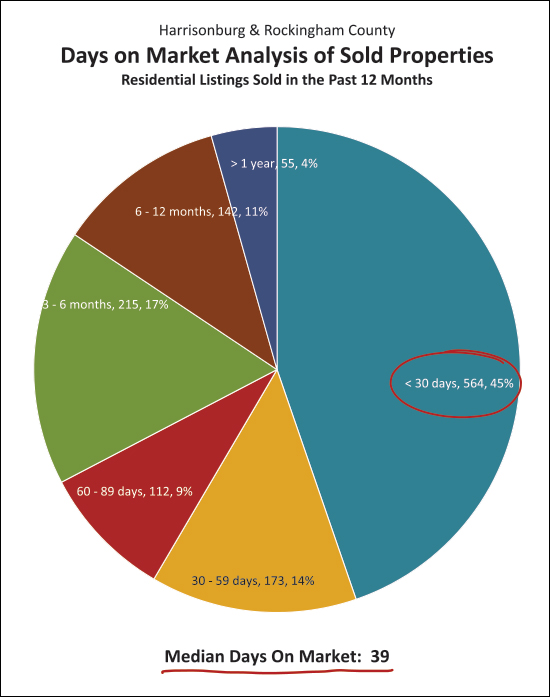
Not all homes are selling -- and not all homes are selling quickly -- but quite a few are selling quickly! The median days on market of homes sold in the past year has been 39 days! Furthermore, 45% of homes that have sold have gone under contract within 30 days! Yet another sign of strong buyer demand paired with low inventory levels. And -- one more time to drive home my point....
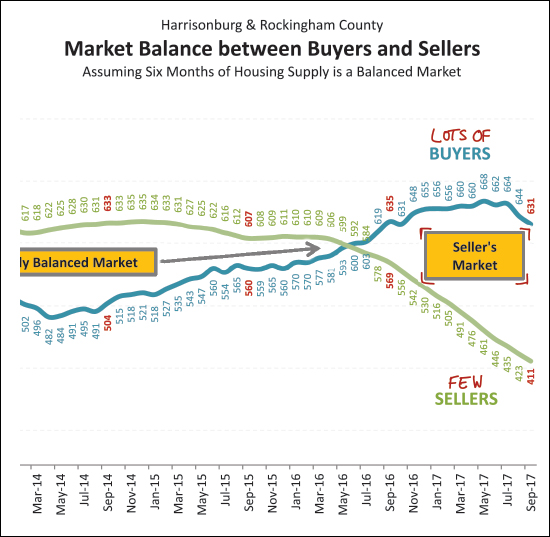
Above you will see that we are experiencing a strong seller's market right now -- with lots of buyers (having steadily increased over the past few years) and very few sellers (having steadily decreased over the past few years). There are now so few sellers that buying activity is starting to fade a bit in recent months. OK -- I'll stop there for now. I will continue to explore the latest trend in our local housing market in the coming days on my blog. And, my reminders for buyers and sellers last month still apply.... SELLERS -- even though it is a seller's market in many price ranges right now, you must still focus on price, condition and marketing. For further reading on buying or selling in this area, check out.... | |
Has the Market Slowed Down in September? |
|
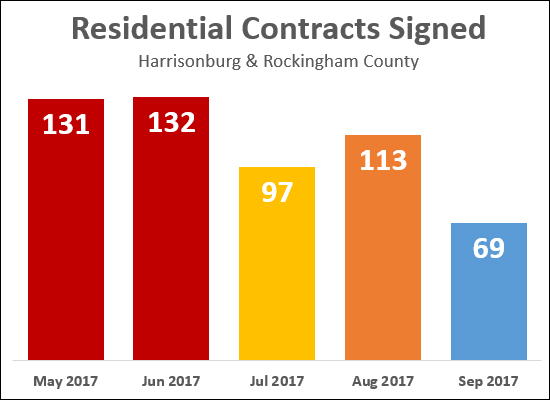 It seems it may have.... As shown above, only 69 properties have gone under contract thus far in September 2017 -- as compared to 113 last month. Of note....
Regardless, home buying activity (at the point of contract signing) seems to be slowing down as we head into the Fall. On a completely unrelated note, do we really call these 80 degree days "Fall"? | |
The Value of Your Home Based On When You Bought It |
|
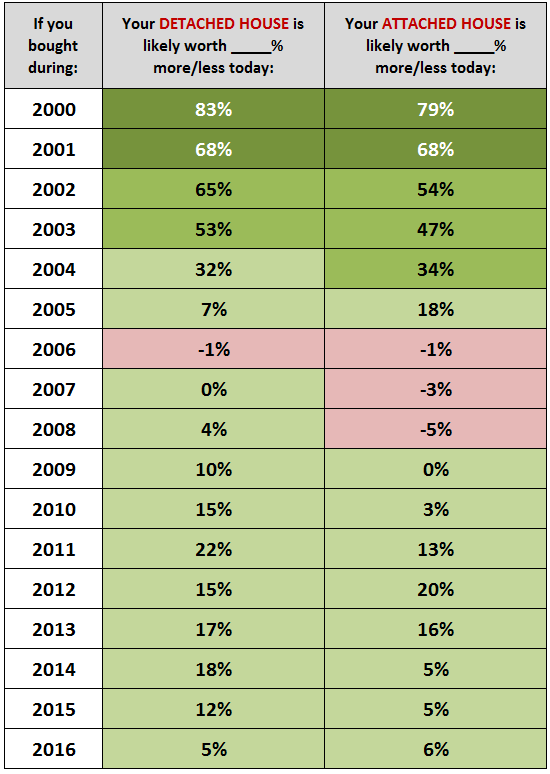 Can historical median sales prices give you some sense of your home's current market value? Perhaps so! The chart above is calculated based on comparing the 2017 median sales price to the median sales price in each of the past 16 years. Do remember, of course, that while this might provide a general guide to what has happened with home values over the 17 years, every home and neighborhood is unique. Let's chat about your specific house if you want to know what it is worth in today's market. Also, if you bought your home in one of the (now few) red years (2006, 2007, 2008), while your home might still be worth less today than when you bought it, you may have paid down your mortgage to the point that you could sell your without bringing money to closing. | |
If you think housing inventory levels are low now.... |
|
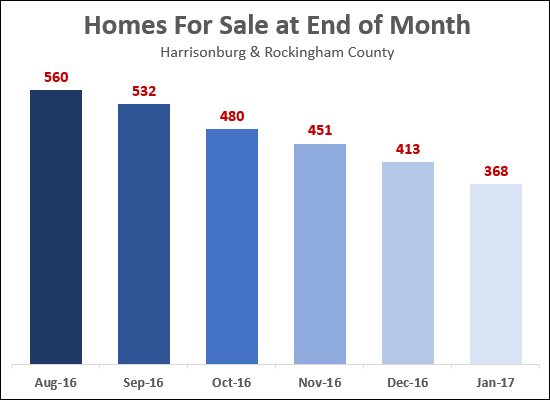 If last year is any indication, get ready to see inventory levels falling over the next few months almost as fast as the leaves are falling off the trees. In all seriousness, though, many buyers these days are having a difficult time finding a home they are excited to purchase -- which is not surprising, as inventory levels have declined 27% over the past year. But it is likely to get (temporarily) worse for buyers. As shown above, inventory levels fell 34% last year between the end of August and the end of January. As such -- look at the meager supply of homes currently on the market -- and then eliminate 1 out of every 3 of those homes. That's likely where we're headed over the next few months. But here's the good news (sorta, kinda, with limitations) -- if you are thinking of selling your home in the next few months, you may have quite a few buyers angling to purchase it if it aligns well with what they are looking for in a home. The sorta/kinda part is that you'll only be good shape if you don't have to buy as well. After all, if we quickly sell your home (because of low inventory levels), but can't find something for you to buy (because of low inventory levels), then we still have problems. Who is the indisputable winner in today's local housing market? The home seller who does not have to buy a home as well. :-) | |
How much of the City of Harrisonburg single family housing stock sells in any given year? |
|
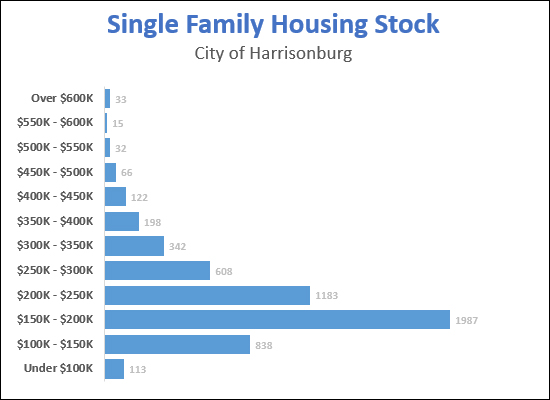 OK -- I'll point out, from the start, that I'm making things a bit more complicated here. I'll partially blame Derik, as he asked the question. OK - the graph above, is the same one I posted yesterday -- a look at how many single family homes exist in the City of Harrisonburg in a variety of price ranges, based on their assessed values. But -- if that's how many actually exist -- it is probably reasonable to wonder how many homes actually sell in each of those price ranges in each year. So, here are the City single family home sales in the same price ranges for all of 2016.... 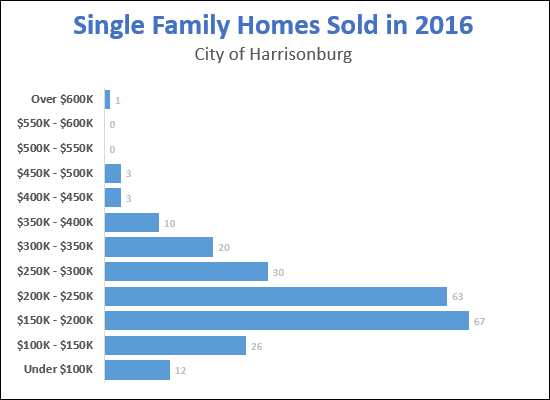 You'll notice that the two graphs above don't look altogether that different. Then, to combine these two, rather than just put really little numbers (how many sell) next to really big numbers (how many physically exist) I thought I"d look at what percentage of each price segment of the City housing stock sells in a given year.... 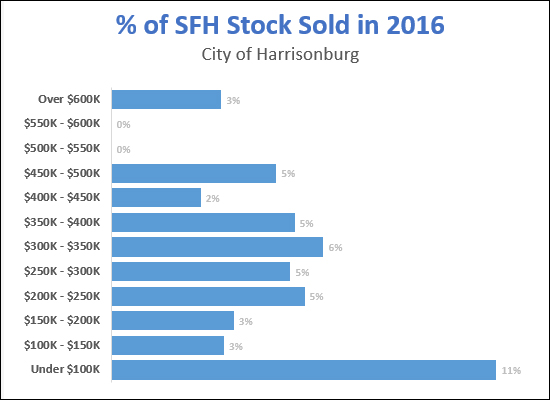 I think this makes it more helpful, though slightly less specifically meaningful absent scrolling back up and also remembering how many houses we're talking about in each given price range. For example, the chart directly above shows that:
OK -- next, a few flaws and disclaimers:
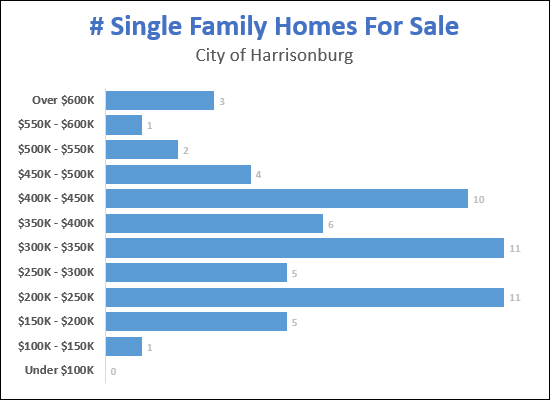
OK -- it continues -- I think it is probably necessary to try to contextualize this with "active listing" data -- to see how some of these numbers compare to what is available today for a buyer to purchase. Here is a breakdown of single family homes currently for sale....
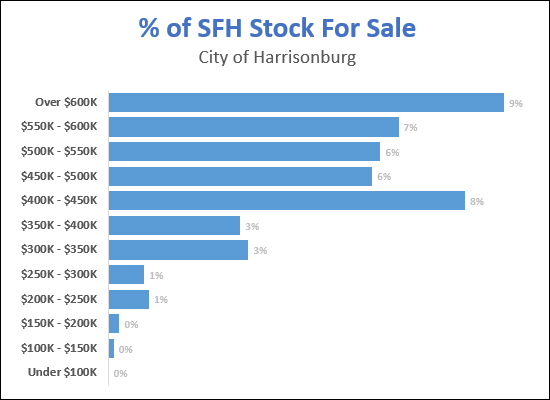
As you can see, above, there are NOT a lot of homes for sale in the City of Harrisonburg right now. And let's see if we can flesh anything out if we break it down by how many homes are available to be purchased as compared to the overall number of homes that actually exist....
This graph might have been the one I was looking for -- at least to support my understanding of the world.... Right now -- almost 9% of the homes over $600K are listed for sale -- and 6% to 8% of homes over $400K are listed for sale in the City of Harrisonburg. On the other hand, only 3% of homes between $300K and $400K are listed for sale, only 1% of homes between $200K and $300K and less than 1% of homes under $200K are listed for sale. This would seem to be about as clear of an indicator as one could find that homes under $300K (or even better, under $200K) are in short supply and in high demand in the City of Harrisonburg. Finally, lastly, ultimately, some "overall market" stats....
Questions? Thoughts? Observations? Insights? Suggestions? Email me: scott@HarrisonburgHousingToday.com | |
Price Distribution of Single Family Housing Stock in the City of Harrisonburg |
|
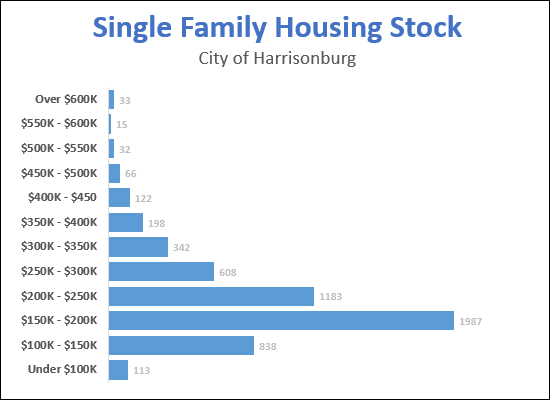 OK -- Take 2 -- Based on some feedback, in smaller price increments this time.... Forget about what actually SELLS in any given timeframe, or even what is available FOR SALE at any given point in time. Let's get down to what housing actually EXISTS in the City of Harrisonburg. The graph above shows the number of single family detached homes (Use Code 006 in the City's property database) that exist in the City of Harrisonburg in (120 different price ranges. The homes are sorted into these price categories based on their 2017 assessed values. So -- what surprises you? If more single family homes are to be built in the City, what price range should they fit into? | |
Single Family Housing Stock in the City of Harrisonburg |
|
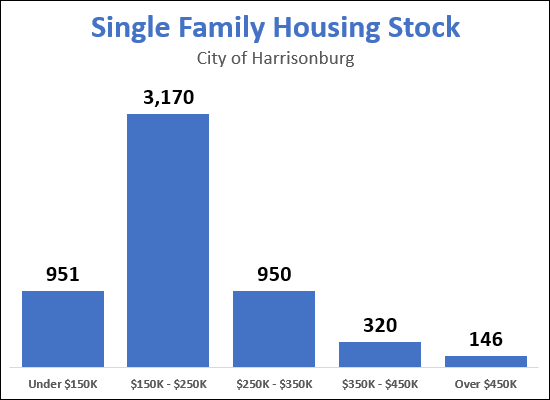 Forget about what actually SELLS in any given timeframe, or even what is available FOR SALE at any given point in time. Let's get down to what housing actually EXISTS in the City of Harrisonburg. The graph above shows the number of single family detached homes (Use Code 006 in the City's property database) that exist in the City of Harrisonburg in five different price ranges. The homes are sorted into these price categories based on their 2017 assessed values. So -- what surprises you? If more single family homes are to be built in the City, what price range should they fit into? | |
Are $150K - $250K Detached Homes Available in the City of Harrisonburg? |
|
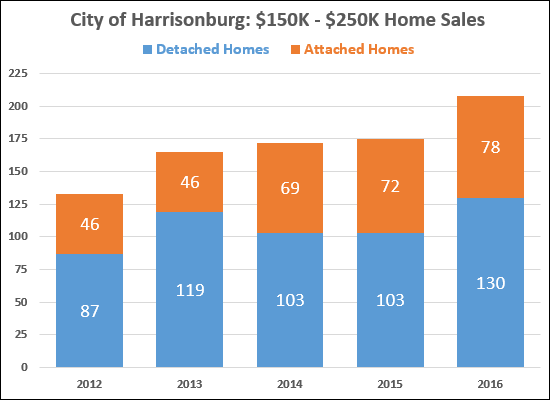 HINT -- this is a bit of a trick question. Again.... Are $150K - $250K Detached Homes Available in the City of Harrisonburg? Ignore the graph above for a moment -- and let's see what we find.... There are only 15 detached homes currently on the market in the City of Harrisonburg priced between $150K and $250K. Wow! At first blush, this is (or seems to be) very significant. One might conclude that we are seeing a significant under supply of these "mid-priced" homes in the City of Harrisonburg, and assume that this under supply is causing very few of these homes to actually sell. But wait -- looking further (now you may refer to the graph above, thank you for your patience) it seems that plenty of these homes are actually selling. In fact, 130 detached homes between $150K and $250K sold in the City of Harrisonburg last year. The tricky part is this -- if 130 buyers are buying per year, that's an average of 10.83 buyers per month. And thus, if there are only 15 such homes on the market, that is a 1.4 month (42 day) supply of homes for sale. Which is -- rather absurdly low. Most folks consider a six month supply to provide a balanced market between buyers and sellers. So -- yes, homes are SELLING between $150K and $250K -- but they aren't widely AVAILABLE at any given point. When they come on the market, they sell quickly! A few other observations....
| |
5.5% Increase in Year Over Year Median Sales Price |
|
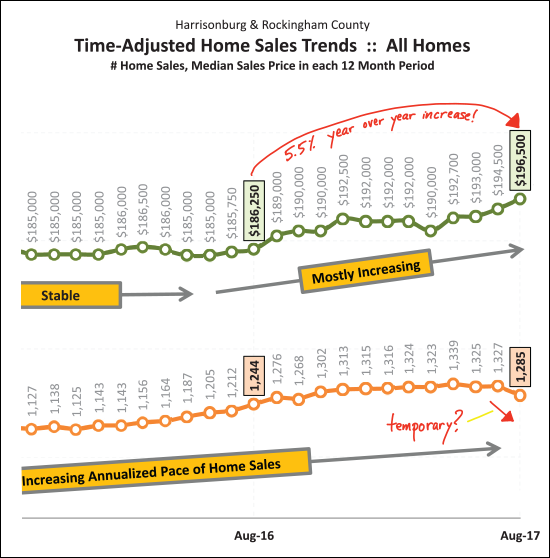 OK -- a slightly complicated headline -- let's break that down.... Looking at home sales over the past 12 months (Sep 2016 - Aug 2017) in Harrisonburg and Rockingham County -- the median sales price was $196,500. Looking at home sales in the 12 months before that (Sep 2015 - Aug 2016) in Harrisonburg and Rockingham County -- the median sales price was $186,250. As such, we have seen a 5.5% year-over-year increase in the median sales price in our local area. That is accompanied by a 3.3% year-over-year increase in the pace of home sales -- from 1244 sales/year to 1285 sales/year. Read a lot more about our local housing market in my post from earlier this week: Housing Market Slows (but prices rise) in August 2017. 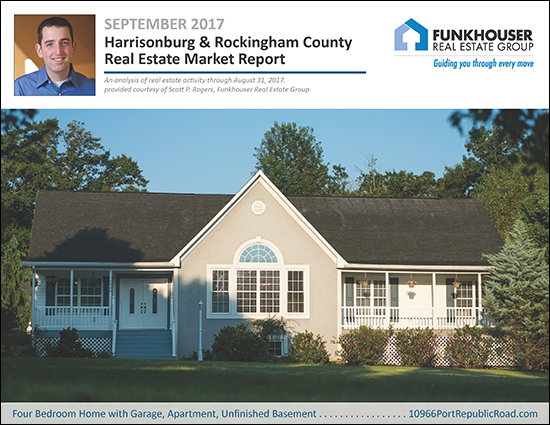 | |
Housing Market Slows (but prices rise) in August 2017 |
|
 Find out more about the home shown above, with detached garage and apartment, here. As Geoffrey Chaucer put it - "all good things must come to an end" -- and August 2017 is when the "more and more home sales, every month, for ever and ever" came to an end in the Harrisonburg and Rockingham County housing market. OF NOTE -- this could be a temporary end, and it might be more about a lack of seller supply than a lack of buyer demand -- but I'm getting ahead of myself. I just published my most recent monthly market report, and as usual, you can read on for an overview, download the full report as a PDF, read the entire report with commentary online, or tune in to my monthly video overview of our local housing market...  OK, now, if you're still reading after that super easy opportunity to just listen to me explain the entire market to you, here is some further context and explanation for you.... 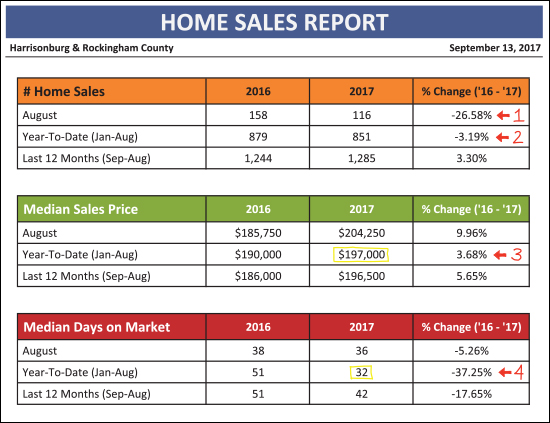 As shown above (#1), there was a significant (26.58%) decline in August home sales this year as compared to last year. This lead to (#2) an overall decline in year-to-date sales of 3.19% when comparing 2016 to 2017. Despite this slowdown in the pace of sales, the median sales price (#3) is still increasing year-over-year at a pace of 3.68% to the current level of $197,000. Furthermore, the pace at which homes are selling (#4) continues to accelerate -- with a 37.25% decline in median days on market over the past year. So --- slightly fewer homes are selling... faster... at higher prices. 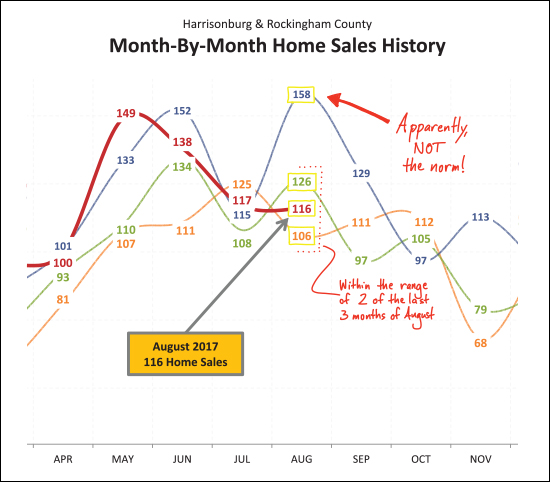 So -- here is the pretty (not pretty) picture of the difference between last year's SOARING month of 158 home sales in August 2016 -- and in comparison, the LOWLY month of 116 home sales in August 2017. Apparently, 158 home sales in the month of August is NOT the norm -- perhaps it was the result of a slow July 2016? AND -- if it is any consolation, the 116 home sales seen in August 2017 is within the range of two of the last three months of August. Hmmm....still hard to get excited about only 116 home sales in August! 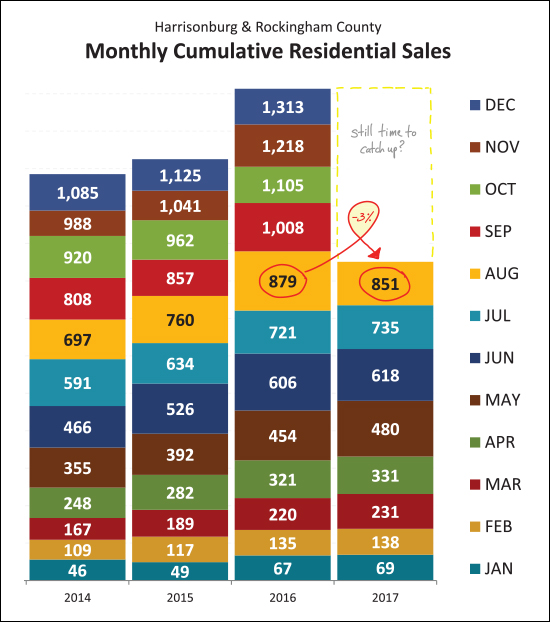 Here's another visual example of how things have changed -- every month thus far this year we have been "ahead" of 2016 home sales -- until August. We've now fallen behind (by 3%) and we only have four months to catch back up to match the overall pace of home sales in 2016. I suppose it is worth noting that there was a massive 16.7% increase in home sales between 2015 and 2016 -- so if we fall slightly short this year, it will still mark significant net growth in the pace of home sales as compared to 2014 and 2015. 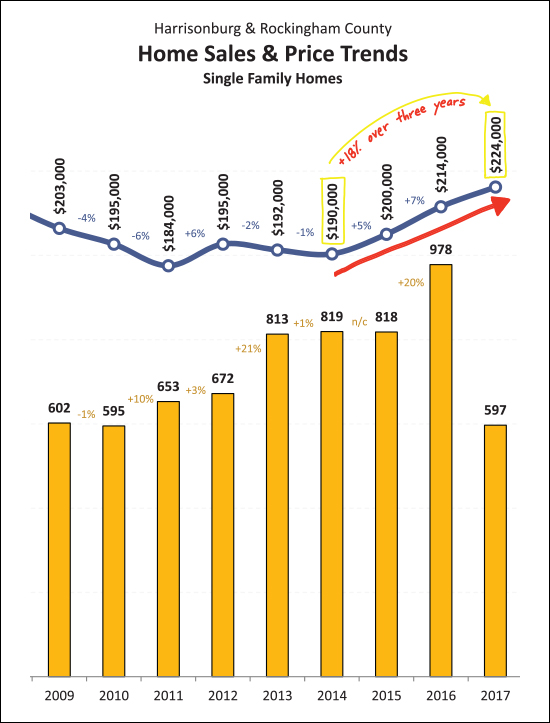 OK -- maybe I was looking for a bright spot amidst a so-so month of real estate news -- but here you go! As shown above, the median sales price of single family homes has risen 18% over the past three years! Of note -- we're close (but not quite there) to getting back up to the all-time high for our area's annual median sales price for single family homes -- which was $226,800 back in 2006. 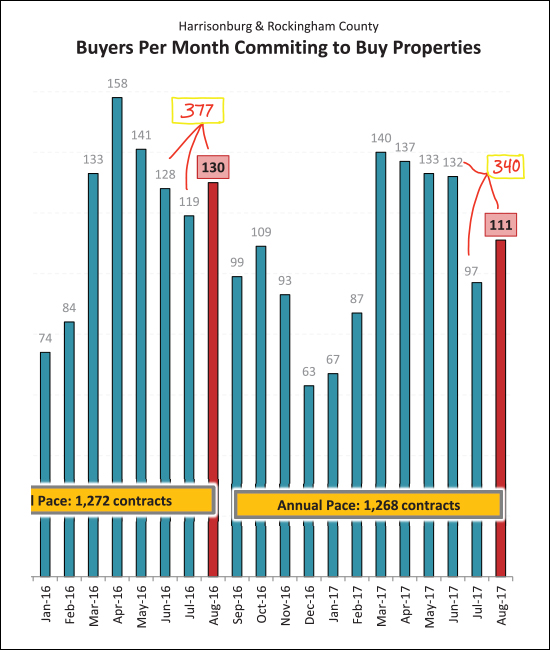 OK -- back to the not-quite-as-peppy news -- contracts were down in August as compared to last August. In fact, looking at summer (June, July, August) contracts -- there were only 340 of them signed this year, as compared to 377 last year. Possible explanations for this decline in contract activity include:
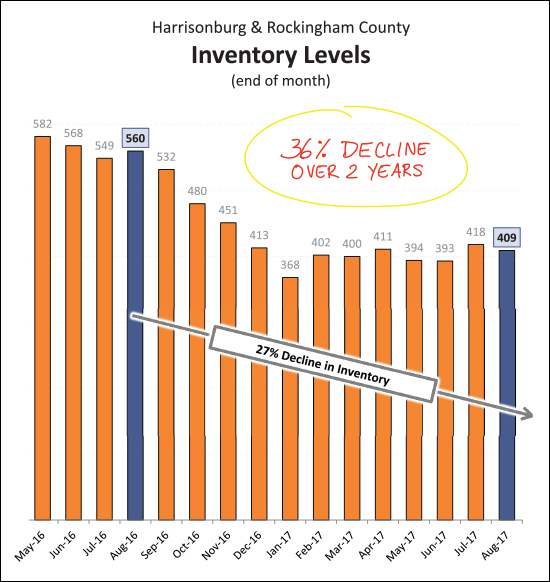 Indeed, as shown above, buyers today have 27% fewer options of homes to purchase in Harrisonburg and Rockingham County as compared to one year ago -- and 36% fewer homes to choose from as compared to inventory levels two years ago. This decline in inventory is likely playing a role in the slight (3%) year-over-year decline we are seeing in home sales in this area. OK -- I'll stop there for now. I will continue to explore the latest trend in our local housing market in the coming days on my blog. Until then -- feel free to download and read my full market report as a PDF, or read the entire report online. And, my reminders for buyers and sellers last month still apply.... SELLERS -- even though it is a seller's market in many price ranges right now, you must still focus on price, condition and marketing. For further reading on buying or selling in this area, check out.... | |
Single Family City Homes Under $200K (even $300K) in Short Supply |
|
 Some of these numbers are hard to fathom.... [1] Even though (65) single family homes sold between $100K and $200K in the City in the past year -- there are only (5) such homes available for purchase today!?! [2] Likewise, even though (83) single family homes between $200K and $300K sold in the past year, only (17) are available today. [3] The under $100K market is largely gone for single family homes in the City -- no surprise there. [4] While not shown specifically above (additional math required) a full 79% of single family home buyers in the City in the past year spent less than $300K. [5] Only 9% of City single family home buyers spent over $400K. | |
Harrisonburg Area High End Home Sales |
|
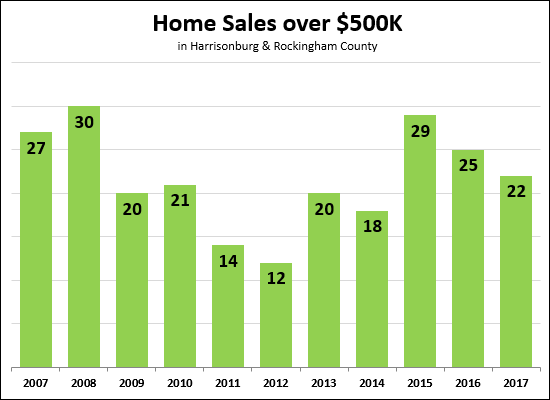 High end ($500K+) home sales slowed slightly in 2016 (25 sales) as compared to 2015 (29 sales) -- but it seems likely that this price range will rebound to those 2015 levels in 2017. With another four months of sales to go, it seems likely that we will see at least seven (and maybe more?) sales over $500K. In fact, there are currently three homes over $500K under contract. 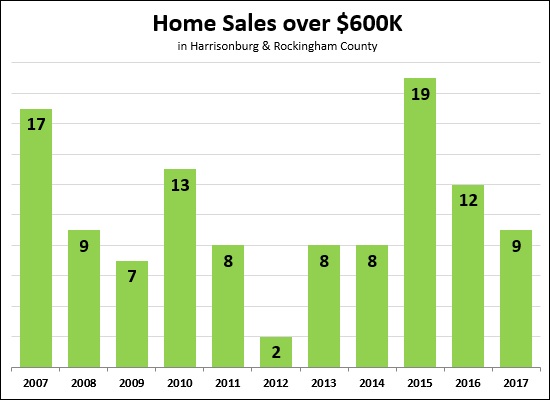 Home sales over $600K, however, are another story. Looking back, 2015 was an incredible year of sales for this price range -- with 19 sales -- higher than any other year in the past ten years! While we will likely see more sales this year (9 so far) than last year (12 total) it does not seem we will match the 19 sales seen in 2015. 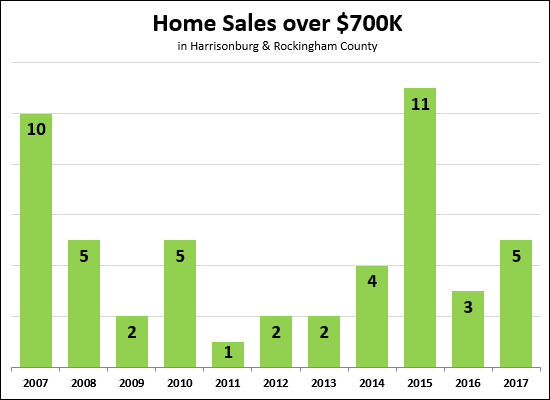 Finally -- the $700K+ price range -- where we seem to have returned to normal-ish levels in 2016/2017. Looking back, it is quite astounding that 11 of these homes sold in 2015 -- this was far and above the amount of $700K+ home sales we had seen in a single year since all the back in 2007. | |
Price Per Square Foot Steadily Rising |
|
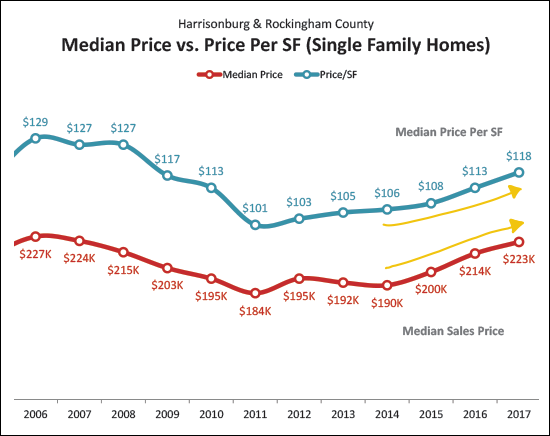 The price per square foot of homes in Harrisonburg and Rockingham County has been steadily increasing over the past six years....
That said -- while the median sales price ($223K) has nearly climbed backup to the high we saw in 2006 ($227K) -- the median price per square foot ($118) has actually not come anywhere closer to that 2006 high ($129). Which would seem to mean that you're getting slightly more house for your money now (as compared to 10-11 years ago) even if you're paying a similar price. | |
This is not a balanced real estate market |
|
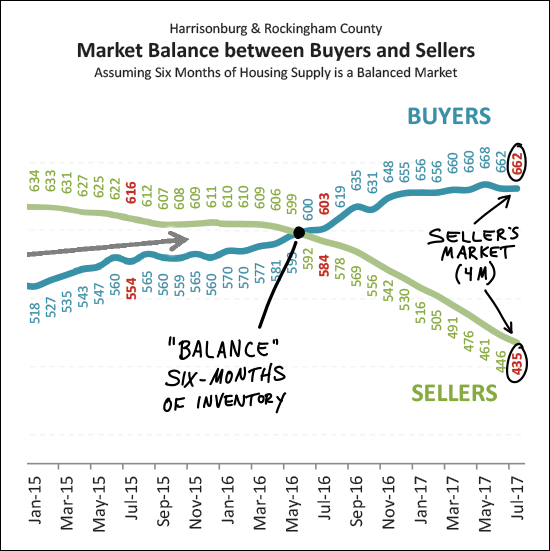 Most housing market analysts consider six months of inventory (active listings) to be an indicator of a balanced market (between buyers and sellers). The "BUYERS" trend line above is illustrating how many buyers are buying in a six month period. The "SELLERS" trend line above is illustrating how many sellers are in the market (active listings) at any given time. Over the past four years we have seen a steady increase in buyers and a declining number of sellers. In June 2016, these two trajectories crossed, and there was no turning back. There are now many more buyers buying in a six month period than there are homes for sale -- creating a seller's market. Instead of having a six month supply of homes for sale, we now have a four (3.95) month supply. Of note -- it is not a seller's market in every price range, in every location, for every property type -- but overall, we are definitely seeing a seller's market. Find out more about our local housing market by clicking below for my monthly market report.  | |
Home Sales Steady, Prices Rising in Harrisonburg Area |
|
 The beautiful home shown above is located in Kentshire Estates. Find out more here. July 2017 has come and gone -- and even if the temperatures don't yet feel like August -- that last month of summer is really upon us. I just published my most recent monthly market report, and as usual, you can read on for an overview, download the full report as a PDF, read the entire report online, or tune in to my monthly video overview of our local housing market... 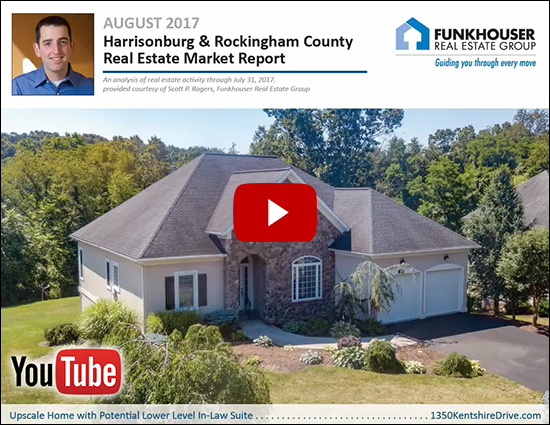 You'll find that the video is in a new format this month, which I think you'll find much more helpful. Let me know. (click above to watch it) And now, a few items on our overall housing market.... 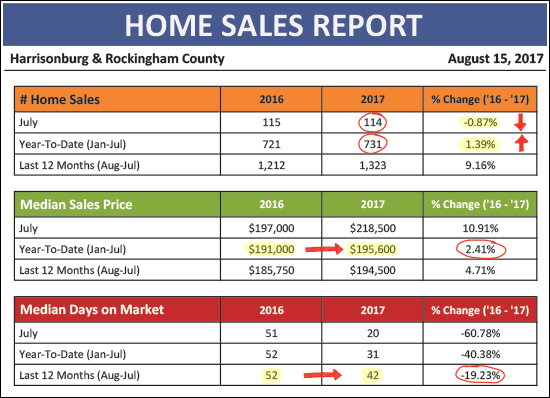 As shown above, home sales slowed, ever so slightly, in July 2017 -- to 114 sales, as compared to 115 last July. Home sales for the entire first seven months of the year, however, remained strong, at 731 home sales -- an increase of 1.39% over the pace of last year's home sales. Also of note, the median sales price has increased 2.41% over the past year, to a price of $195,600 --- and homes are selling 19% faster this year, in a median of 42 days. 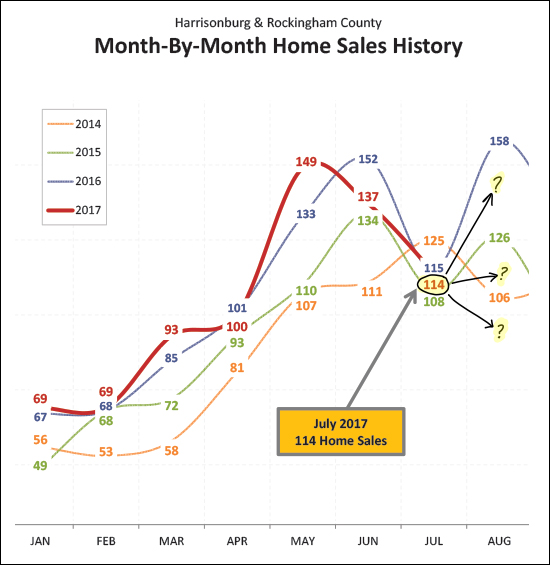 And....where do we go from here? We saw strong home sales in May and June -- but then a decline in July that put us in the middle of the pack as far as a typical July. Now, though, will we see a huge bump like last August? Or will home sales stay relatively steady, or even decline, in August? 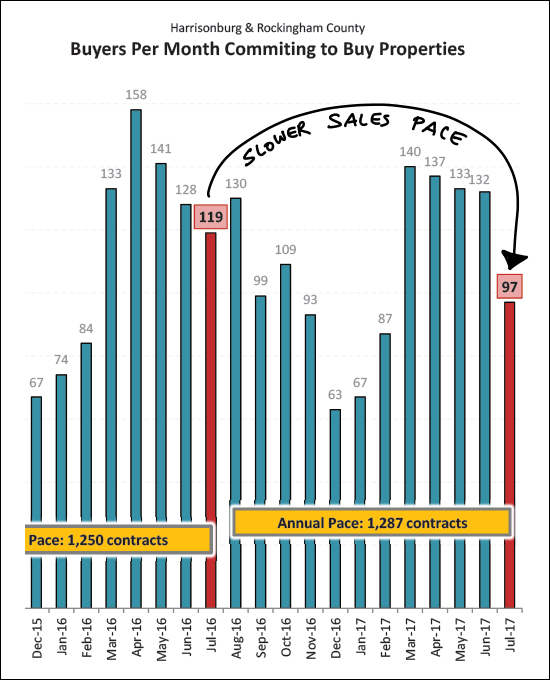 Based on the slowing rate of buyers signing contracts (shown above) I'm guessing we'll won't see a big upward spike in home sales in August. And perhaps, the slightly slower sales we're starting to see this year is a result of continually declining inventory levels.... 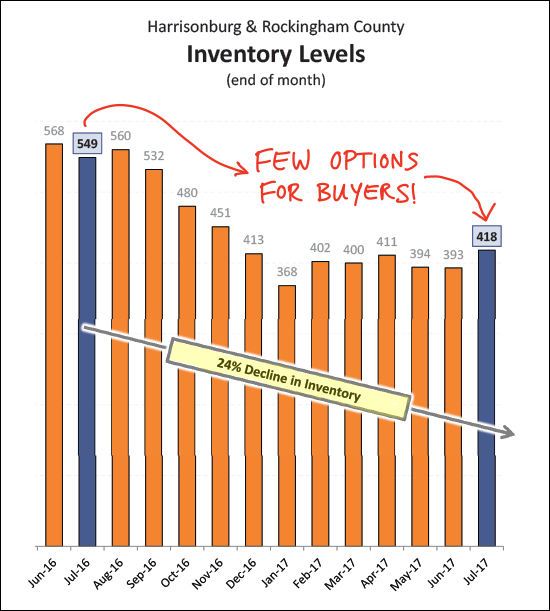 While we did see a slight upward tick in our inventory levels in July, overall, buyers still have significantly fewer options when buying in Harrisonburg and Rockingham County. And what does an increasing demand and decreasing supply lead to? 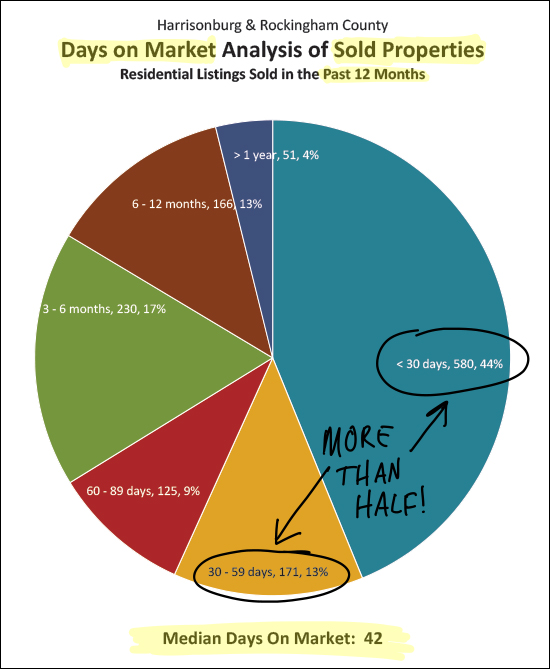 First of all, homes are selling quickly! Over half of the homes that sold in the past year went under contract within 60 days of being listed for sale. Actually, almost half of them (44%) went under contract in less than 30 days!?! 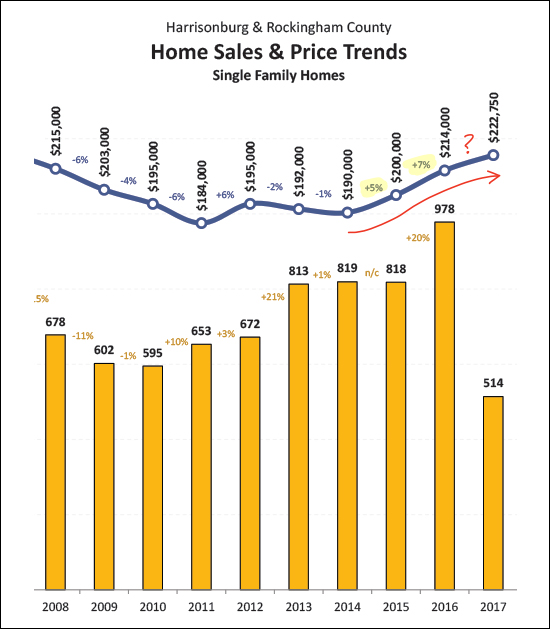 And, not only are homes selling faster, they are selling at higher prices as a result of more buyers and fewer sellers. The median sales price of single family homes has been increasing in recent years, which is likely at least in part due to more buyers buying and fewer sellers selling. Will we see another 5% or 7% increase in this median sales price this year? Only time will tell - but my money is on a 4% - 5% increase. There are actually quite a few astonishing tidbits in this month's report, but I'll get into those in the coming days on my blog. Until then -- feel free to download and read my full market report as a PDF, or read the entire report online. And, my reminders for buyers and sellers last month still apply.... SELLERS -- even though it is a seller's market in many price ranges right now, you must still focus on price, condition and marketing. For further reading on buying or selling in this area, check out.... | |
Home Buying Pace Slower This July Than Last |
|
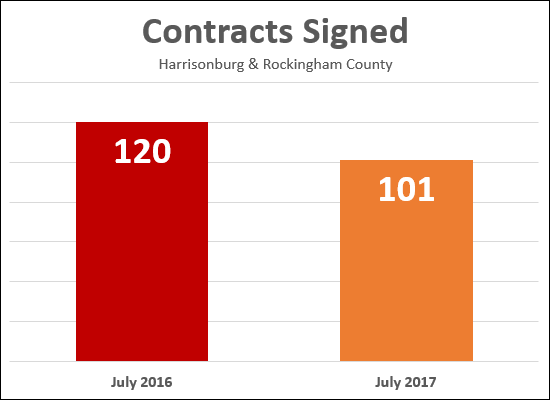 16% fewer buyers signed contracts in July 2017 as compared to July 2016. It's hard to say if this is related to lower buyer interest (I doubt it) or lower inventory levels (I suspect it). I suspect we will still end up seeing just as many home sales in 2017 as we saw in 2016 -- but I don't think we'll see a significant increase in the number of homes selling this year. | |
| Newer Posts | Older Posts |
Scott Rogers
Funkhouser Real
Estate Group
540-578-0102
scott@funkhousergroup.com
Licensed in the
Commonwealth of Virginia
Home Search
Housing Market Report
Harrisonburg Townhouses
Walk Through This Home
Investment Properties
Harrisonburg Foreclosures
Property Transfers
New Listings

