| Newer Posts | Older Posts |
January Inventory vs. Past Year of Home Sales |
|
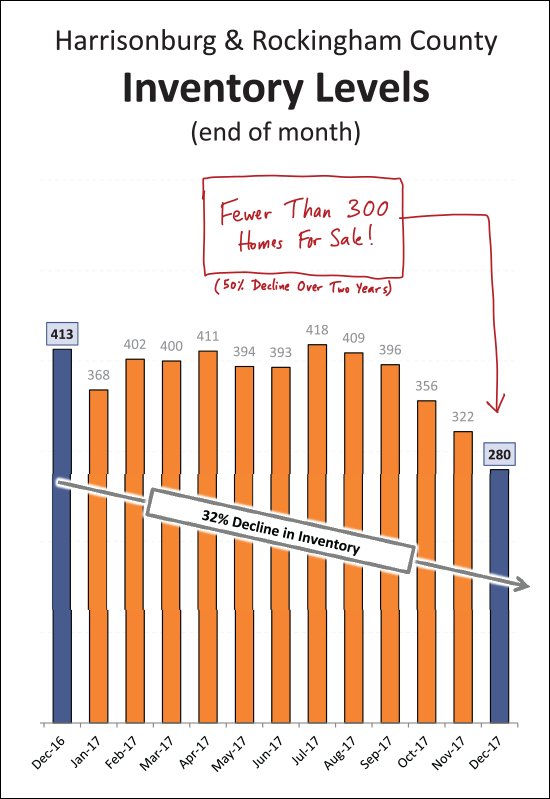
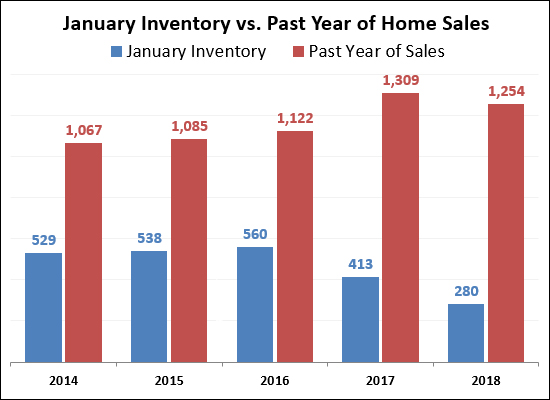 In 2014, 2015 and 2016 we started off the year with enough homes actively listed for sale to last us for right around six months -- or a bit longer. This balance (a six month supply of housing inventory) is considered by many analysts to be an indicator of a balanced housing market. Last year (2017) was quite different. Inventory dropped 26% from 2016 to 2017 and sales rose 17%. As you would, thus, expect - we started off last year (Jan 2017) in a slightly different spot, as shown above. Which is, arguably, why we ended up seeing slightly FEWER home sales last year -- sales declined 4% in 2017 from 1309 to 1254. So, now, starting of 2018 -- are things any better? No. There are even FEWER homes for sale now than there were a year ago. Inventory levels dropped another 32% between January 2017 and January 2018 -- and the current inventory of active listings (280 homes) will / would only last us 2.7 months -- as compared to that balance point of six months. So, what then will this lead to in 2018? I am predicting slightly fewer sales than last year -- and likely faster sales -- and at slightly higher prices. Stay tuned! | |
Last Call for City Homes Under $200K |
|
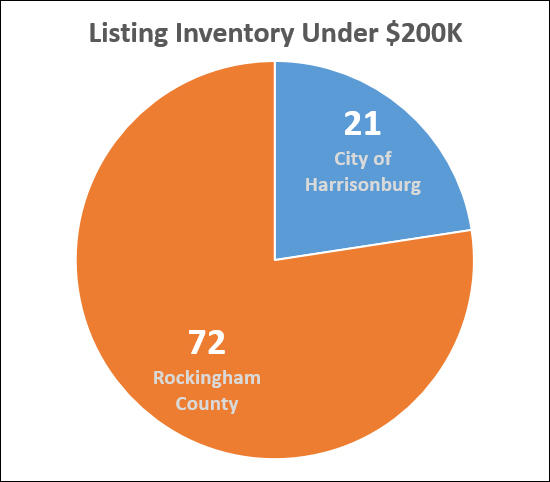 There are fewer and fewer homes for sale under $200K in Harrisonburg and Rockingham County. Here's what the inventory numbers have looked like over the past few years....
That has now fallen a bit further, to 93 homes for sale under $200K in the City and County -- but even more interesting is where those homes are located....
And it probably woulnd't surprise you that only 5 of the 21 City homes under $200K are actually single family detached homes -- the other 16 are townhouses, duplexes or condos. Prices are rising -- which makes homes under $200K harder and harder to come by, especially in the City. | |
In 2017, Median Sales Price Finally Surpasses 2007 Peak |
|
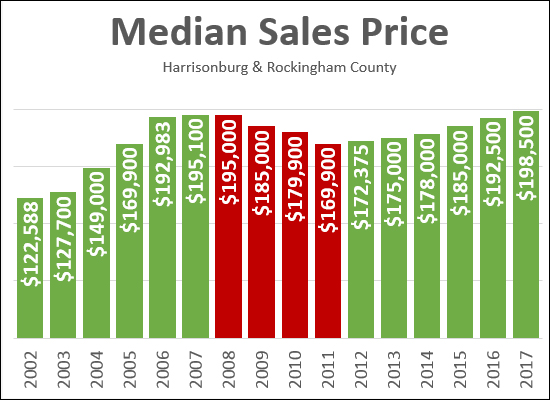 It should be noted, perhaps with some fanfare, that in 2017, the median sales price in Harrisonburg and Rockingham County finally surpassed the prior peak seen in 2007. Yes, that 2007, the one after a rapid run up of sales prices as a result of a largely nationwide real estate BOOM, followed thereafter by a decline in sales prices, at different speeds in different areas. But now, in 2017 -- ten years later (!!!!) -- we finally hit a median sales price of $198,500 -- slightly edging out that previous high of $195,100 seen in 2007. Thank goodness. Now, folks who bought in 2006, 2007 or 2008 might finally not be underwater based on their original purchase price. It's been a long time coming.... | |
Determining An Offering Price on a Property in a Neighborhood |
|
 How does one determine an offering price in a neighborhood? Start 5% below asking price? Start at the tax assessed value? Start at the price the seller paid, adjusted per market changes since that time? Start $1K lower than the list price for every day it's been on the market? Start at full price if it's a new listing and you think it will sell quickly? Many or all of these strategies are likely to lead you astray. In theory -- you should be willing to pay approximately the same price as other buyers have paid for approximately similar homes in the recent past. For example....
When you then are considering a new listing of a 3 BR, 2 BA, 1800 SF, circa 2000 home -- it would seem reasonable to think that you'd likely pay between $245K and $255K. Of course, there are a variety of other extenuating factors that can affect this pricing:
So -- how does one best research what homes are selling, and at what prices? I'll remind you of -- HarrisonburgNeighborhoods.com. 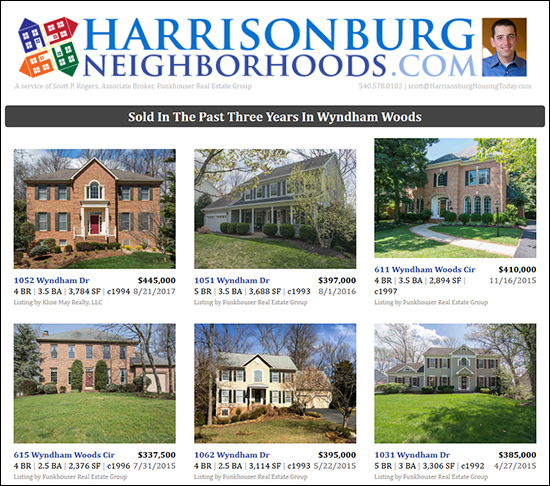 On this handy new website, among other things, you can find a three year history of the sales prices in each of 34 neighborhoods in and around Harrisonburg. I hope that HarrisonburgNeighborhoods.com continues to serve as a helpful resource to you as you research home values, monitor for new listings, and more. Don't forget -- you can sign up to receive email alerts of all new listings and recent sales in any of the 34 neighborhoods! | |
Local Home Values Rise in 2017 |
|
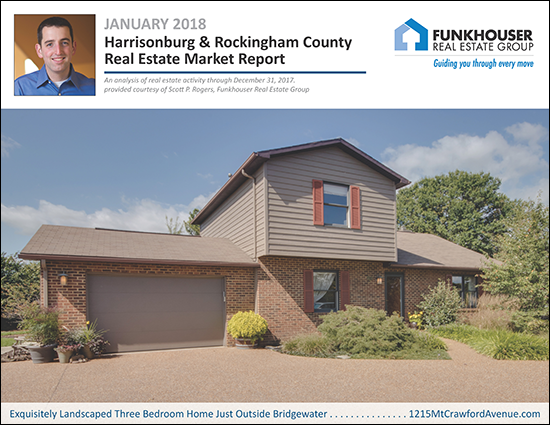 Find out more about this stellar home just outside Bridgewater at 1215MtCrawfordAvenue.com. I just published my most recent monthly market report, and as usual, you can read on for an overview, download the full report as a PDF, read the entire report with commentary online, or tune in to my monthly video overview of our local housing market...  OK - now, let's dive into the market data behind this month's report.... 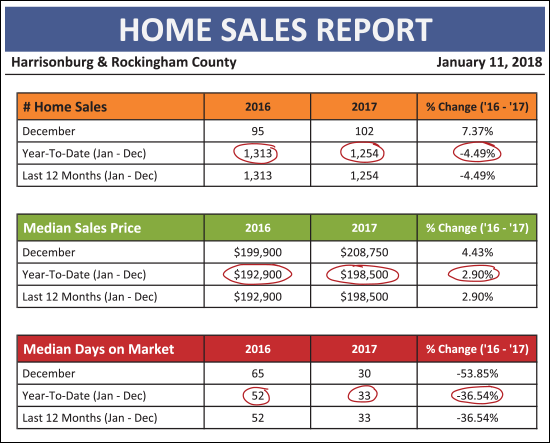 As shown above....
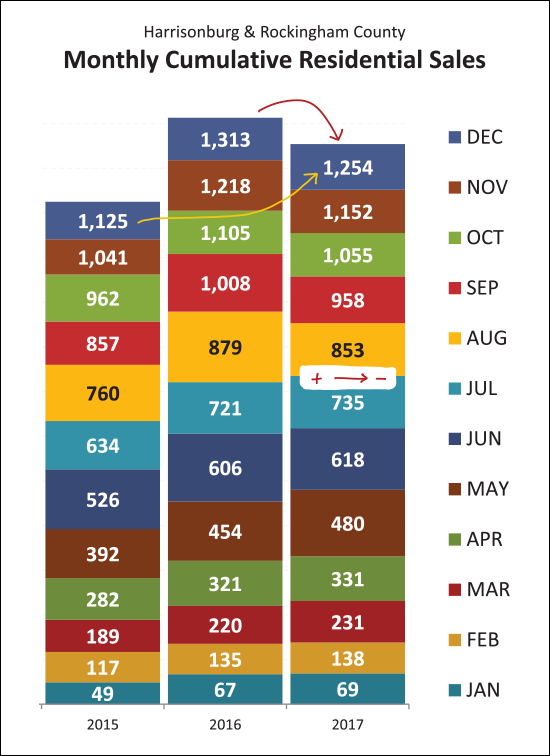 Two observations here (above)....
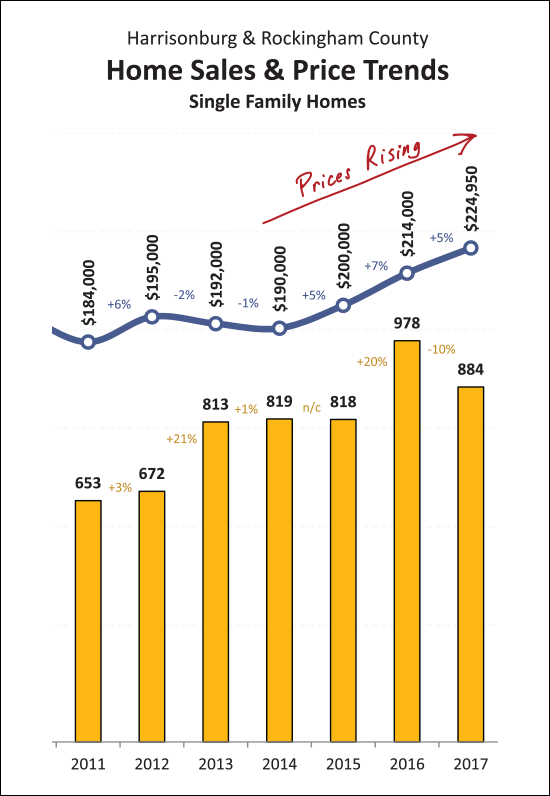
Perhaps the truest analysis of the trends in housing values -- single family homes on their own. The waters can be muddied, a bit, on townhouses, duplexes and condos -- with investors buying the properties as rentals. Most single family homes are bought as residences, and thus there are fewer external factors that affect these home sales. As noted above, there were 10% fewer single family home sales in 2017 -- but the median price rose for the third year in a row, to $224,950. This is a good indicator that home values are rising in our area. And finally, the disturbing statistic I was hesitant to even go look for this month....
Indeed -- after free falling for most of 2017, the number of homes for sale in Harrisonburg and Rockingham County has now plunged below 300 -- to only 280 homes for sale as of this morning!?! Two crazy further notes -- there are only 46 townhouses/duplexes/condos listed for sale in the entire City/County -- and there are only 64 homes for sale in the City of Harrisonburg!?! OK -- I'll stop there for now. There is plenty more in my full market report, so feel free to download it as a PDF, read the entire report online, or watch/listen to a video overview of this month's report. And, my reminders for buyers and sellers last month still apply.... SELLERS -- even though it is a seller's market in many price ranges right now, you must still focus on price, condition and marketing. For further reading on buying or selling in this area, check out.... | |
My Predictions for the 2018 Real Estate Market |
|
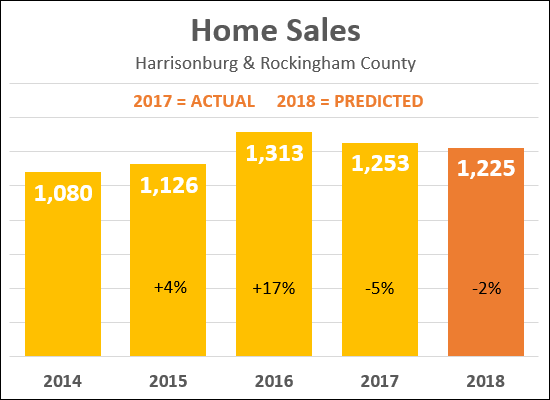 As is my annual tradition, I am making some predictions about what we'll see in the Harrisonburg and Rockingham County real estate market in 2018. As you'll note below, I am optimistic about the coming year as it pertains to home values -- but as shown above, not so much when it comes to sales volume. Just as we saw a 5% drop in sales in 2017 -- I believe we will see a further decline in the number of home sales in 2018. I am predicting a 2% year-over-year decline in the number of homes being sold. This will largely be a result of a lack of supply -- not a lack of demand. I believe we will still see high levels of buyer interest in many or most price ranges, but a lack of housing supply (listing inventory) will keep us from seeing as many home sales as we did in 2016 and 2017. 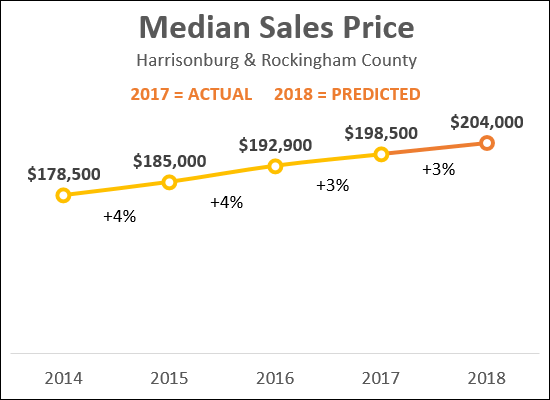 As shown above, I am predicting another 3% increase in the median sales price during 2018. Over the past several years we have seen steady increases in the median sales price, and I believe that trend will continue, partially as a result of continued high demand for housing and low supply of housing. My hope is that we do not see a significant increase (greater than 6%) in the median sales price, as these types of increases are typically short-term, cannot be sustained, and can lead to future downward corrections. Those are my predictions, what about for you? Email me (scott@HarrisonburgHousingToday.com) and let me know where you think our local market will go in 2018. And keep up with all the market data between now and December 31 by signing up to receive my monthly housing market report by email if you are not already receiving it. | |
Comparing My 2017 Housing Market Predictions To Reality |
|
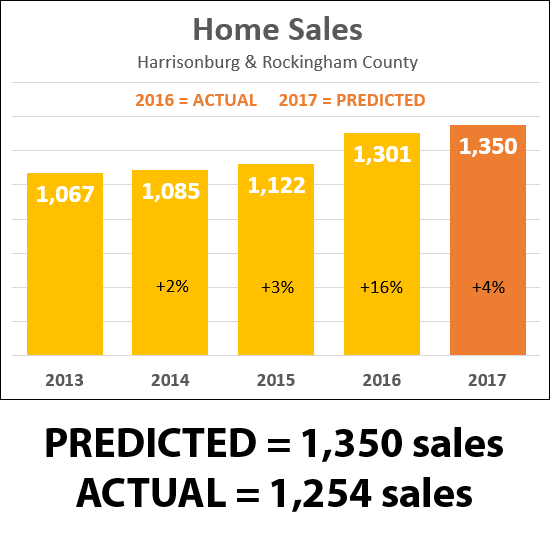 As shown above, I was horribly inaccurate with my prediction of how many home sales we would see in 2017. After a 16% increase in the pace of sales between 2015 and 2016 I thought I was being sufficiently conservative to only point to a potential 4% increase in the pace of sales between 2016 and 2017. Perhaps what I did not fully account for was the limiting impact of low inventory levels -- which I believe are a key reason why we did not see more home sales in 2017. So -- not only did we not see 1350 home sales in 2017 (as I predicted) we also did not see 1301 home sales (the 2016 total). We ended up with right around 1,254 home sales for 2017. Now, let's see how I did in predicting market values in 2017.... 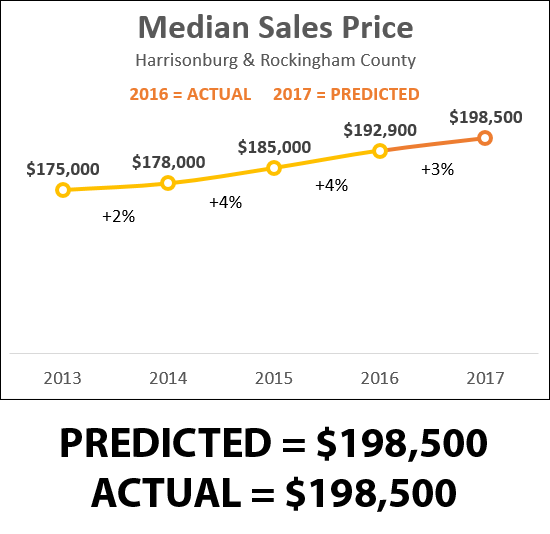 Woah! I think I'm going to say his prediction mattered much more than the first. :) As you can see -- I predicted that we would see the median sales price climb from $192,900 up to $198,500 in 2017. And --- it did! The median sales price for the 1,254 sales reported thus far in the Harrisonburg-Rockingham MLS show a median sales price of.... $198,500! That means (as conveniently shown in this one year old graph above) we ended up seeing a 3% increase in median sales prices -- only slightly below the 4% increases seen in 205 and 2016. Stay tuned for some predictions for 2018 in the coming days! | |
Home Sales Slow By (perhaps as much as) 5% in 2017 |
|
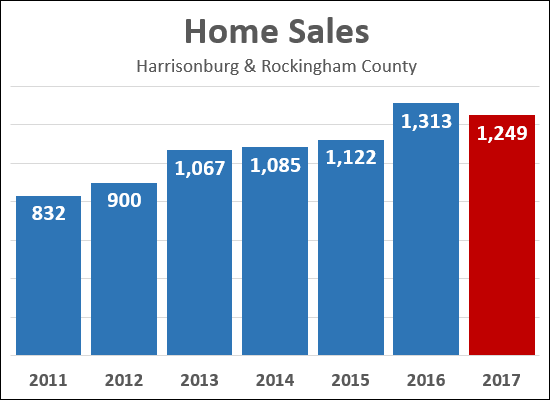 All home sales have not yet been reported but it is now clear that we did not clear the 1300 sales/year mark in Harrisonburg and Rockingham County last year. With 1,249 home sales recorded in the MLS thus far, we are likely to see that figure rise a bit more over the next few days, but not by much. This is a slight drop off compared to last year after several years of increases over previous years....
Stay tuned for my full market report in the next week or so, as well as predictions for the 2018 housing market. Oh, and HAPPY NEW YEAR! | |
Price Per Acre of Land Sold in Rockingham County |
|
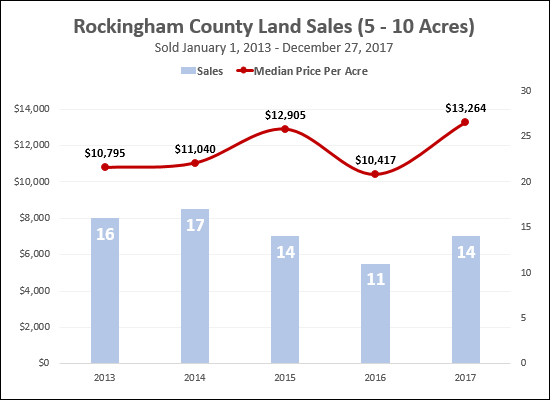 As shown above, the price per acre of 5 - 10 acre tracts has increased over the past several years to a median of $13,264 per acre. We are consistently seeing between 10 and 20 (between 11 and 17) of these parcels selling each year. 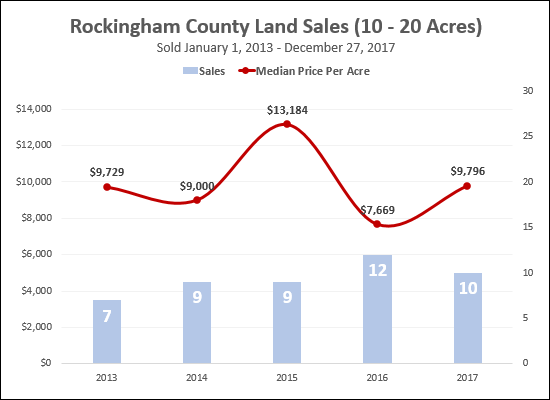 The median price per acre of 10 - 20 acre tracts jumped up to $13,184 in 2015, but settled back down in 2016 to $7,669 and has now risen again in 2017 to $9,796. The small-ish number of sales per year in this price range leads to more variability in the median sales price per acre depending on which particular tracts sell in any given year. 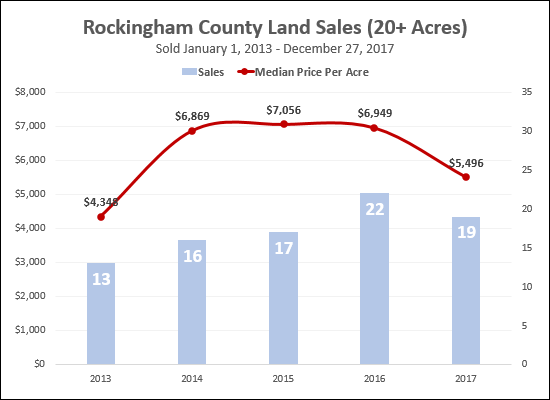 We saw almost 20 sales over 20 acres this year -- but the median price per acre fell from $6,949 (last year) to $5,496. | |
Bidding Wars over City Townhouses |
|
 The last few townhouses listed for sale in the City of Harrisonburg (under $175K, built since 2000) have gone under contract QUICKLY -- with multiple offers. So far, we have not seen a wild uptick in median prices of townhouses based on this excessive demand (and limited supply) but we could start to see that at some point.... Median Townhouse/Condo Sales Price in Harrisonburg and Rockingham County:
If you are fortunate enough to own one of these -- and be in the market to sell it -- you should not have difficulty in securing a buyer. If you are unfortunate enough to want to buy one of these -- bid early, bid aggressively, and if you keep missing out on properties, be prepared to bid often. | |
Fewer and Fewer Foreclosures |
|
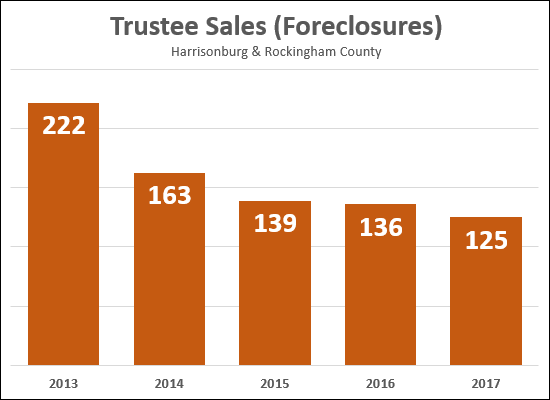 Well, here's a good indicator that our local housing market continues to become healthier over time -- as shown above, the number of foreclosure sales per year has continued to decline over the past several years. To put these into an even larger context:
All in all, it is a good sign for our local housing market when the number of foreclosures per year declines. It means more homeowners are able to stay in their homes, and make their mortgage payments, which is a general sign of a stronger local economy. | |
Median Sales Price Poised To Increase 3% in Harrisonburg, Rockingham County in 2017 |
|
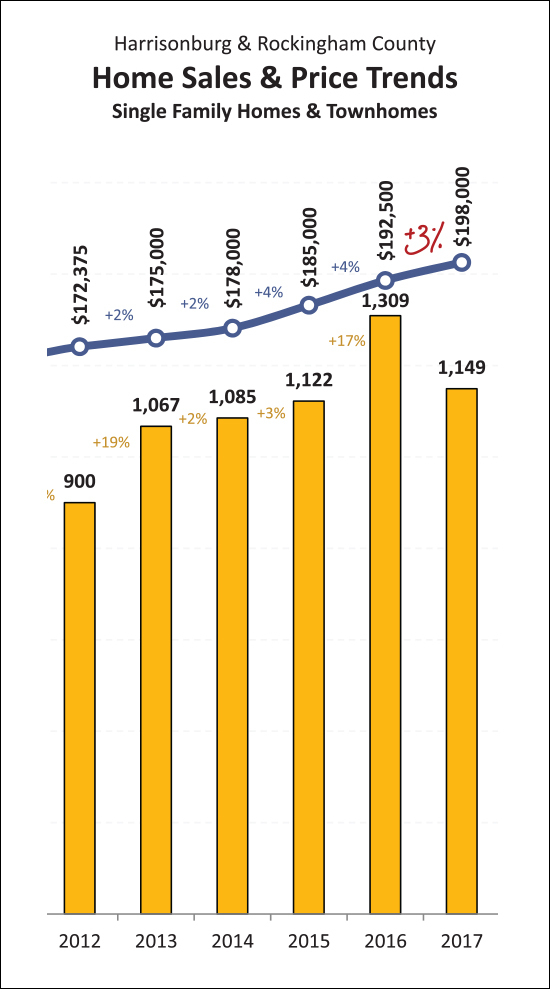 With 11 out of 12 precincts reporting -- wait, no, that was earlier this week -- With 11 out of 12 months behind us this year, it seems that the median sales price of residential properties (single family homes, duplexes, townhomes, condominiums) will have increased by 3% in 2017 to $198,000. A bit more context, not shown above....
So -- we might finish the year with the highest median sales price seen anytime in the past fifteen years -- and ultimately, the highest median sales price, ever, in Harrisonburg, Rockingham County. Read more about our local housing market via my market report published yesterday.... | |
Local Home Sales Slow, As Inventory Declines, But Prices Are Rising! |
|
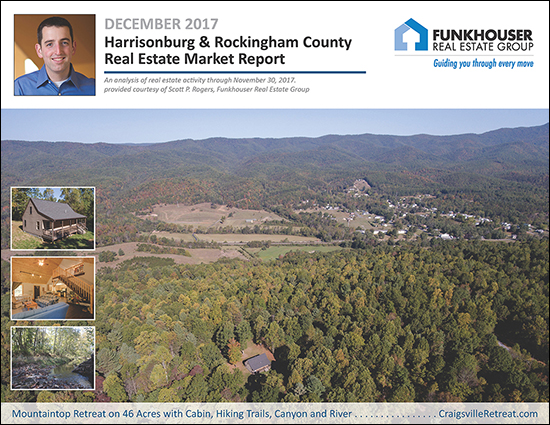 Find out more about this Mountaintop Retreat on 46 acres with a cabin, hiking trails, canyon and river here. I just published my most recent monthly market report, and as usual, you can read on for an overview, download the full report as a PDF, read the entire report with commentary online, or tune in to my monthly video overview of our local housing market... 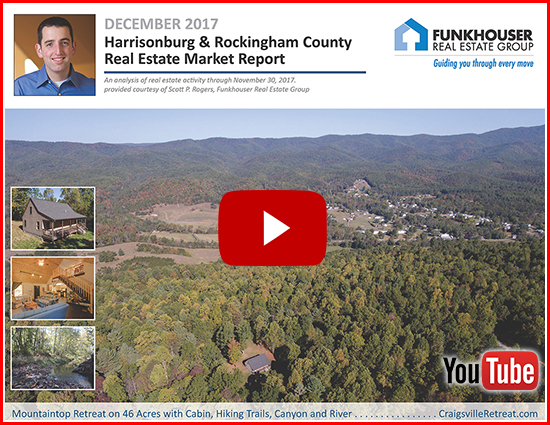 Now, let's take a closer look at some of this month's data.... 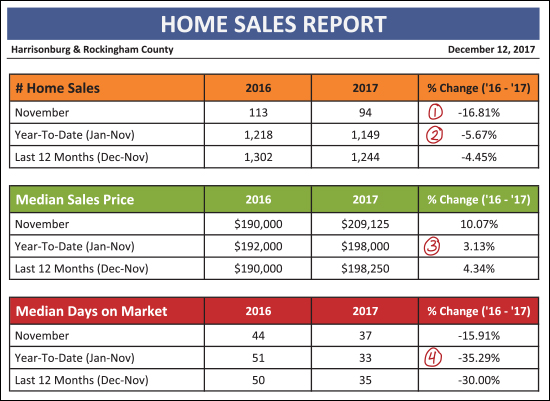 As can be seen above....
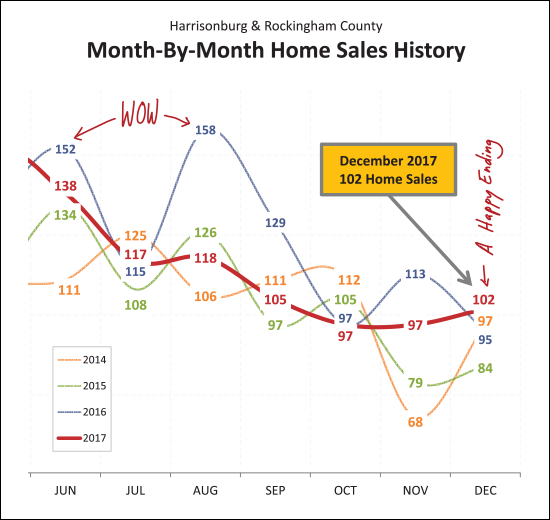
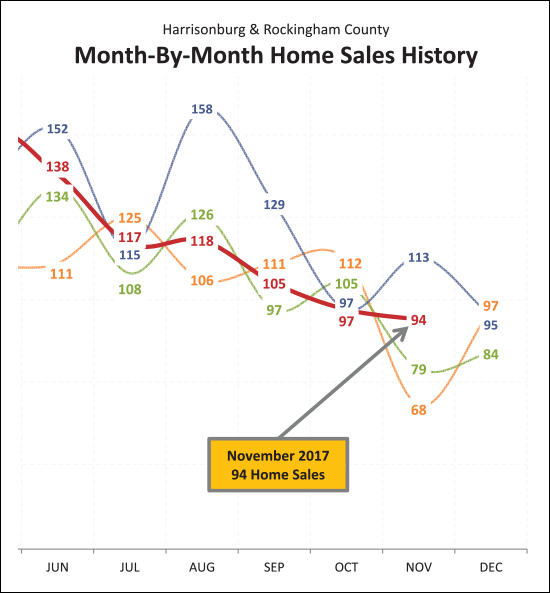
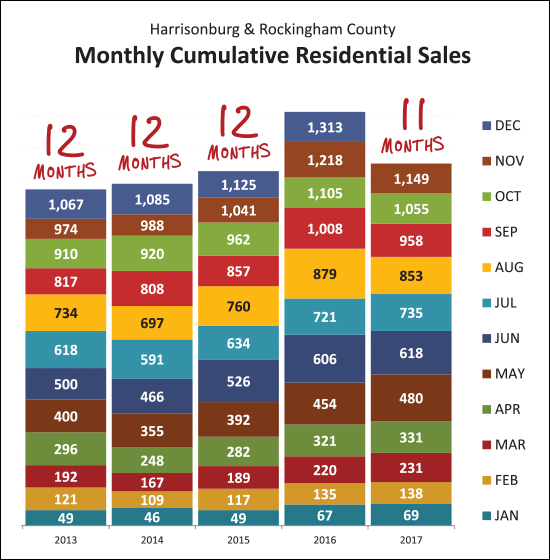
Last year certainly was interesting!?! Or odd!?! Last August, September and November were OFF THE CHARTS as far as a record number of home sales for those months -- which then makes this year's sales trajectory seem as slow as mud in August, September and November. This November's sales were a good bit higher than in 2014 and 2015 -- but were solidly below November 2016.
So -- despite the fact that 2017 is hiding in the shadows of a towering year of sales in 2016 -- it is interesting to note that the 11 months of home sales thus far in 2017 (all 1,149 of them) has already surpassed the full 12 months of sales seen in 2013 (1067 sales), 2014 (1085 sales) and 2015 (1125 sales). As such -- while total home sales will likely be 5% to 6% lower this year than last -- that will still mark a solid improvement as compared to any other recent year.
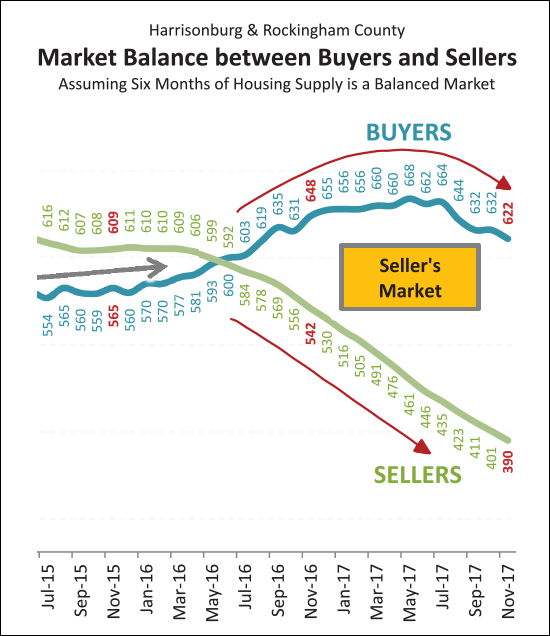
After quite a few years of steady increases in buyer activity -- we are starting to see a decline. Over the past six months we have seen buyer activity taper off and start to decline. I believe this is a direct result of the drastic reductions in the availability of homes for those buyers to buy. As the number of sellers in the market at any given time has declined, eventually that also resulted in a reduction in the pace of buying activity.
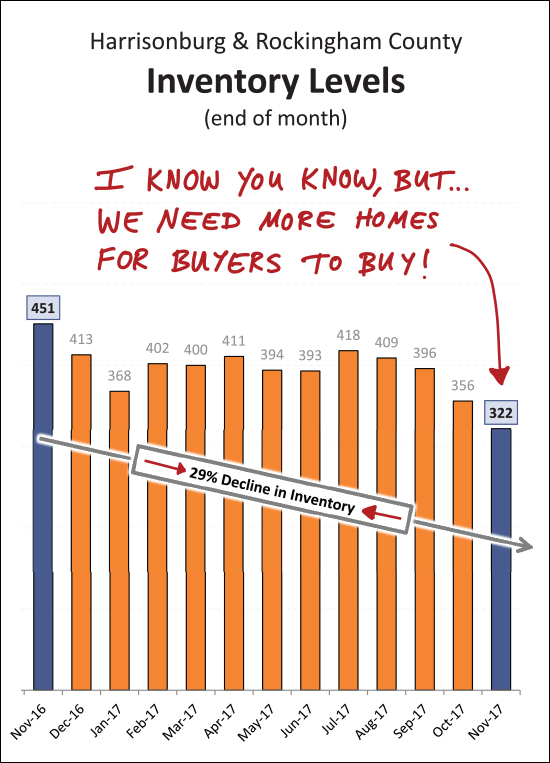
Yeah, so, about those inventory levels. They are low and getting lower!?! And, realistically, when and how do we think that would or could change? In theory, inventory levels will rise this coming Spring -- except they didn't during 2017. Looking back, the end of last November was the highest inventory level we saw for the following 12 months!?! So -- hmmm -- absent any outside factors (new home construction, anyone?) it is possible that the current inventory level (322 homes for sale) could be the highest inventory level we will see for the next 12 months!?! Stop and think about that for a moment....
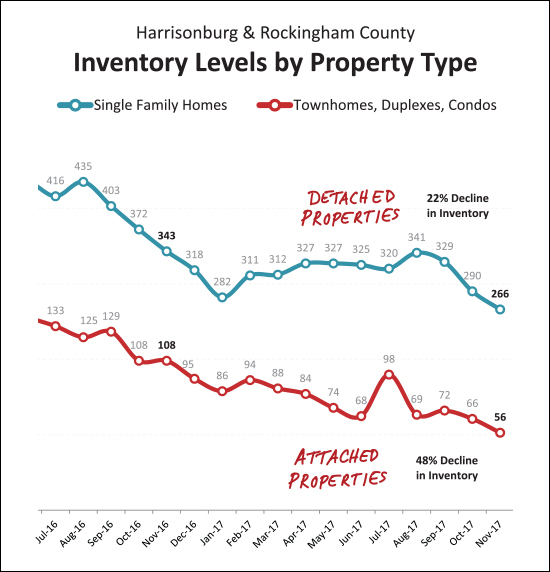
Somewhat interestingly, as shown above, there has been a larger (proportional) decline in inventory levels for attached properties (townhouses, duplexes, condos) than for single family detached properties. There are now only 56 townhouse/duplex/condo properties available for sale in all of Harrisonburg and Rockingham County! And finally -- one last look at some interesting trends....
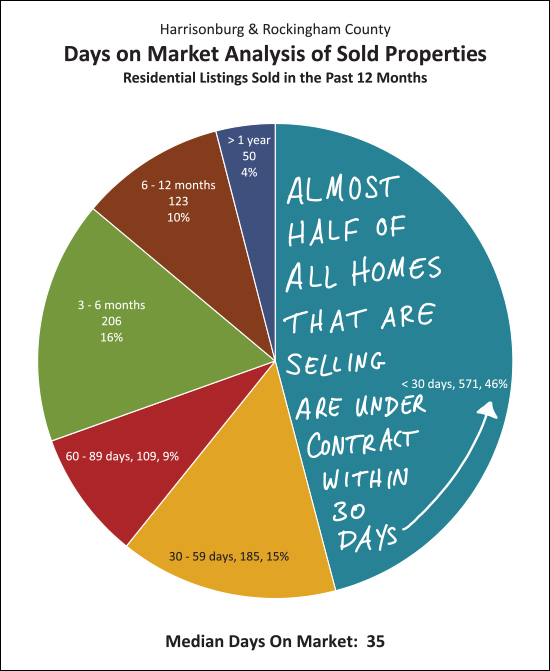
As shown above, nearly half (46%) of homes that are selling (not of all that are listed) are selling (going under contract) within 30 days of hitting the market. So -- yes -- the market is moving pretty quickly in many locations and price ranges! OK -- I'll stop there for now. There is plenty more in my full market report, so feel free to download it as a PDF, read the entire report online, or watch/listen to a video overview of this month's report. And, my reminders for buyers and sellers last month still apply.... SELLERS -- even though it is a seller's market in many price ranges right now, you must still focus on price, condition and marketing. For further reading on buying or selling in this area, check out.... | |
Realtor Association and Madison Center for Community Development Publish Local Housing Needs and Market Analysis |
|
 The Harrisonburg-Rockingham Association of Realtors and the Madison Center for Community Development recently (Nov 2016) published a Housing Needs and Market Analysis of the Harrisonburg and Rockingham County area. There is a LOT of data, analysis and insight in this report -- so feel free to download and read it if this is of interest to you -- or I'll bring some further highlights from it to my blog in the near future. Download the report here. | |
Most Contracts Result In Home Sales |
|
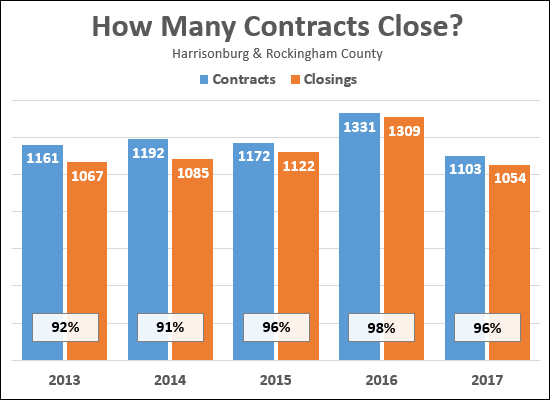 Most of the time, it seems, a contract will result in a closing. OF NOTE -- this is a very (very!) imprecise analysis. In some ways, it is most useful as an indicator of trends over time, but here goes nonetheless.... Per the data above, in 2016....
Does this mean that only 22 contracts fell through? Well, sort of....
But, despite that slight fuzziness, it seems that the success rate of contracts rose to a new high in 2016 -- and thus far in 2017 has been a bit slower than last year -- though on pace with 2015. | |
Contracts slow in November 2017 within context of declining inventory |
|
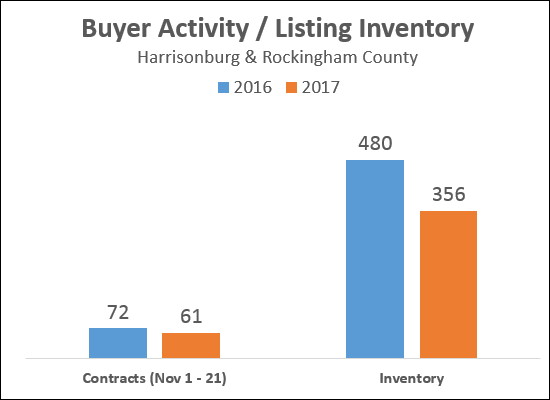 In the first 21 days of November, this year, 61 buyers have signed contracts to purchase homes in Harrisonburg and Rockingham County. Compare that to last year, when 72 buyers had signed such contracts, and you'll note that there has been 15% decline in contract activity when examining this relatively small window of time. Why might this be happening? Perhaps it is because buyers have fewer and fewer options of homes to purchase. Also shown above, you'll note that in early November of this year, buyers had 356 listings from which to choose -- and last year they had 480 choices. This marks a 26% year over year decline in options for buyers. I am hopeful that we'll see this inventory situation turn around at some point, but until or unless it does, buyers are not likely to have very many options for homes to purchase. | |
During which month are you least likely to sell your home? |
|
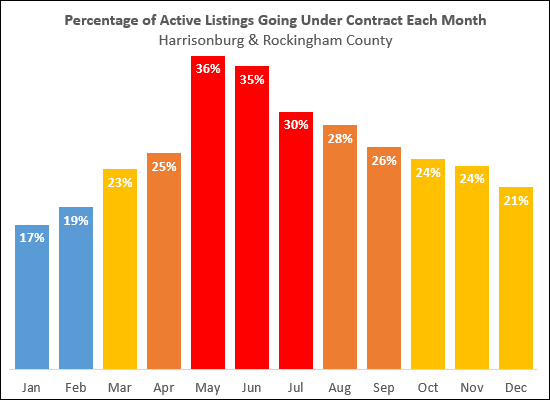 The graph above examines what percentage of active listings went under contract in each of the past12 months -- thus, accounting for both fluctuation in buyer activity as well as fluctuation in inventory levels. It seems you are least likely to sell your home (have it go under contract) in January or February -- when less than 1 in 5 homes goes under contract. That is in stark contrast to May through July where approximately 1 in 3 homes goes under contract each month. | |
Contract activity slightly stronger than expected in October 2017, but Winter is coming! |
|
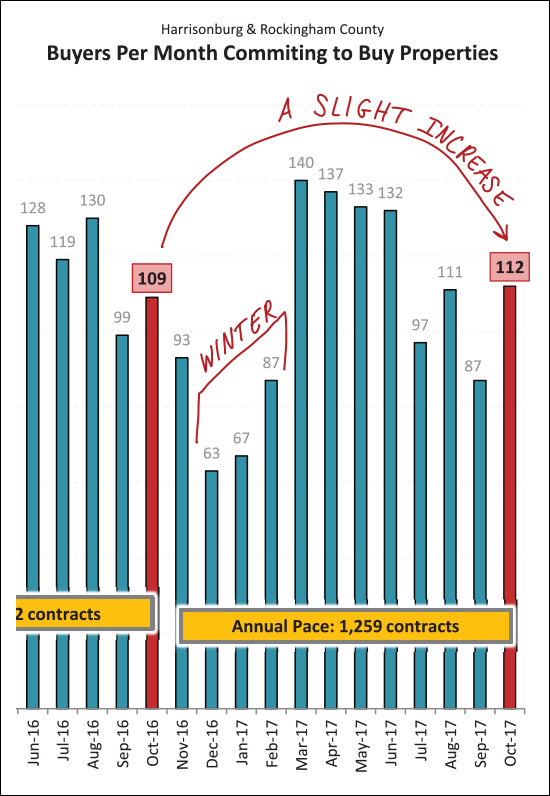 Contract activity in July, August and September 2017 (295 contracts) was a good bit slower than last year when there were 348 contracts during that same timeframe. Some of this decline in the number of contracts being signed is certainly a result of lower inventory levels. Thus, it was somewhat of a surprise that contract activity in October 2017 (112 contracts) was slightly higher than last October when there were only 109 contracts signed. So -- a slight uptick in buyers being able to successfully negotiate deals with sellers -- BUT don't forget, Winter is coming! Over the past eight months there have been an average of 119 contracts signed per month. If last Winter (+/-) is any indication, that is likely to drop slightly in November, and then much more significantly in December, January and February. Last Dec-Feb, there were an average of 72 contracts signed per month -- a good bit less than the 119/month average from the past eight months. Read more about our overall housing market in my most recent monthly market report.... 
| |
Strong Sales Year for Duplexes, Townhouses, Condos |
|
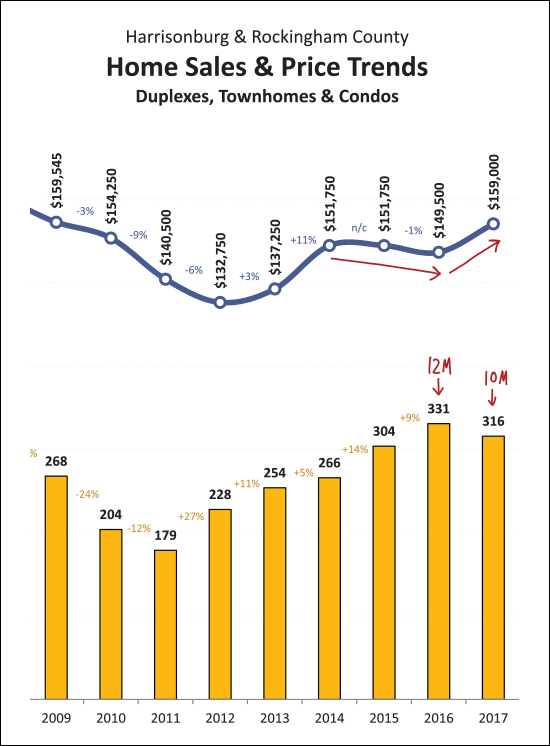 As shown above, this has been a strong year for "attached home sales" -- which includes duplexes, townhomes and condominiums -- but does not include single family detached homes....
Stay tuned for the end-of-year results, but the sales trajectory in this property category is looking promising. Read more about our overall housing market in my most recent monthly market report.... | |
Local Home Prices Rise Despite Slightly Slower Sales Pace |
|
 Find out more about this new listing in Lakewood Estates shown above by clicking here. I just published my most recent monthly market report, and as usual, you can read on for an overview, download the full report as a PDF or read the entire report with commentary online. Taking a look, first, at a high level overview of the market thus far in 2017.... 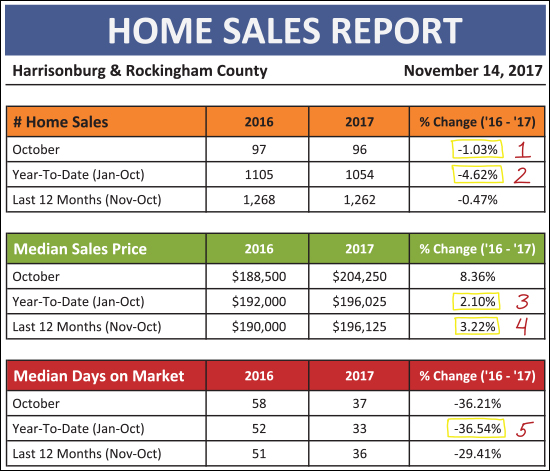 As shown above....
So -- while slightly fewer (-5%) homes are selling this year, they are selling at higher (+2%) prices, and are selling much (+37%) more quickly! 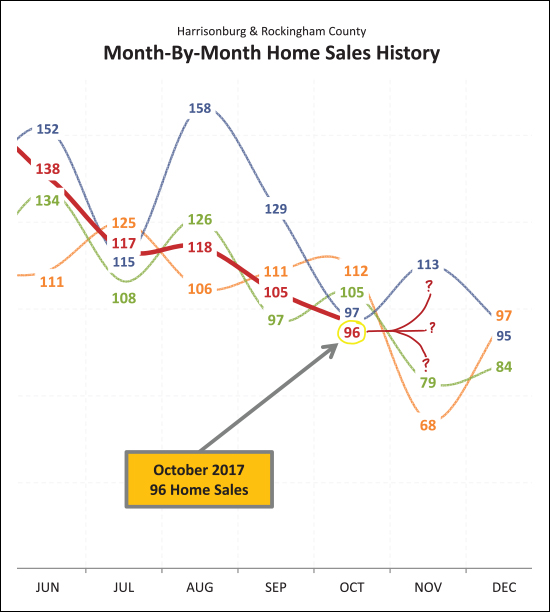 As shown above, this year lost its momentum in August and September -- where monthly home sales (118, 105) were no match for last year (158, 129). Things leveled out, a bit, in October -- with just about the same number of home sales (96 vs. 97) this year as last year. Where things will go next month is anyone's guess -- looking at the past three years, November home sales have ranged from 68 all the way up to 113! 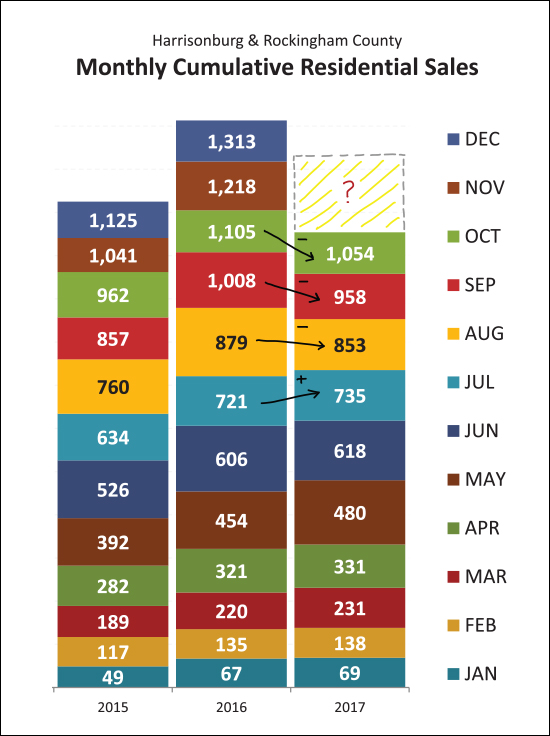 Above, visualized slightly differently, you can see that 2017 home sales were on par with (actually exceeding) last year up and through July before we then fell behind in August, September and now October. It seems certain that we'll finish out the year with fewer home sales this year than last, but more than in 2015. All that said -- as one of my clients pointed out -- maybe we shouldn't care if home sales slow down? 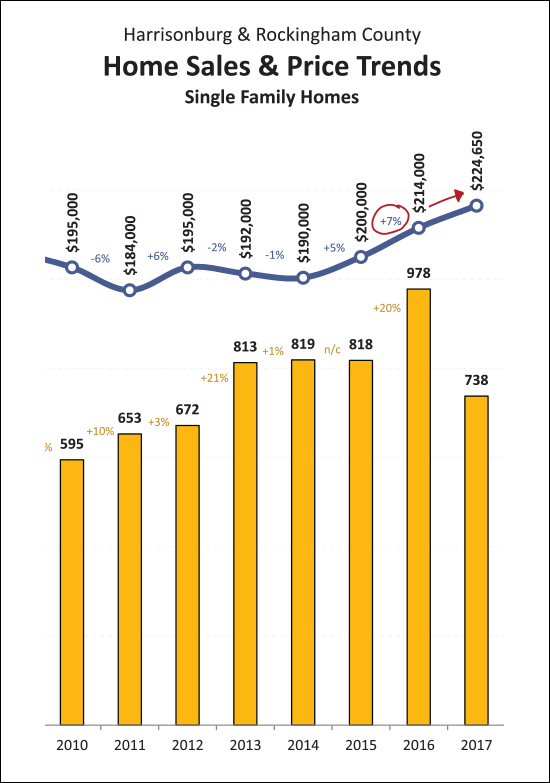 Indeed -- a slightly slower pace (-5%) of home sales might not be an negative indicator of market health -- that decline could be a result of declining inventory levels. Perhaps a better sign of a robust and improving local real estate market is the 7% increase in the median sales price of single family homes between 2015 and 2016, and the apparent 5% increase we seem likely to end up with in 2017. 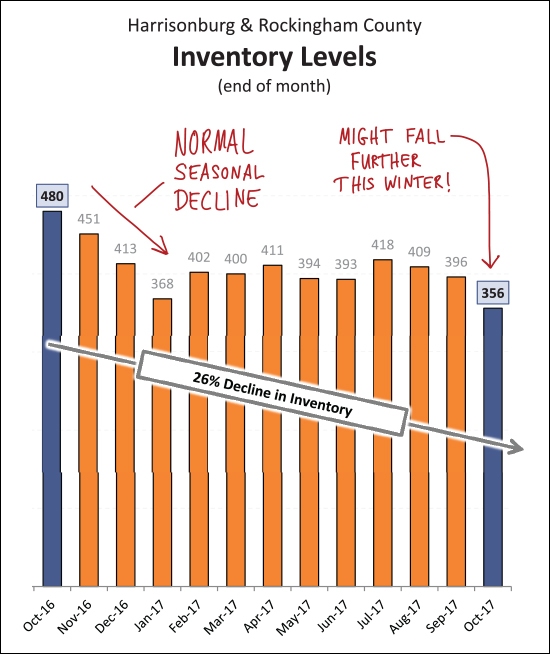 Speaking of slowing sales possibly being a result of lower inventory levels -- yes -- inventory levels are still way (-26%) below where they were last year at this time. And -- no good news here -- it would seem that we will likely see a further seasonal decline in the number of homes on the market as we continue through November, December and January!? Home buyers will likely have a tough time finding options over the next few months -- depending on their price range, where they want to (or are willing to) buy, etc. Let's pause there for now -- though I will continue to explore the latest trend in our local housing market in the coming days on my blog. Until then -- feel free to download and read my full market report as a PDF, or read the entire report online. And if you will be preparing to sell your home soon, you might find these websites helpful.... | |
| Newer Posts | Older Posts |
Scott Rogers
Funkhouser Real
Estate Group
540-578-0102
scott@funkhousergroup.com
Licensed in the
Commonwealth of Virginia
Home Search
Housing Market Report
Harrisonburg Townhouses
Walk Through This Home
Investment Properties
Harrisonburg Foreclosures
Property Transfers
New Listings

